Candace Shamieh
Many organizations have faced the complex challenges that come with mainframe monitoring. MIPS-based cost models make native mainframe software expensive, and deploying individual agents to user desktops and devices is difficult to maintain and scale. To address these challenges, Bottomline Technologies—a leading provider of financial technology—has created Bottomline Record and Replay, a non-invasive mainframe security solution that allows you to monitor legacy IBM Mainframe 3270 and IBM System 5250 users via network traffic.
We’re excited to announce that you can now install an integration and purchase a software license to Bottomline’s Record and Replay offering in the Datadog Marketplace. By using Bottomline Record and Replay in Datadog, you have the ability to view mainframe user and system activity alongside resource performance and availability all within one platform.
In this post, we'll discuss how you can use our Bottomline integration to track and analyze mainframe user sessions, security events, and resource performance with an out-of-the-box (OOTB) dashboard, as well as how to build Datadog detection rules and security signals to monitor unusual activity.
Track user and system activity to optimize your mainframe
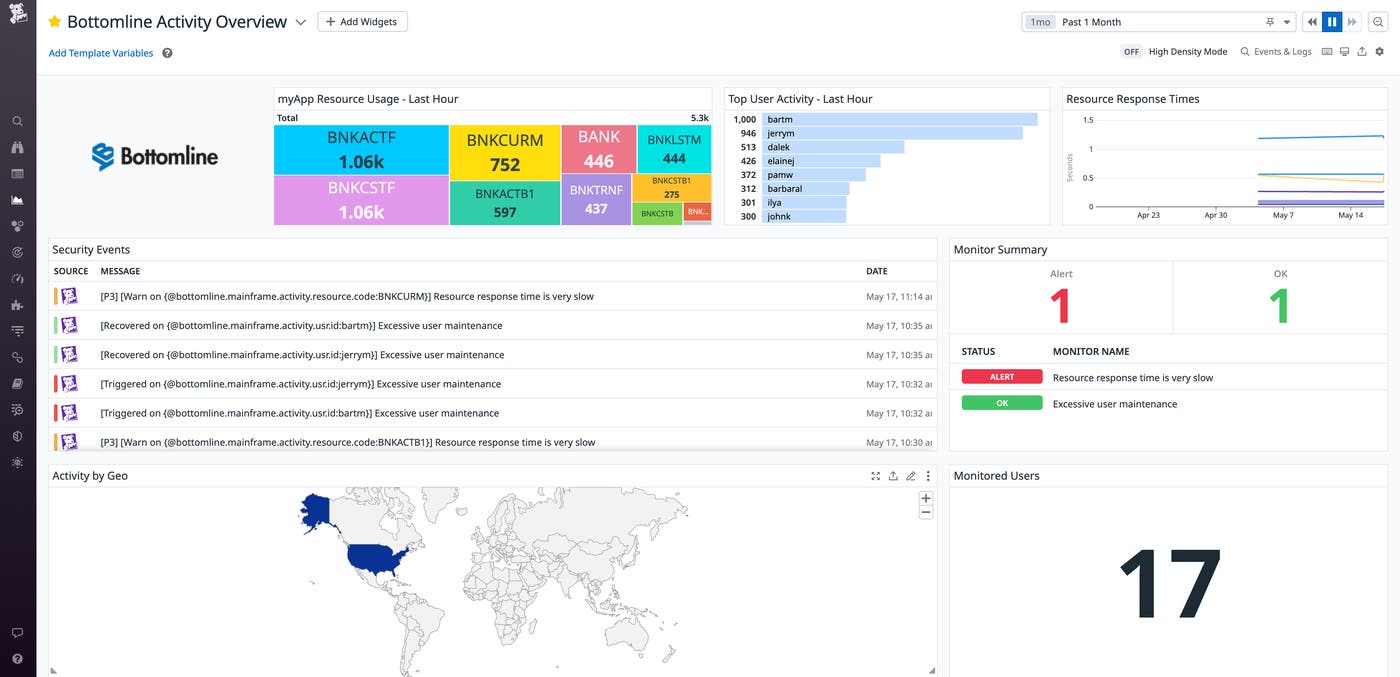
After setting up the Bottomline integration, mainframe user and system activity, resource usage, and resource response times will begin to populate in Datadog Log Management. Your internal audit, risk analysis, IT, and security teams can use the pre-built log pipeline, OOTB dashboard, alerting capabilities, and metrics to help you monitor and optimize your mainframe resources.

The Bottomline Activity Overview dashboard is easily modifiable, letting you choose which information you’d like to see and the format that best displays it. You can monitor resource usage and gain insight into which specific resources are being used, how often they’re accessed, and the location they’re accessed from. You can also analyze your resource response times to identify patterns, anomalies, and trends that will help you quickly identify the root cause of performance slowdowns and effectively mitigate any related issues. The dashboard also shows a list of security events with brief descriptions, as well as the status of Bottomline’s recommended monitor which will trigger if mainframe resources are too slow to respond. All of these events and metrics will have related logs that display more information about your mainframe applications, including the event attributes and processes.
You can also create custom alerts that will notify SREs of any performance issues. SREs can trigger the familiar Datadog Incident Management workflow directly from a security event or alert within our platform. You can assign remediation tasks and conveniently gather information from the incident timeline in order to improve mainframe system performance.
Monitor and replay suspicious user activity
Beyond monitoring maintenance events and viewing log files, you can also create your own detection rules in Datadog Cloud SIEM and set alerts and security signals that can notify your team if unusual activity is detected.
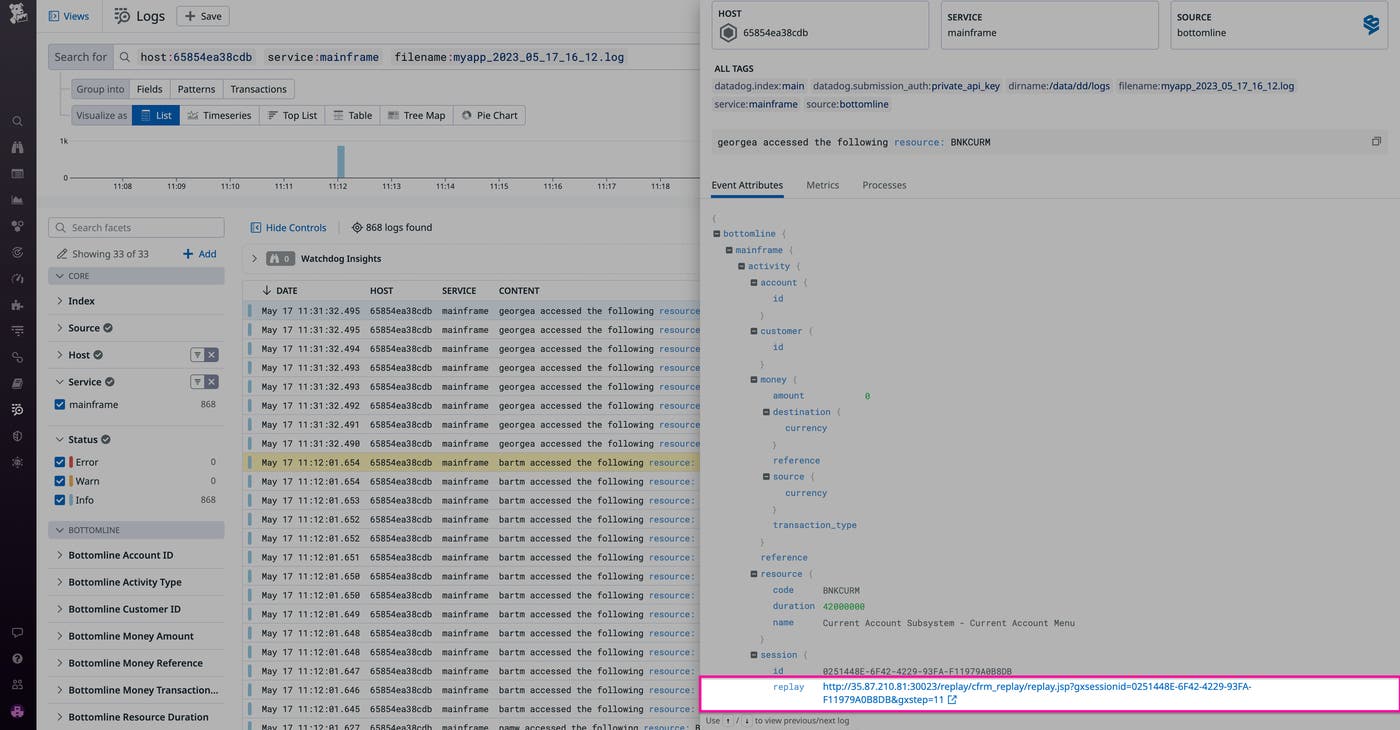
Let’s say a security signal alerts you to suspicious activity in the form of excessive login attempts to a specific account on one of your mainframe applications. From the dashboard in Datadog, you can select the event from the Security Events list and review the corresponding logs to see more information. From the Event Attributes tab, you can select the “replay” option under the “session” heading in order to pivot directly from Datadog to the Bottomline user activity session that triggered the security event.

Bottomline Record and Replay will show exactly what the user did to help you determine whether further investigation is required. Because activity is recorded, you can visually replay user activity that occurred on your mainframe applications at any time to aid your investigation.

Get started with Bottomline and Datadog today
The Bottomline Record and Replay integration with Datadog gives you enhanced visibility into your mainframe so that you can detect threats and data breaches, manage and improve performance, and see a full picture of user and system activity. To begin monitoring your mainframe with Datadog, you can purchase a software license in the Datadog Marketplace and install the Bottomline integration. If you aren’t already a Datadog customer, you can learn more about the Marketplace in our blog post and sign up for a 14-day free trial of Datadog today.
The ability to promote branded marketing tools is a membership benefit offered through the Datadog Partner Network. If you’re interested in developing an integration or application that you’d like to promote, you can contact us at marketplace@datadog.com.

