Thomas Sobolik

Tori Teng
Logs provide granular, point-in-time insights into the health, security, and performance of your environment, making them critical for auditing, performance analysis, incident response, security investigations, and more. Many organizations generate millions or even billions of log events across their tech stack every day, which are used by a variety of teams to accomplish a multitude of tasks—including investigating bugs in code, tracing breaches, and searching for the root cause of outages. However, an organization’s logging schema is often controlled by a central observability team, rather than by the engineers and analysts who query those logs. And because these stakeholders lack familiarity with and ownership of the schema, they may struggle to quickly build effective log queries—especially if they are recent hires.
Datadog Log Management provides a seamless, point-and-click log search experience that makes it easy to conduct efficient logs investigations. It includes:
- Recent searches and saved views that enable users to retain and recall common queries
- Keyboard shortcuts and raw syntax to help experienced users quickly enter queries
- Syntax highlighting and instructive error messages to help users quickly remedy errors in their queries
In this post, we’ll discuss how you can use Log Management’s search features to not only enable your teams to rapidly build and reuse queries, but also ensure that they are complete and accurate.
Build queries faster
The Log Management search experience offers a number of features to help your teams investigate logs more quickly, which is especially important during time-critical scenarios such as security breaches, service outages, and failed code deployments.
Autocomplete queries to speed up investigations
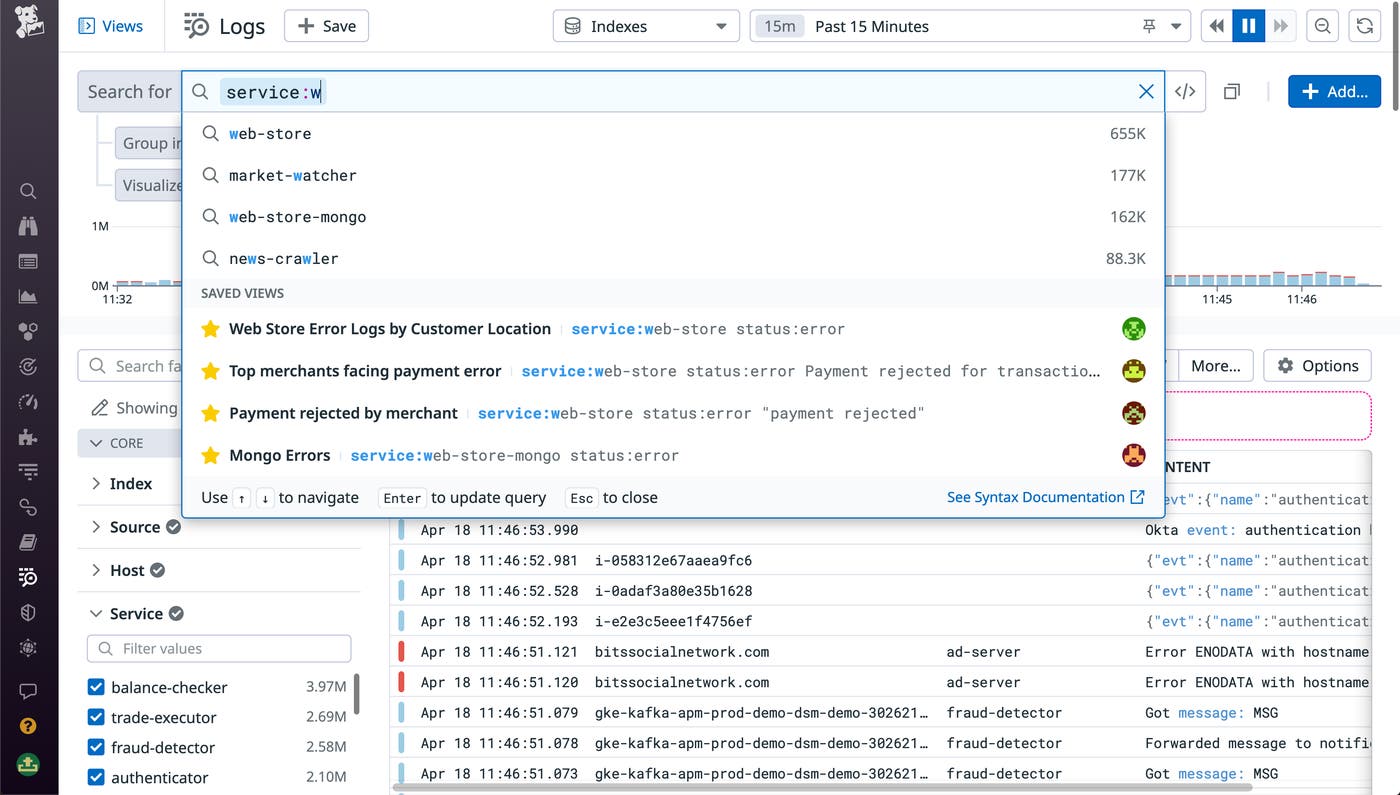
When building log queries, users often need to enter long, esoteric search terms—such as hostnames, container IDs, and IP addresses—which can be especially difficult for recent hires to remember. The Datadog log search bar autocompletes facets and values, reducing the burden on users to find or recall these terms.
Reuse recent searches and Saved Views
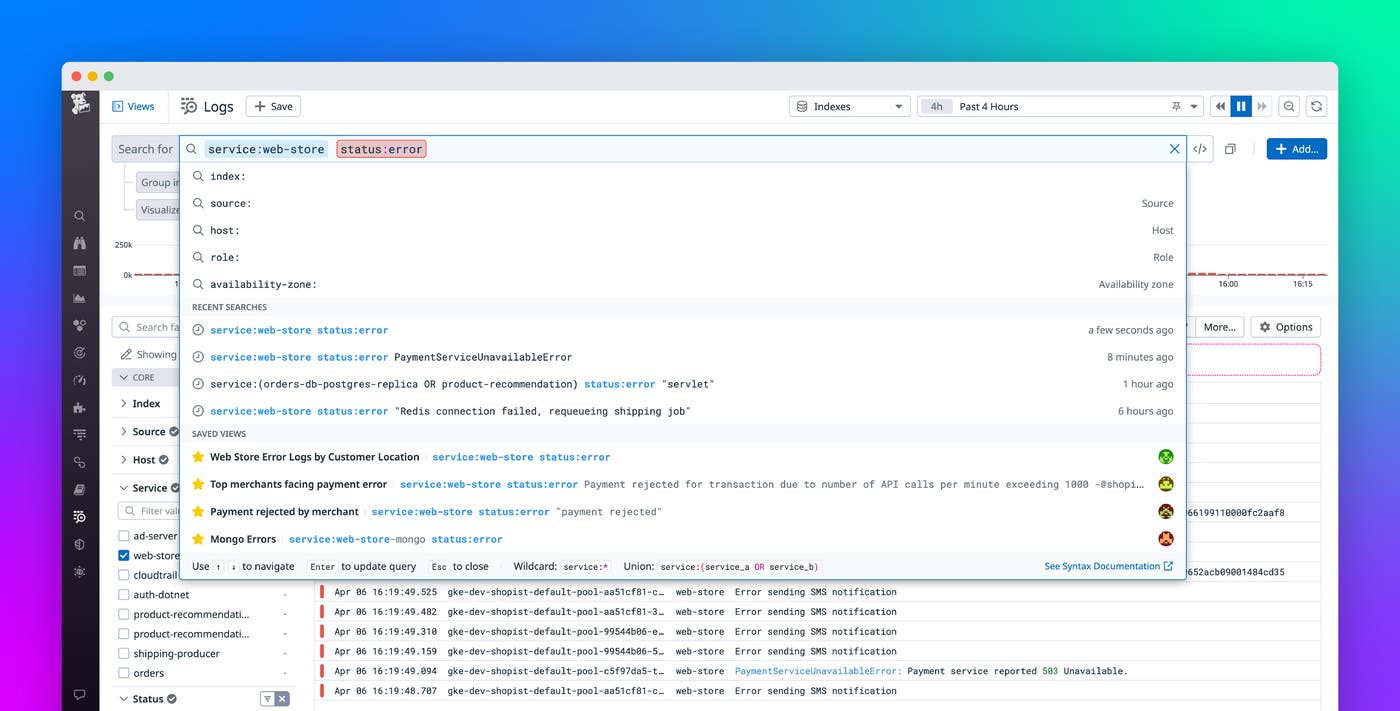
As they perform investigations, your team members will likely be context switching frequently to simultaneously access different log queries. Keeping track of—and repeatedly re-entering—these queries can be time-consuming and prone to errors. To reduce the need for users to constantly recall and manually re-enter queries during investigations—and ultimately reduce their MTTR—the Log Explorer automatically retains each user’s 100 most recent searches. In the following example, we can see recent searches containing the service:web-store status:error terms that specify various errors. The search bar also shows how long ago each recent search was run, so investigators can quickly find the recent searches from a particular session.
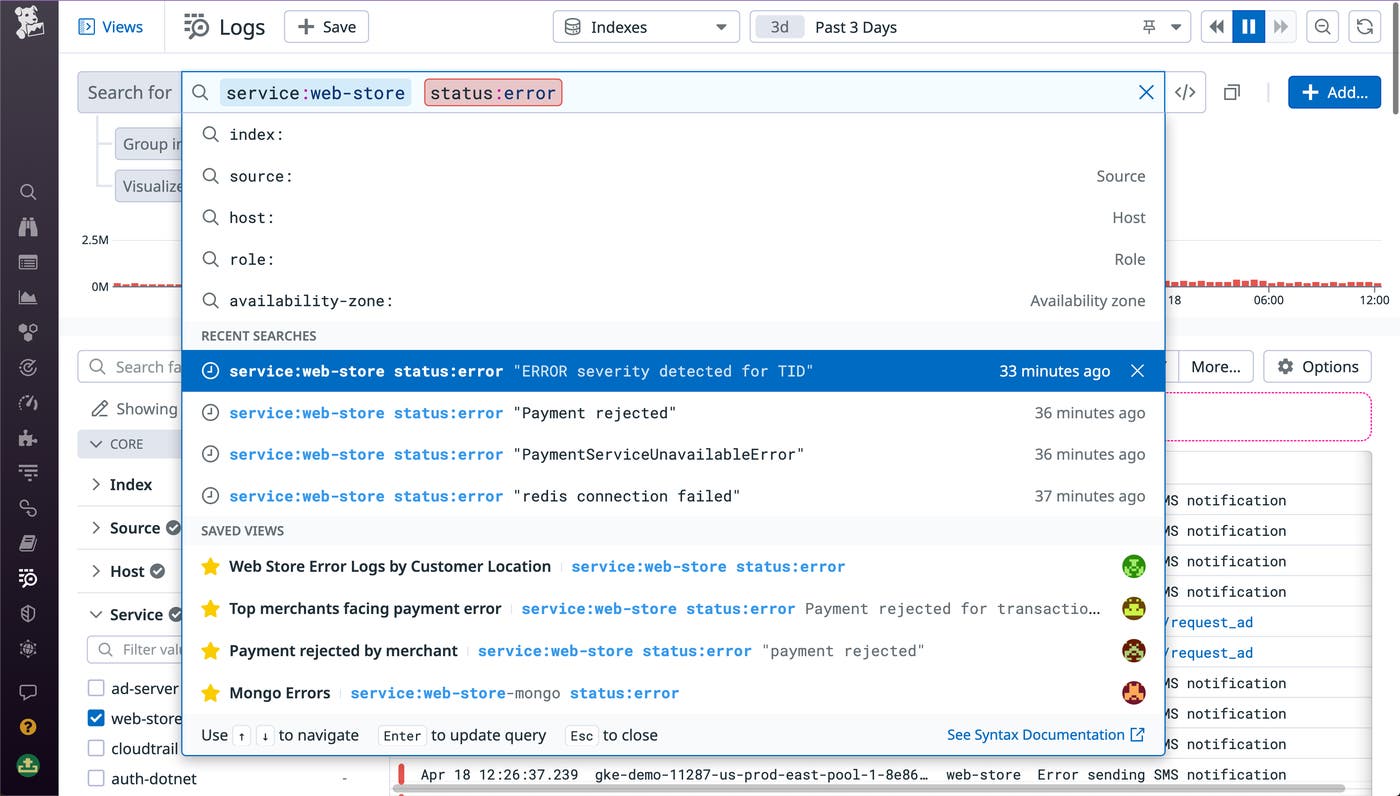
In addition to recent searches, the Log Explorer also enables you to create Saved Views, which save queries for centralized access by everyone in your organization. By keeping Saved Views for common queries, you can help your teams streamline collaboration in both long-term and routine investigations.
Navigate seamlessly by using raw mode and keyboard shortcuts
Modern engineers maintain complex and varied setups to juggle many different workflows, including writing code, reviewing PRs, writing documentation, and monitoring. In order to seamlessly pivot among workflows and navigate environments smoothly, many experienced engineers prefer to navigate by using keyboard interactions. The Log Explorer supports keyboard shortcuts for writing, selecting, copying, pasting, and submitting queries, so users can construct queries and search logs by typing rather than scrolling and clicking. Experienced users can also opt to turn off syntax highlighting and autocomplete, so they can type out queries without having to hopscotch around these assistive elements.
Easily interpret and troubleshoot complex queries
While building queries in a complex, shifting logging schema with many long attribute names, it’s likely that your team members will run into syntax errors. These errors can cause queries to fail or return inaccurate results, hampering investigations. Syntax highlighting and error treatment make queries easier to parse and errors more identifiable, so your members can ensure that their queries are complete and accurate.
The Log Management search bar’s syntax highlighting clearly differentiates input types, such as keys, values, free text, and control characters. This makes it easier for users to check their queries for completeness, as well as for newer users to quickly learn the syntax. In the following example, we can see that the error status attribute is specially highlighted in red, and that control characters (including the parentheses, colons, and Boolean statement) are brightly colored to differentiate them from the keys and values.
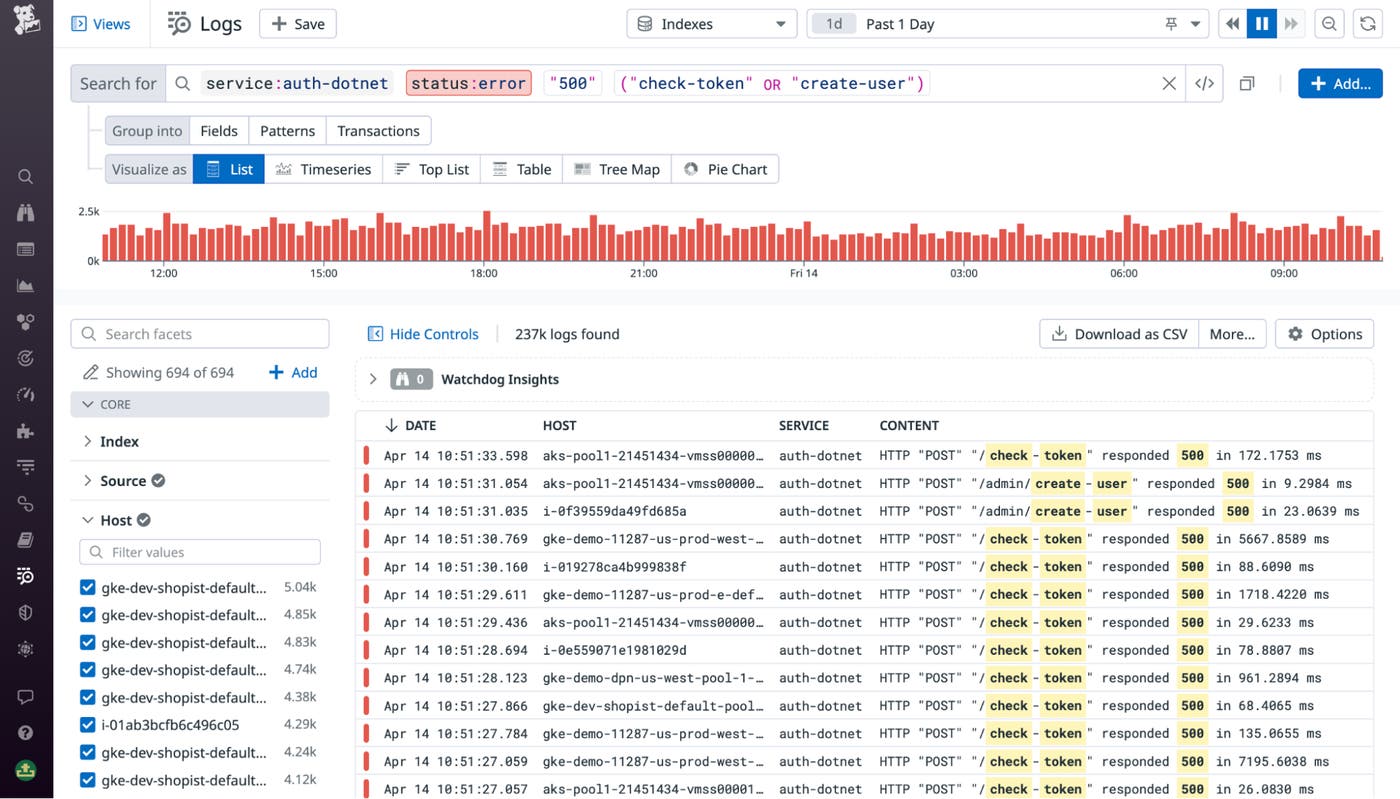
Even when a user selects multiple values for a log field (i.e., by using an “OR” statement), the search bar displays all of the values up front instead of consolidating them behind a label. All fields are displayed with their full addressable names, rather than display names or other abbreviations. This makes it easier for any stakeholder—regardless of their familiarity with their organization’s log schema—to read, understand, and iterate on queries.
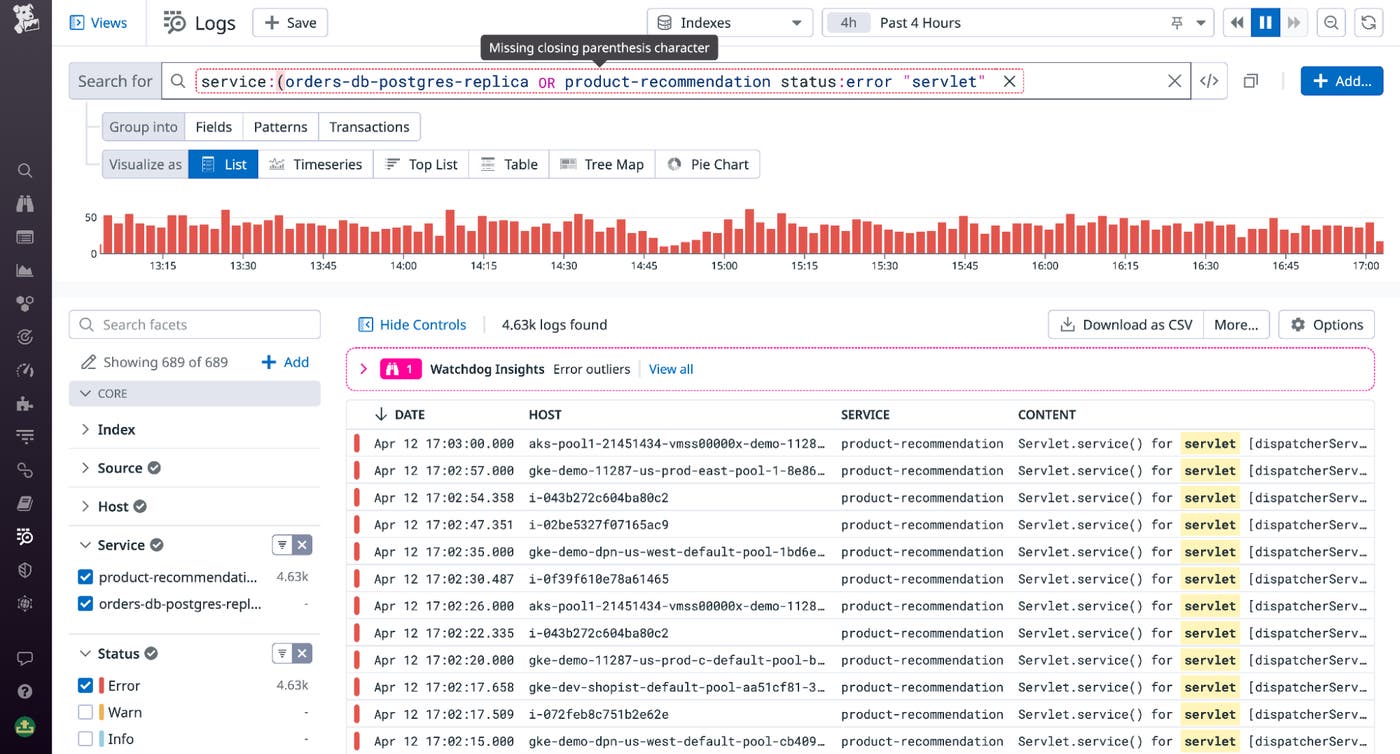
To help team members quickly spot syntax errors, the search bar highlights errorful search terms and displays clear hints on the expected input on hover. For example, if a user adds brackets for a range query but doesn’t fill in the high and low values, the message “expected term but end of input found” will be displayed. In the following example, we can see a message highlighting a missing closing parenthesis character in a Boolean statement.
Search your logs quickly and accurately
Whether you’re an SRE investigating an incident, a security engineer gathering evidence, or a support engineer writing an incident postmortem, you need an efficient log querying solution available at your fingertips. Datadog Log Management’s search experience helps these personnel—among many others—conduct investigations quickly and painlessly by helping them construct complete and accurate log queries. For more information on Log Management, see our documentation. Or, If you’re brand new to Datadog, sign up for a 14-day free trial to get started.
