Steve Harrington
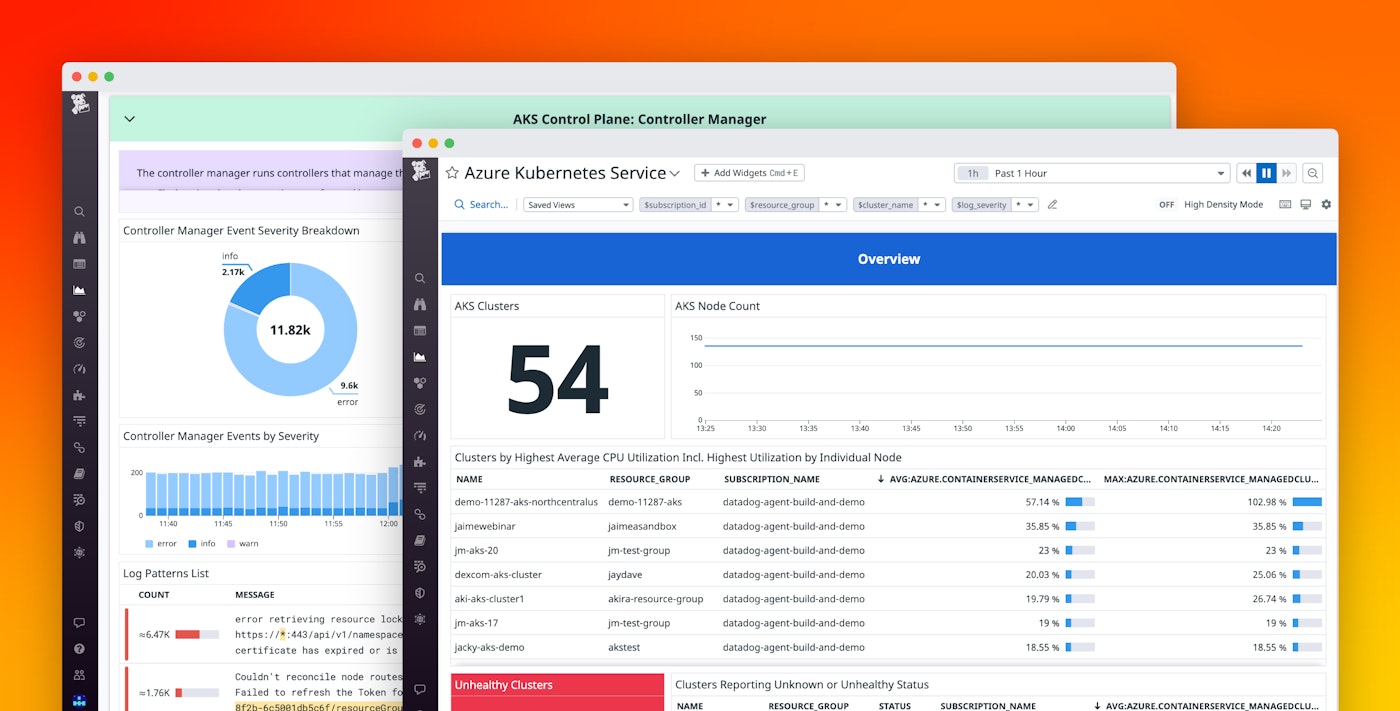
We’re pleased to announce a new out-of-the-box dashboard for Azure Kubernetes Service (AKS) that allows you to immediately visualize the health and performance of your AKS clusters. This dashboard organizes and highlights the most critical information from the standard AKS metrics, while also incorporating log data to provide observability into the control plane.
In an AKS environment, Azure manages the control plane. This makes it simpler to deploy and run your containerized workloads. However, it also means visibility into these components is limited to a handful of standard Azure metrics, even after you’ve enabled Datadog’s Agent-based Kubernetes integration. AKS resource logs contain highly granular data about events occuring in the control plane, but it can be difficult to extract meaningful information from them. With this update, Datadog automatically processes and visualizes these logs in our new AKS dashboard, providing critical insights into the control plane—with no manual configuration required.
Visualize cluster health and performance in our new out-of-the-box AKS dashboard
Datadog’s new AKS dashboard makes it easy to keep tabs on your containerized workloads and visualize trends anywhere in your clusters, including in the control plane, where standard Azure Monitor metrics are limited. Within minutes of installing the Azure integration, the AKS dashboard delivers visibility into your clusters’ health and performance at the cluster, node, and pod levels. This enables you to monitor and alert on important AKS resource utilization metrics like CPU, memory, and storage usage, as well as cluster health information like pod phase and state.
Monitor your cluster’s control plane components
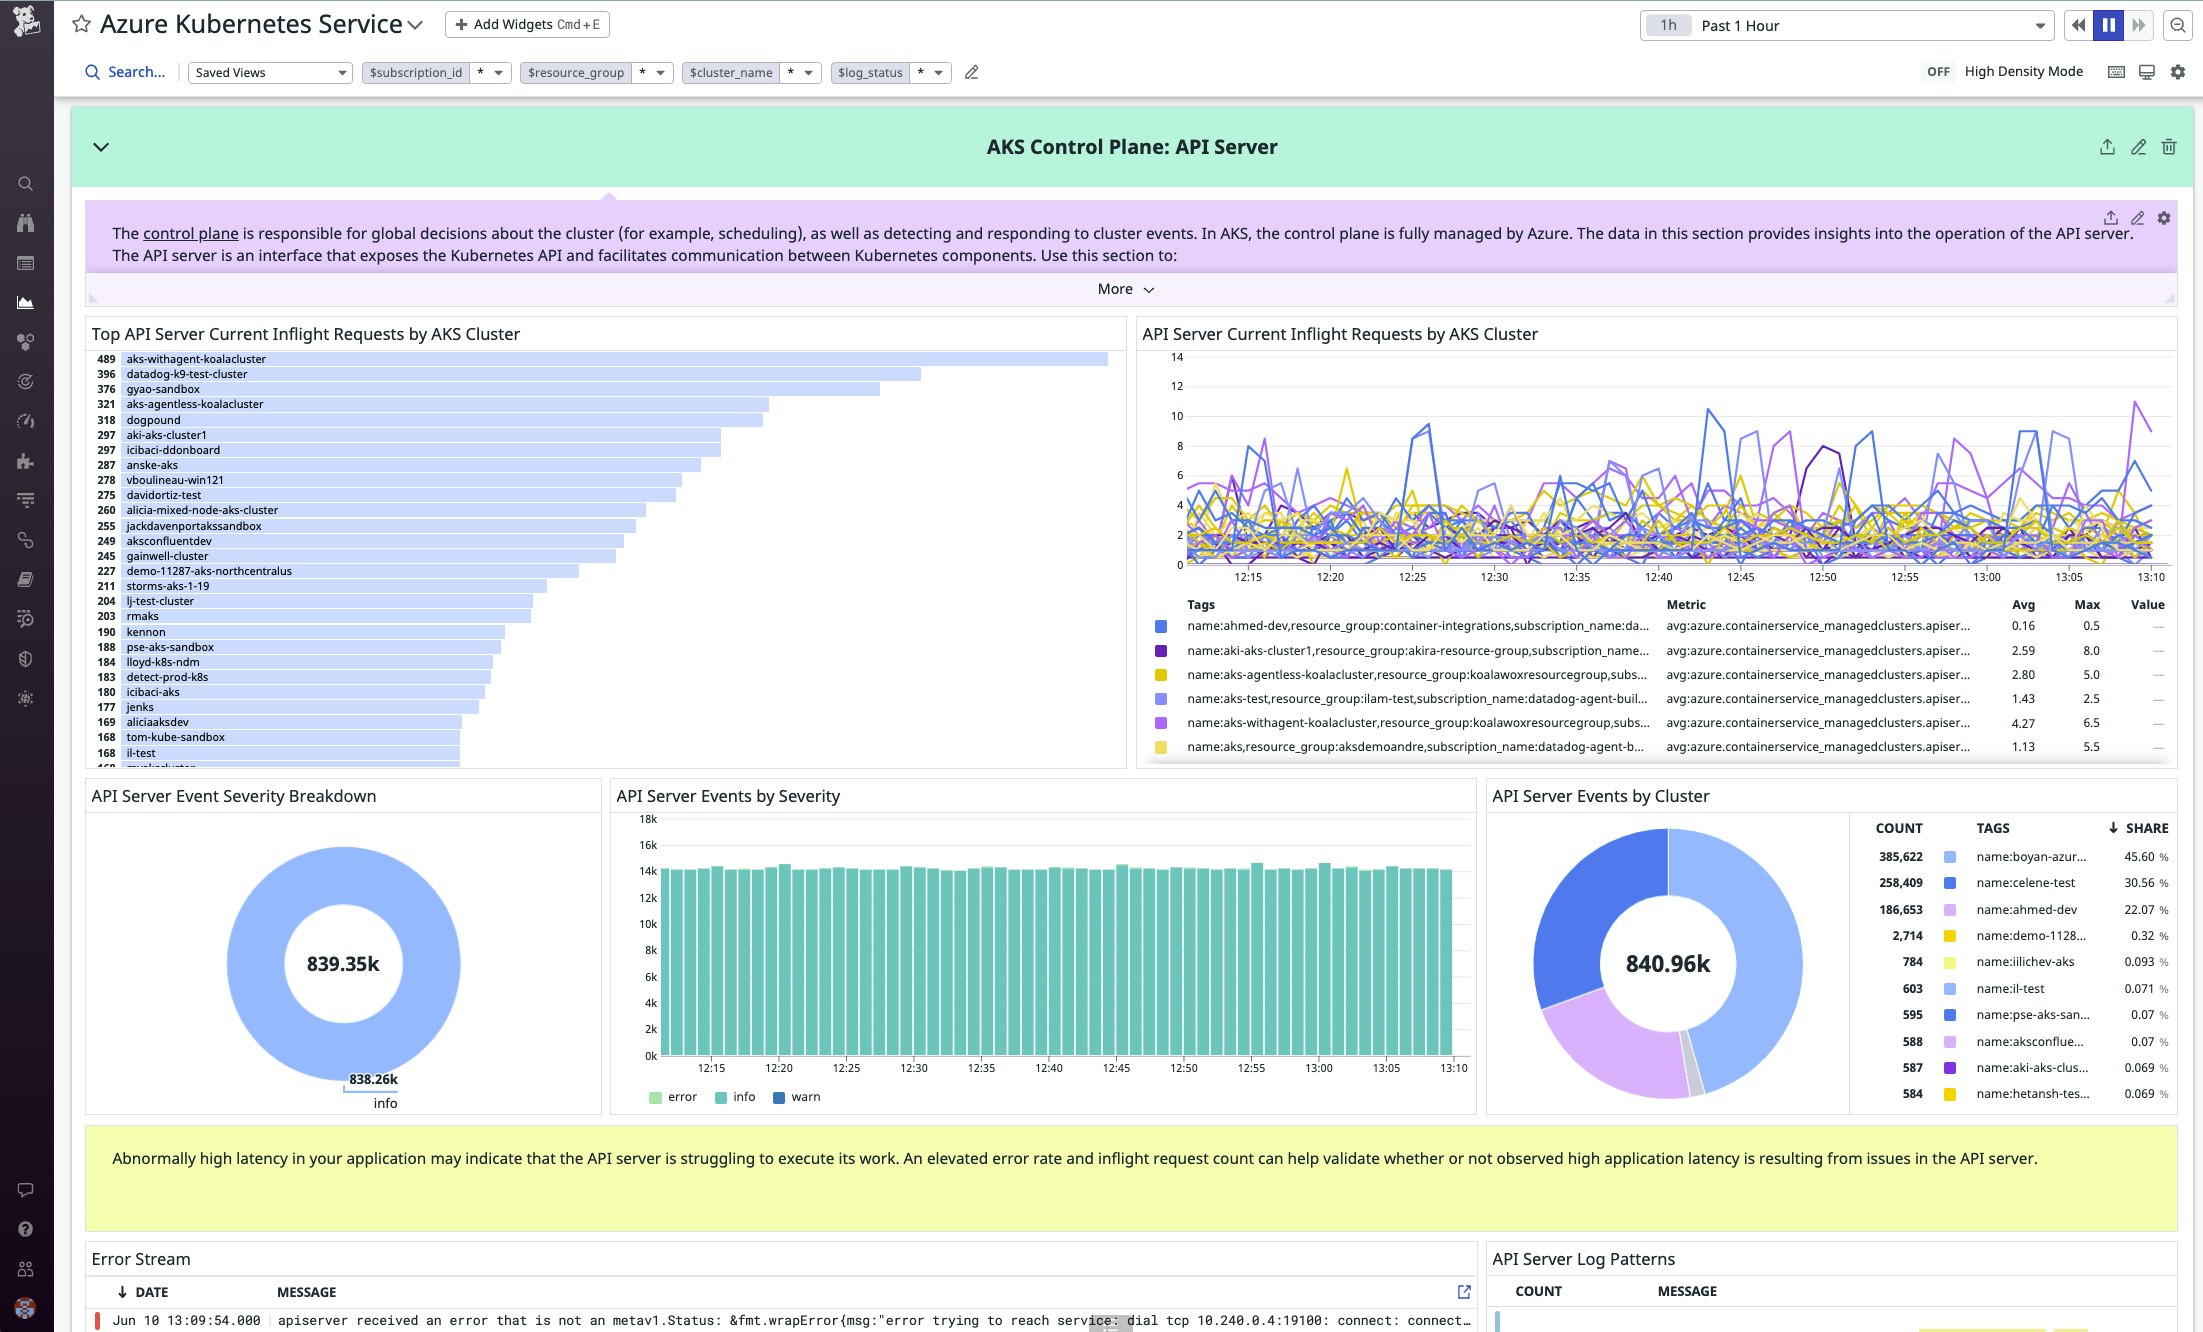
In a Kubernetes cluster, the control plane is responsible for managing worker nodes, scheduling pods, and moving the cluster to a desired state. Our new out-of-the-box AKS dashboard includes critical control plane data from the Kubernetes API server, scheduler, and controller manager.
Control plane data, which includes detailed information about control plane component events and errors, is not available in the standard Azure Monitor metrics. Instead, it is only accessible via AKS resource logs, which can be forwarded to Datadog by using our single-click log forwarding option through the Azure portal. From there, Datadog’s AKS log processing pipeline automatically parses these logs and extracts key data, such as event severity, message, and cause. This processing allows you to immediately leverage this data for insights into the operation of the AKS control plane, without any manual log configuration.
Quickly troubleshoot orchestration issues
The ability to visualize control plane data from the API server can provide valuable insights into the health and performance of your cluster’s orchestration layer. For example, if you’re seeing abnormally high latency in your application, this could indicate a scheduling issue related to the Kubernetes API server, which exposes the Kubernetes API and facilitates communication among cluster components. Using our new dashboard, you can check for an elevated error rate in the API server logs combined with a high or rising inflight request count to determine if this is contributing to the observed latency. The error messages and types will also provide useful context for determining if the API server is the culprit. The API server is managed by Azure, but there are still often actions you can take to mitigate issues in situations like this. For example, if you have the containerized Datadog Agent deployed on your cluster, you may want to explore using the Datadog Cluster Agent to help relieve stress on the API server.

Visibility into your cluster’s control plane components can also help you diagnose potential workload issues. The Kubernetes scheduler, for example, is responsible for assigning pods to worker nodes that can satisfy the pods’ resource requirements. You can troubleshoot spikes in the number of failed schedule attempts by checking for corresponding error logs with the scheduler and your worker nodes’ resource utilization. If these values are not in line with expectations, you may need to reduce your pod resource requests or adjust other policy constraints. You can also correlate this metric with Kubernetes audit logs for additional insights into the source of the issue.
Get better visibility into AKS today
Datadog’s AKS integration, which is bundled together with our Azure integration, ingests key health and performance metrics from your AKS clusters, automatically processes logs from your control plane components, and visualizes all of this data in the new AKS dashboard. To get started, simply install our Azure integration and configure log forwarding.
For even deeper visibility into your containerized application, deploy the Datadog Agent into your AKS cluster. The Agent enables collection of Kubernetes logs and events, distributed traces, service-level metrics, application logs, and more, all the way down to the container level.
Not yet a Datadog customer? Get started with a free 14-day trial.


