
Emily Chang
When Kubernetes launches and schedules workloads in your cluster , such as during an update or scaling event, you can expect to see short-lived spikes in the number of Pending pods . As long as your cluster has sufficient resources, Pending pods usually transition to Running status on their own as the Kubernetes scheduler assigns them to suitable nodes. However, in some scenarios, Pending pods will fail to get scheduled until you fix the underlying problem.

In this post, we will explore various ways to debug Pending pods that fail to get scheduled because of:
- Node-based scheduling constraints, including readiness and taints
- Pods' requested resources exceeding allocatable capacity
- PersistentVolume-related issues
- Pod affinity or anti-affinity rules
- Rolling update deployment settings
At the end of this post, we will discuss a few ways to proactively keep tabs on Kubernetes scheduling issues.
A primer on Kubernetes pod status
Before proceeding, let's take a brief look at how pod status updates work in Kubernetes. Pods can be in any of the following phases:
- Pending: The pod is waiting to get scheduled on a node, or for at least one of its containers to initialize.
- Running: The pod has been assigned to a node and has one or more running containers.
- Succeeded: All of the pod's containers exited without errors.
- Failed: One or more of the pod's containers terminated with an error.
- Unknown: Usually occurs when the Kubernetes API server could not communicate with the pod's node.
A pod advertises its phase in the status.phase field of a PodStatus object. You can use this field to filter pods by phase, as shown in the following kubectl command:
$ kubectl get pods --field-selector=status.phase=Pending
NAME READY STATUS RESTARTS AGEwordpress-5ccb957fb9-gxvwx 0/1 Pending 0 3m38sWhile a pod is waiting to get scheduled, it remains in the Pending phase. To see why a pod is stuck in Pending, it can be helpful to query more information about the pod (kubectl describe pod <PENDING_POD_NAME>) and look at the "Events" section of the output:
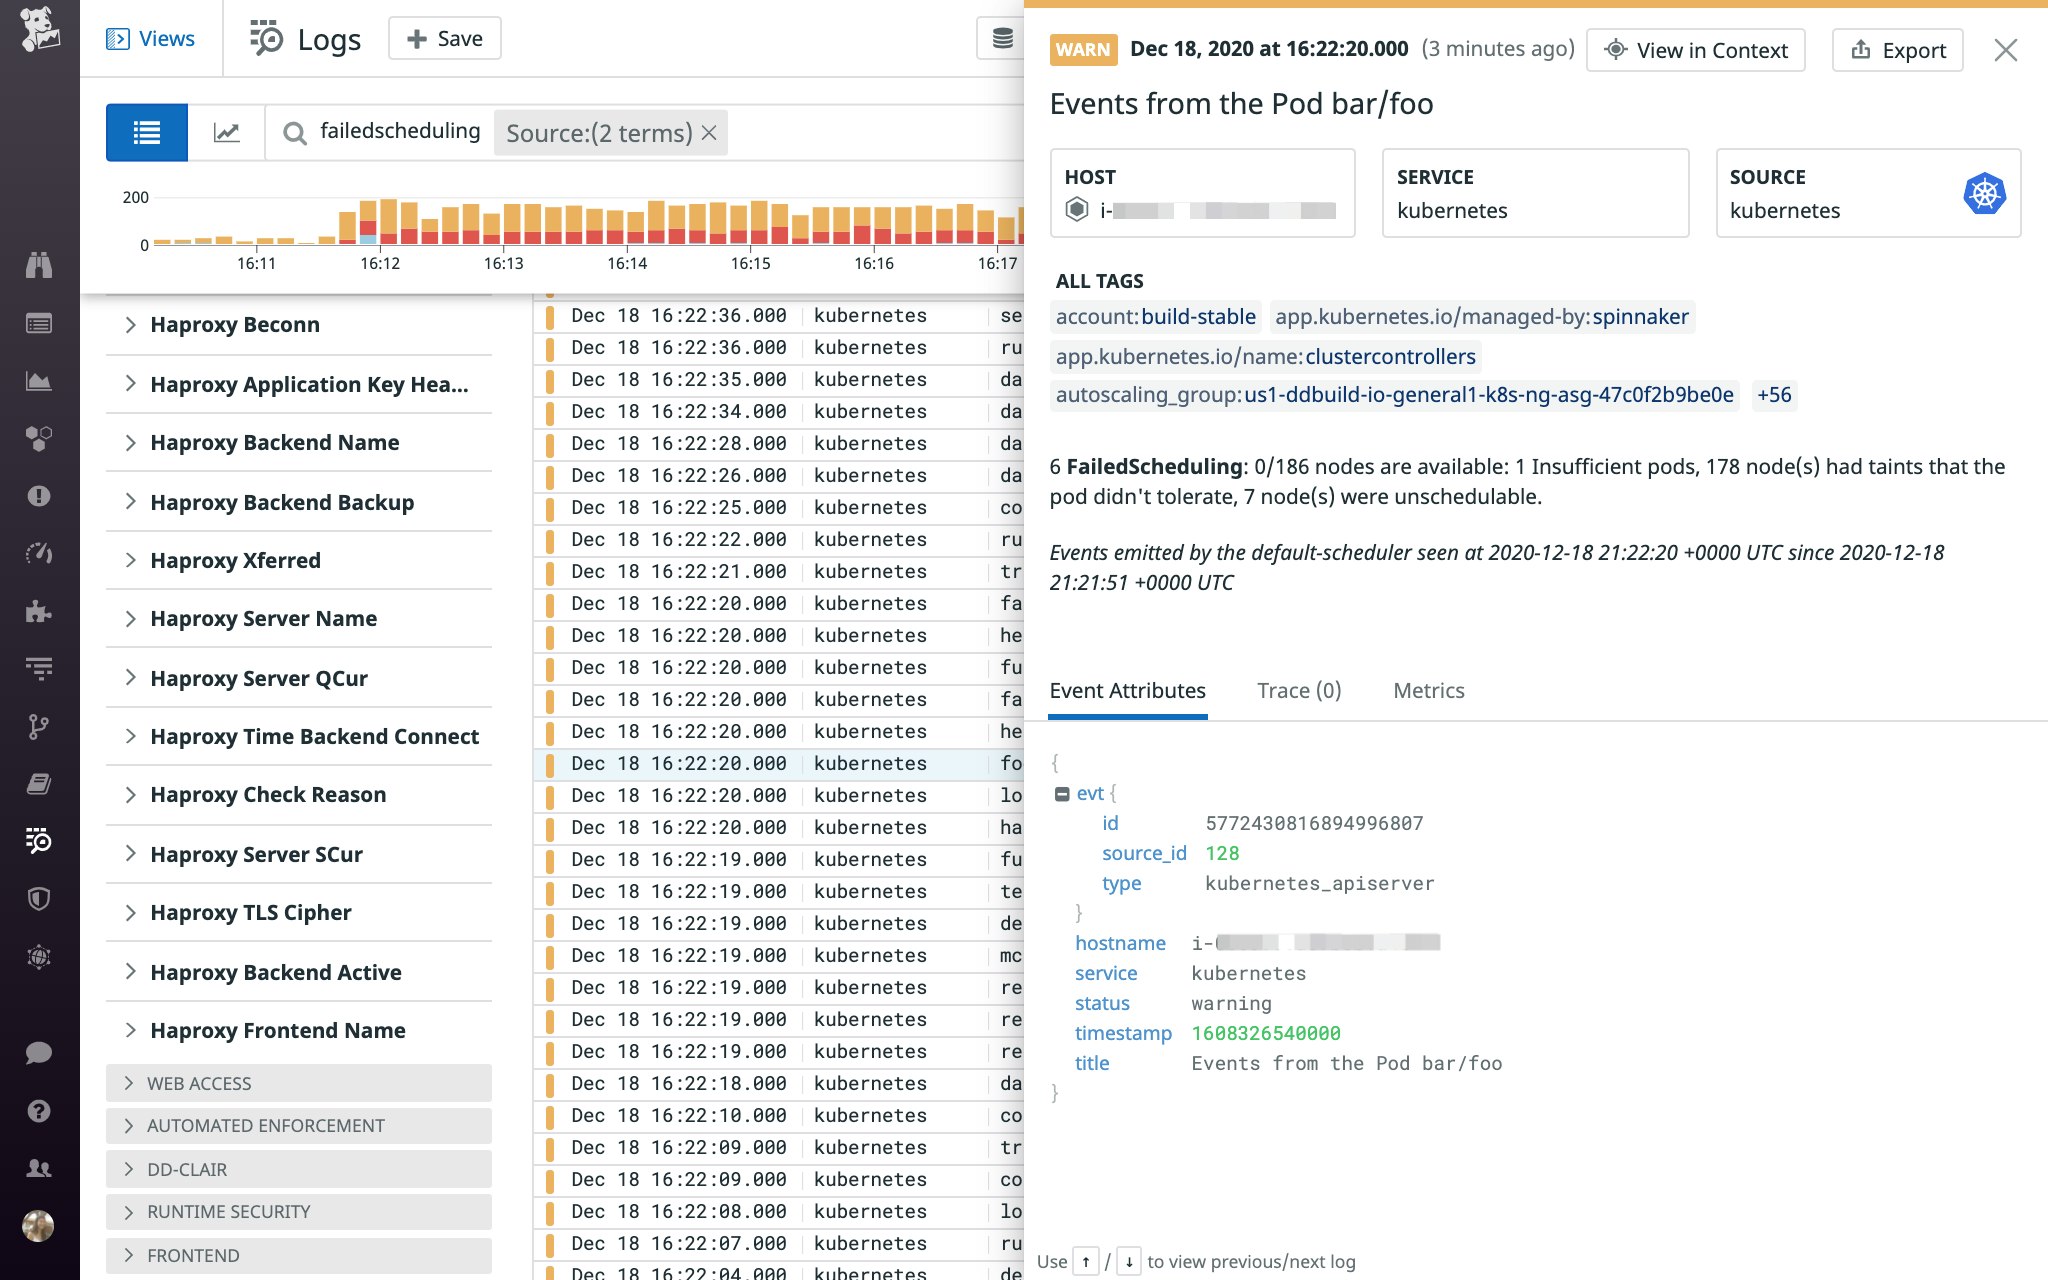
Events: Type Reason Age From Message ---- ------ ---- ---- ------- Warning FailedScheduling 2m (x26 over 8m) default-scheduler 0/39 nodes are available: 1 node(s) were out of disk space, 38 Insufficient cpu.If a Pending pod cannot be scheduled, the FailedScheduling event explains the reason in the "Message" column. In this case, we can see that the scheduler could not find any nodes with sufficient resources to run the pod. These types of FailedScheduling events can also be captured in Kubernetes audit logs.
Kubernetes scheduling predicates
While FailedScheduling events provide a general sense of what went wrong, having a deeper understanding of how Kubernetes makes scheduling decisions can be helpful in determining why Pending pods are not able to get scheduled. The scheduler, a component of the Kubernetes control plane , uses predicates to determine which nodes are eligible to host a Pending pod. For efficiency, the scheduler evaluates predicates in a specific order, saving more complex decisions for the end. If the scheduler cannot find any eligible nodes after checking these predicates, the pod will remain Pending until a suitable node becomes available.
Next, we will examine how some of these predicates can lead to scheduling failures. Some examples use jq to parse kubectl output; if you are interested in following along, make sure you've installed it before proceeding.
Node-based scheduling constraints
Several predicates are designed to check that nodes meet certain requirements before allowing Pending pods to get scheduled on them. In this section, we'll walk through some reasons why nodes can fail to meet these requirements and are thereby deemed ineligible to host Pending pods:
- Nodes are unschedulable
- Nodes are not Ready
- Node labels conflict with pods' node selectors or affinity rules
- Nodes' taints conflict with pods' tolerations
Unschedulable nodes
If you cordon a node (e.g., to prepare the node for an upgrade), Kubernetes will mark it unschedulable. A cordoned node can continue to host the pods it is already running, but it cannot accept any new pods, even if it would normally satisfy all other scheduling predicates. Though unschedulable nodes are not the most common reason for scheduling failures, it may be worth verifying if this is the case—and it's also the first predicate the scheduler checks right off the bat.
If a Pending pod is unable to get scheduled because of an unschedulable node, you will see something similar to this in the kubectl output:
$ kubectl describe pod <PENDING_POD_NAME>
[...]
Events: Type Reason Age From Message ---- ------ ---- ---- ------- Warning FailedScheduling 2m8s (x4 over 3m27s) default-scheduler 0/1 nodes are available: 1 node(s) were unschedulable.Cordoned nodes report a SchedulingDisabled node status, as shown in Datadog's Live Container view below.

Once it has been cordoned, a node will also display an unschedulable taint (more on taints later) and Unschedulable: true in its kubectl output:
$ kubectl describe node <NODE_NAME>
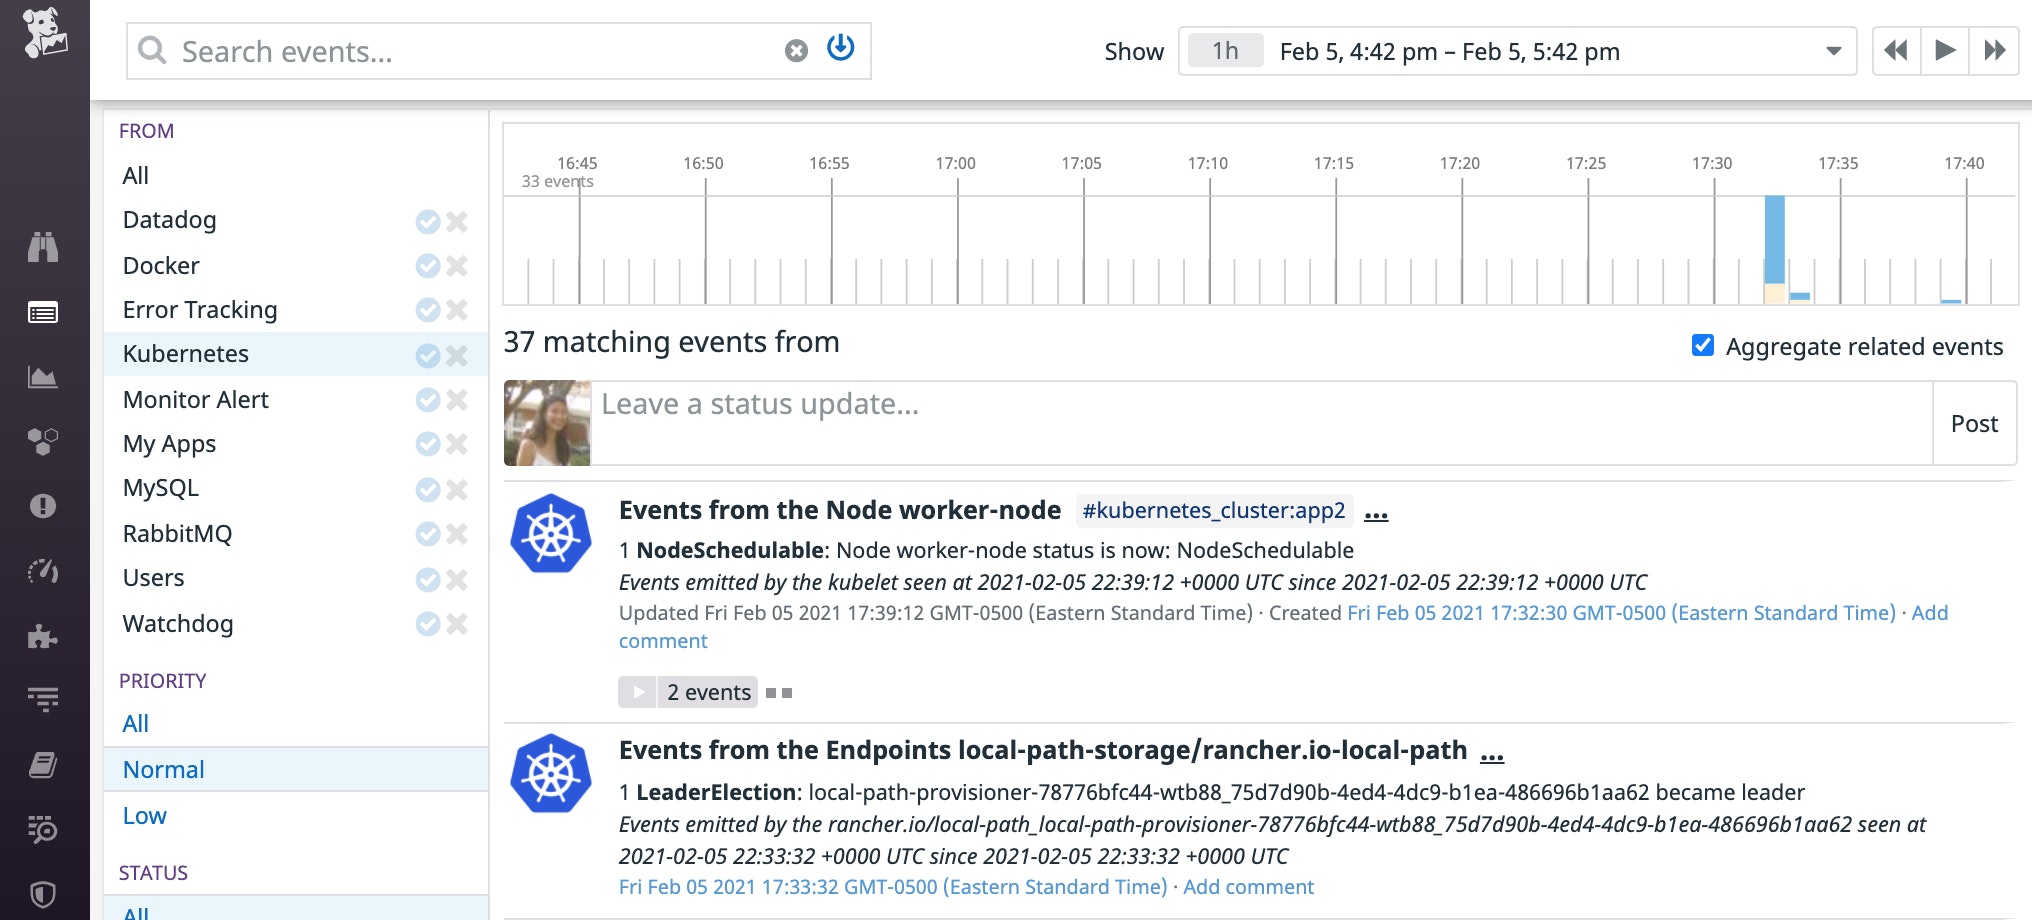
[…]Taints: node.kubernetes.io/unschedulable:NoScheduleUnschedulable: trueIf you still need to keep the node cordoned, you can fix this issue by adding more nodes to host Pending pods. Otherwise, you can uncordon it (kubectl uncordon <NODE_NAME>). This should allow pods to get scheduled on that node as long as the node satisfies other scheduling predicates. Kubernetes will create an event to mark when the node became schedulable again (as shown below).
Node readiness
Each node has several conditions that can be True, False, or Unknown, depending on the node's status. Node conditions are a primary factor in scheduling decisions. For example, the scheduler does not schedule pods on nodes that report problematic resource-related node conditions (e.g., responding True to the DiskPressure or MemoryPressure node condition checks).
Likewise, if a node is not reporting True to its Ready node status condition, the scheduler will not assign Pending pods to it. Monitoring the number of nodes that are not in Ready condition can help ensure that you don't run into scheduling issues.
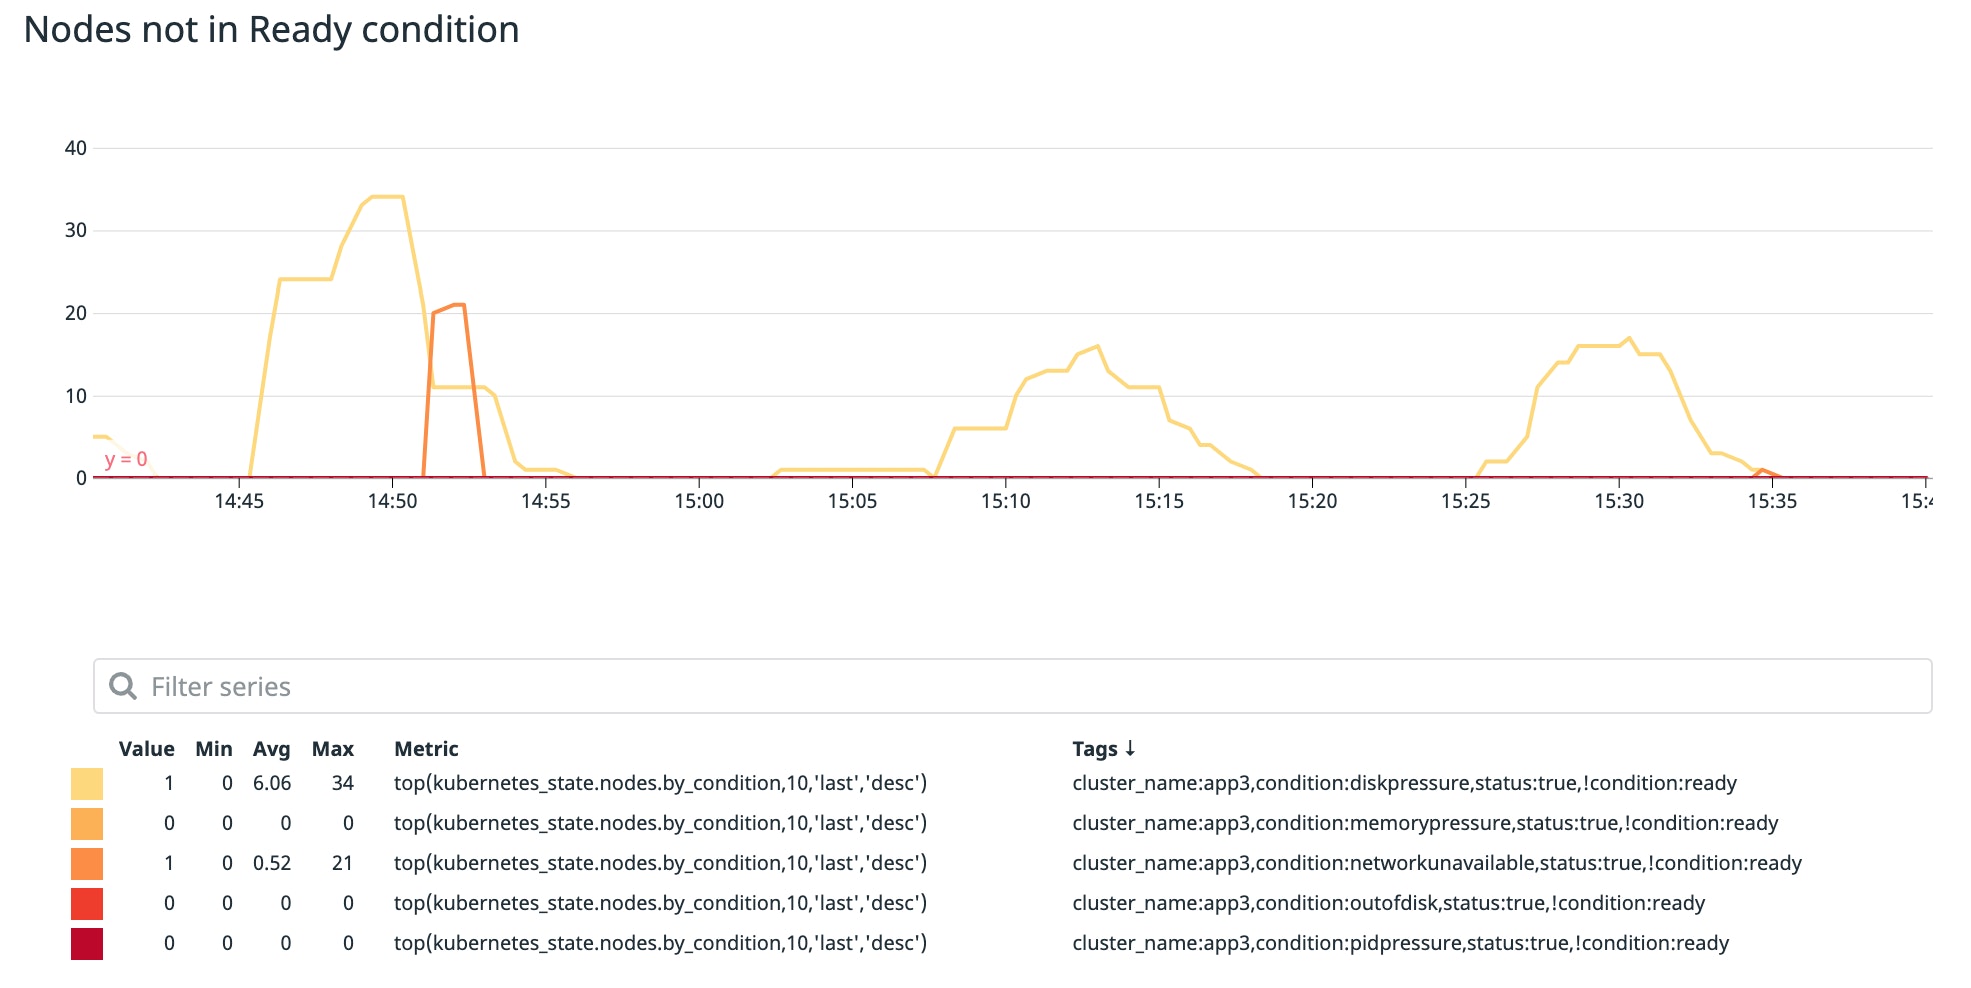
A node may not be Ready for various reasons. In the example below, this node is reporting an Unknown status condition because its kubelet stopped relaying any node status information. This usually indicates that the node crashed or is otherwise unable to communicate with the control plane.
$ kubectl describe node <UNREADY_NODE_NAME>
[…]
conditions:- type: Ready status: Unknown lastHeartbeatTime: 2020-12-25T19:25:56Z lastTransitionTime: 2020-12-25T19:26:45Z reason: NodeStatusUnknown message: Kubelet stopped posting node status.To learn more about node conditions and how they can lead to scheduling failures, see the documentation.
Node labels
Nodes include built-in labels that describe the operating system, instance type (if on a cloud provider), and other details. You can also add custom labels to nodes. Whether they are built-in or custom, node labels can be used in node selectors and node affinity/anti-affinity rules to influence scheduling decisions.
Node selectors
If you need to ensure that a pod only gets scheduled on specific type of node, you can add a node selector to the pod specification. For example, you may use a node selector to specify that certain pods can only get placed on nodes that run an operating system or type of hardware that is compatible with those pods' workloads. The below pod specification uses a node selector to ensure that the pod can only get placed on a node that is labeled with disktype: ssd.
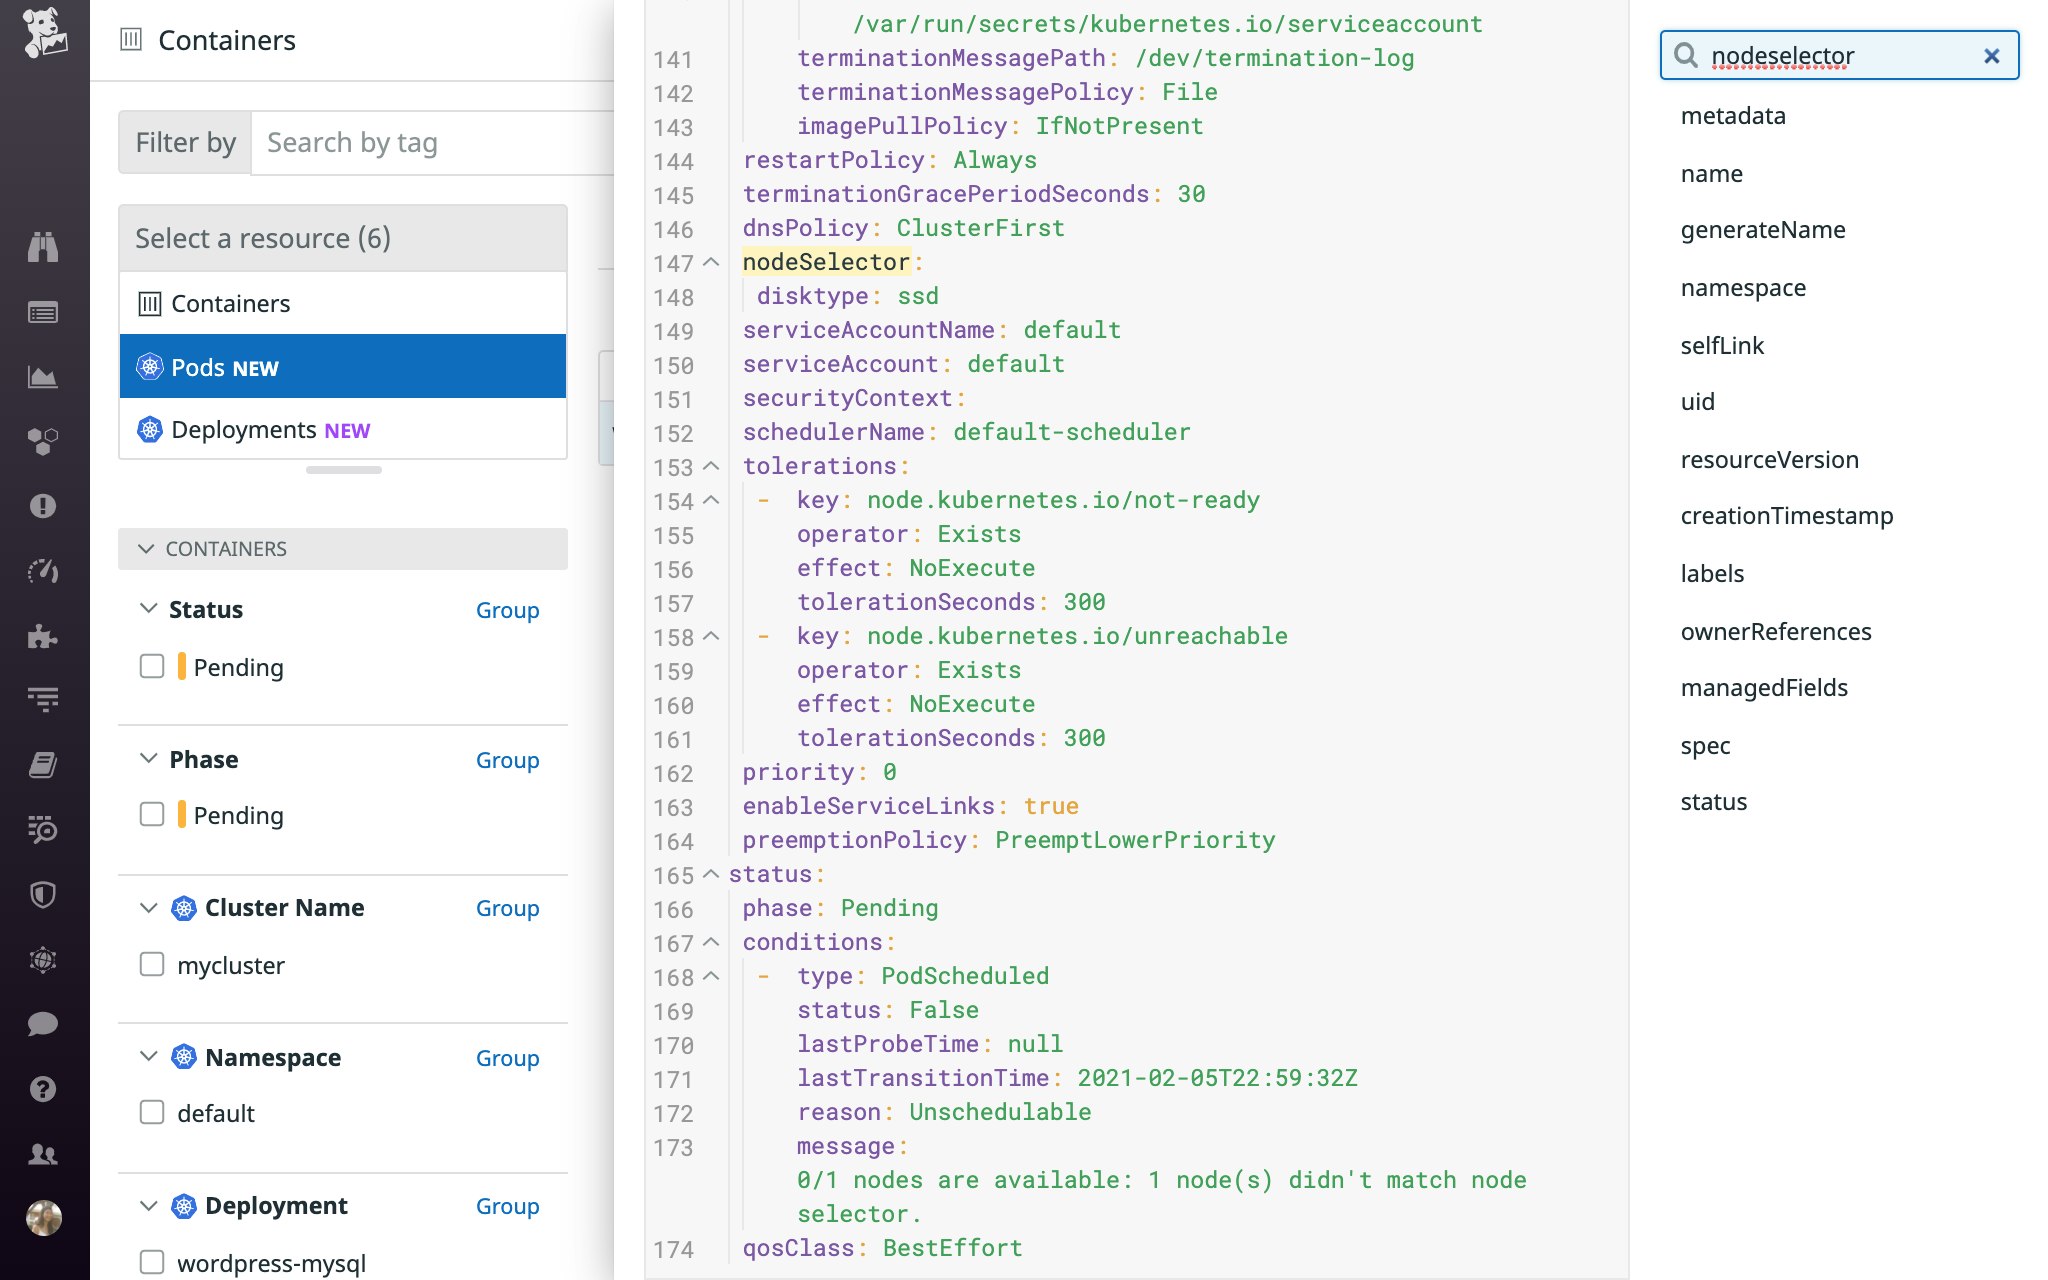
The scheduler takes the MatchNodeSelector predicate into account as it attempts to find a node with a label that matches the pod's node selector. If the scheduler is unsuccessful, you will see a FailedScheduling message similar to this: 0/1 nodes are available: 1 node(s) didn't match node selector. Note that the same message will also appear if the failure was caused by a node affinity or anti-affinity rule (i.e., the nodeAffinity.nodeSelectorTerms field rather than the nodeSelector field), so you may need to check the pod specification to find the exact cause of the issue. We'll cover the latter scenario in more detail in the next section.
To allow this Pending pod to get scheduled, you'll need to ensure that at least one available node includes a label that matches the pod's node selector (i.e., disktype: ssd), and that it meets all other scheduling predicates.
Node affinity and anti-affinity rules
Node affinity and anti-affinity rules can complement or replace node selectors as a way to drive scheduling-related decisions in a more precise manner. Like node selectors, these rules instruct the scheduler to use node labels to determine which nodes are (or aren't) eligible to host a pod.
In addition to using operators to implement logic, you can configure hard (requiredDuringSchedulingIgnoredDuringExecution) or preferred (preferredDuringSchedulingIgnoredDuringExecution) scheduling requirements, lending more flexibility to your use case.
Node affinity and anti-affinity rules are defined under nodeAffinity in the pod specification. The configuration below specifies that the pod can only get scheduled in two zones. Alternatively, you could define an anti-affinity rule instead (e.g., use the NotIn operator to specify any zones this workload should not be scheduled in).
affinity: nodeAffinity: requiredDuringSchedulingIgnoredDuringExecution: nodeSelectorTerms: - matchExpressions: - key: topology.kubernetes.io/zone operator: In values: - us-east-1a - us-east-1bSince this rule is defined as a hard requirement, a scheduling failure will occur if the scheduler cannot find an appropriate node. The FailedScheduling event will include the same message that appears when the scheduler is unable to find a node that matches the pod's node selector: 0/1 nodes are available: 1 node(s) didn't match node selector. It will not specify whether a node affinity or anti-affinity rule was involved, so you'll need to check the pod specification for more information.
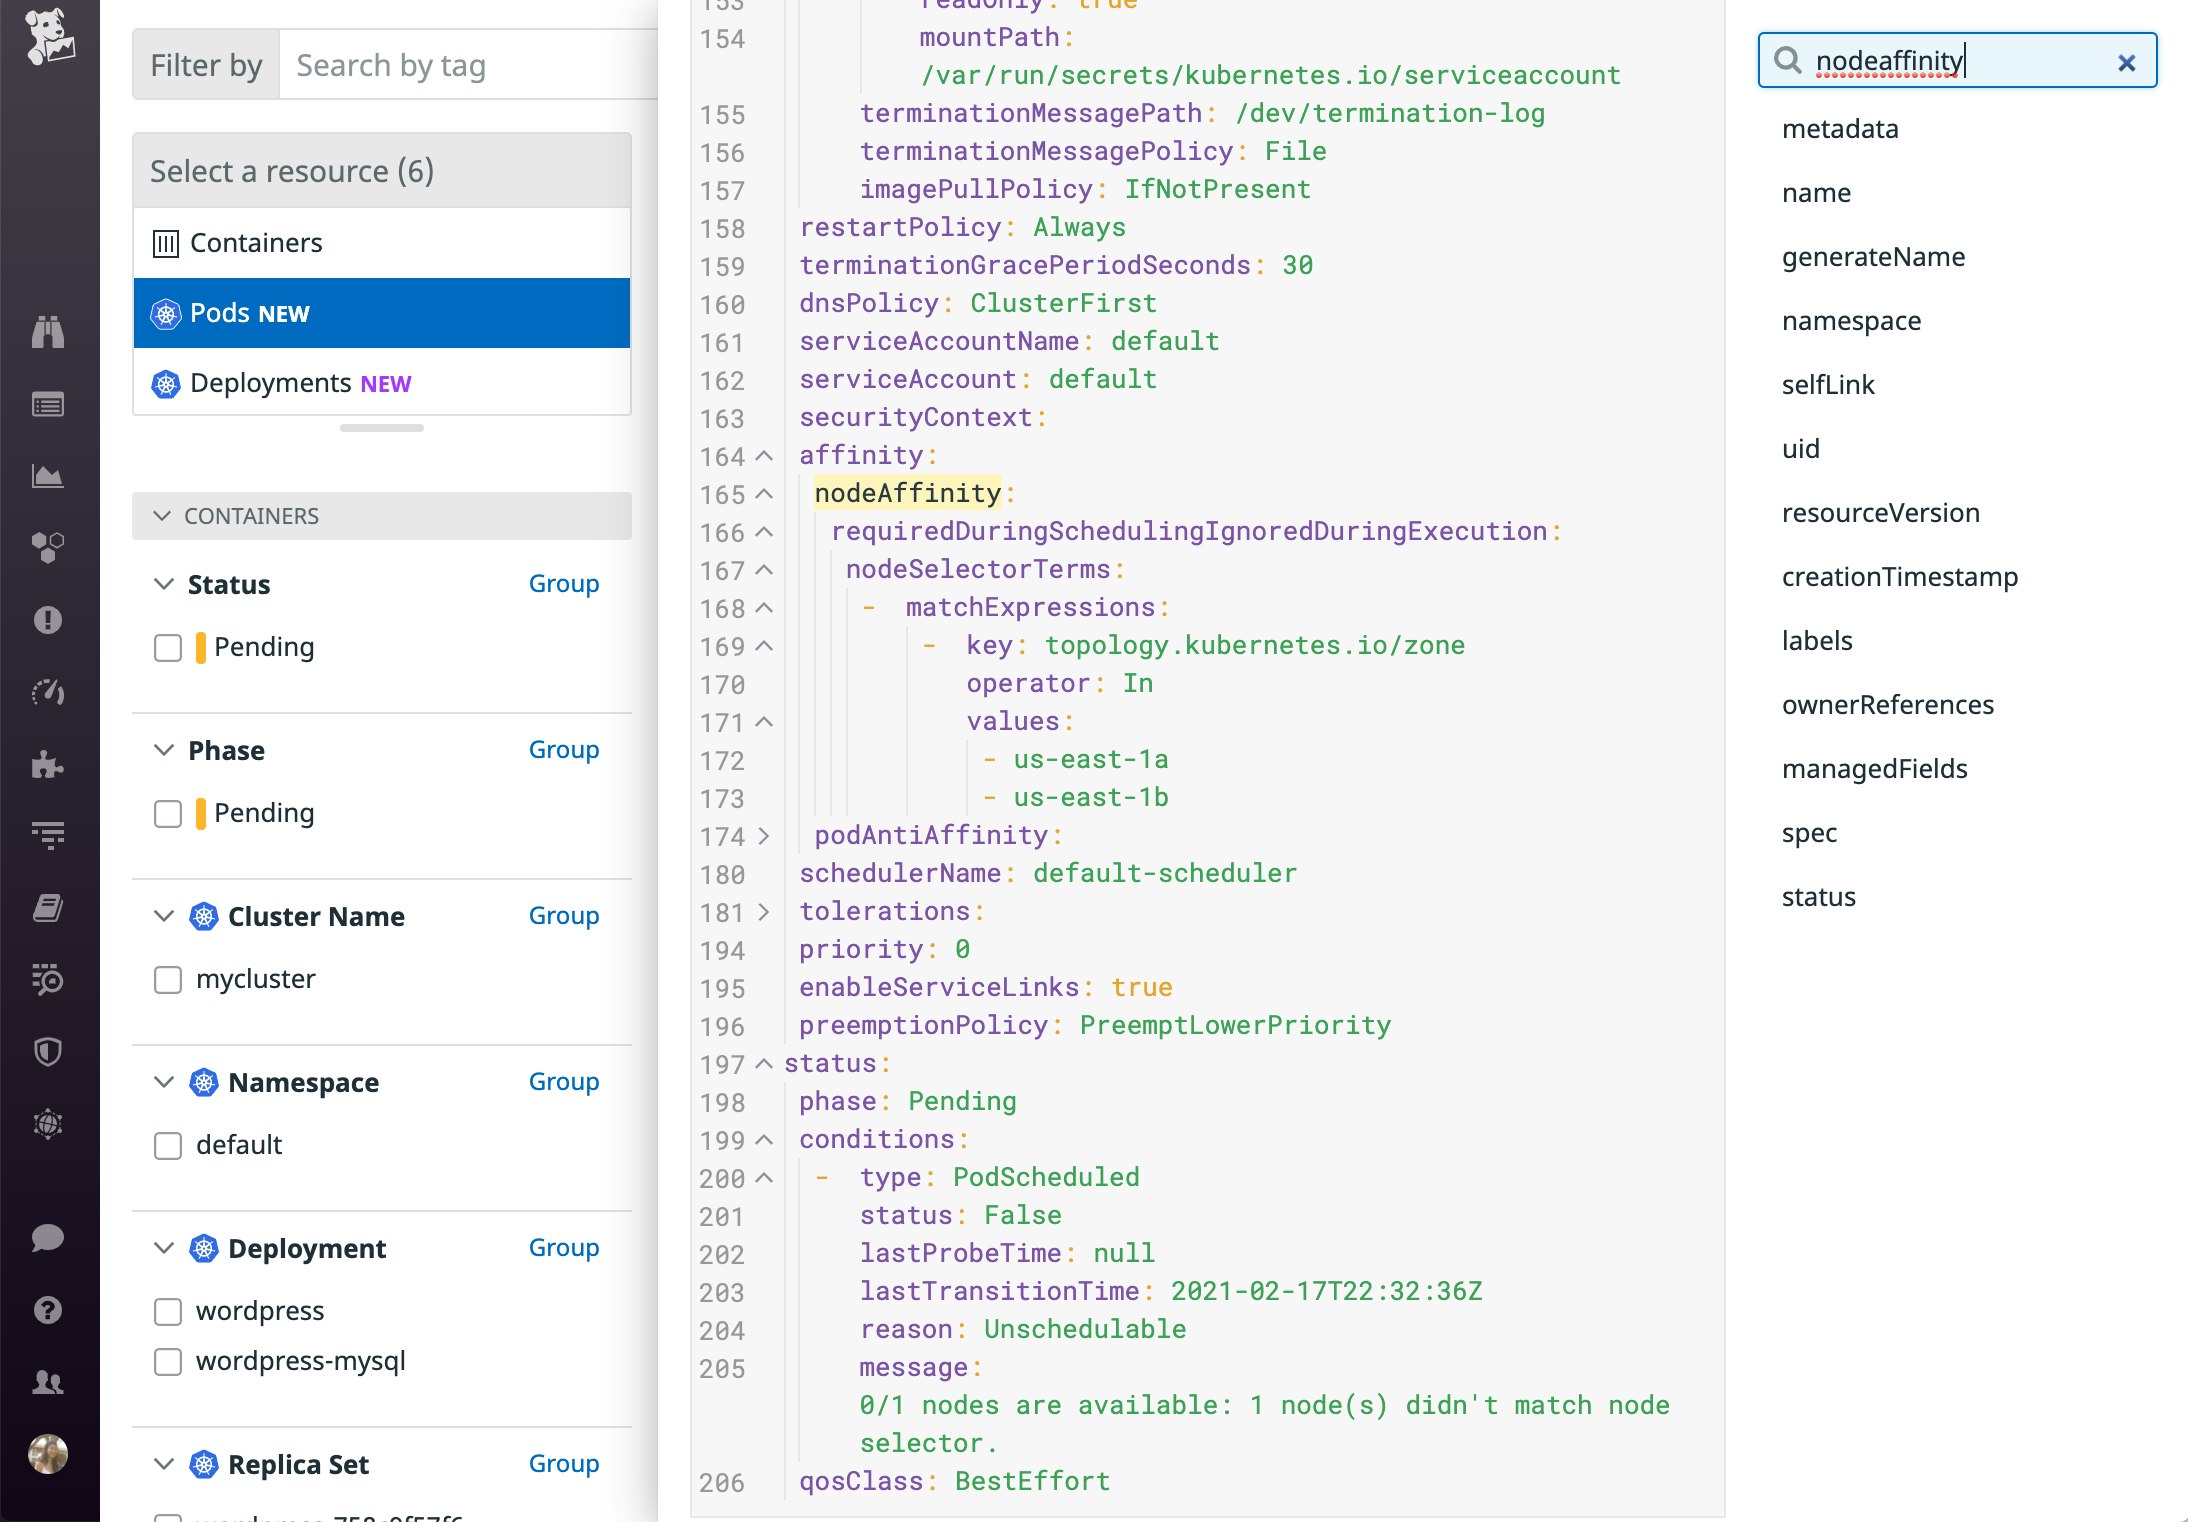
To reduce the likelihood of a node affinity or anti-affinity rule triggering a scheduling failure, you can use preferredDuringSchedulingIgnoredDuringExecution instead of requiredDuringSchedulingIgnoredDuringExecution to define a rule as preferred rather than required, if your use case supports it. For more details about node affinity and anti-affinity rules, consult the documentation. Note that if you use this setting, you are required to assign a weight for the preference so that the scheduler can use this information to prioritize which nodes should run the pod.
Kubernetes also allows you to define inter-pod affinity and anti-affinity rules, which are similar to node affinity and anti-affinity rules, except that they factor in the labels of pods that are running on each node, rather than node labels. We will explore inter-pod affinity and anti-affinity rules in a later section of this post.
Taints and tolerations
Kubernetes lets you add taints to nodes and tolerations to pods to influence scheduling decisions. Once you've added a taint to a node, that node will only be able to host pods that have compatible tolerations (i.e., pods that tolerate the node's taints). The scheduler looks at a pod's tolerations (if specified) and disqualifies any nodes that have conflicting taints when evaluating the PodToleratesNodeTaints predicate.
lf the scheduler cannot find a suitable node, you'll see a FailedScheduling event with details about the offending taint(s).
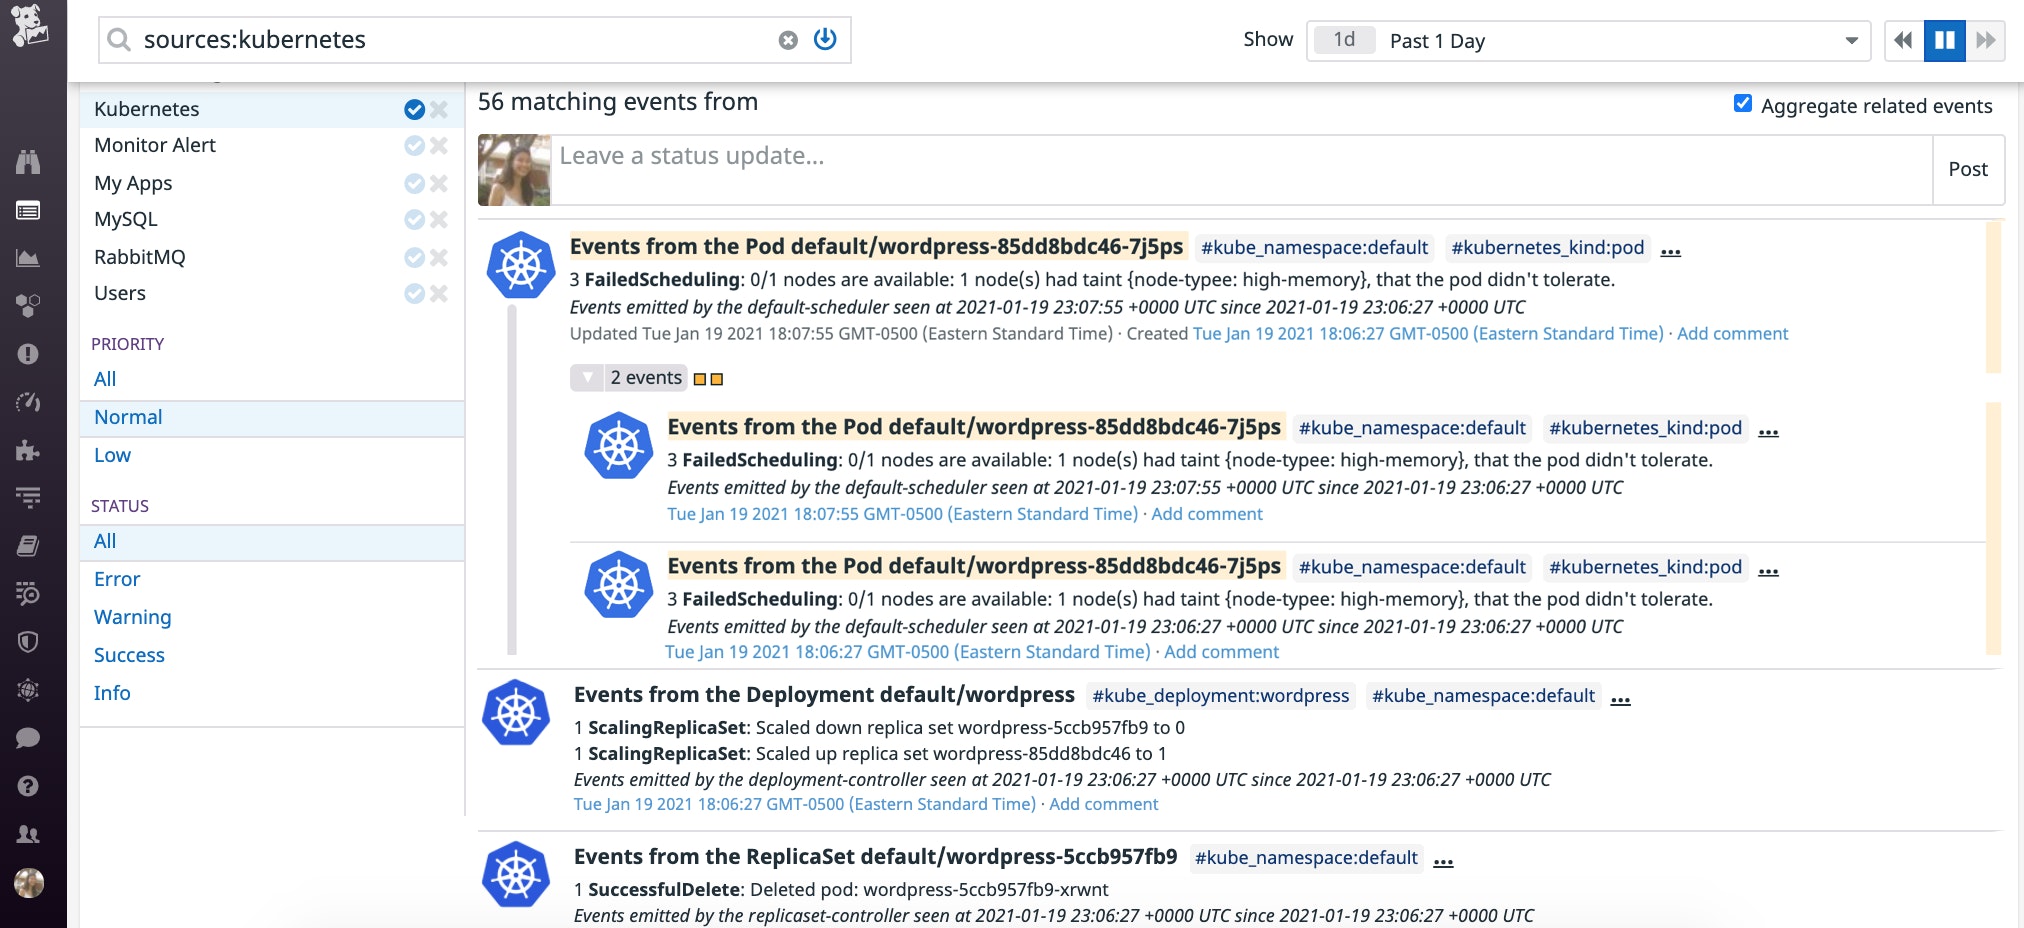
You can also investigate by running kubectl describe pod <PENDING_POD_NAME> and viewing the "Tolerations" and "Events" sections at the end of the output:
Tolerations: node-type=high-memory:NoSchedule node.kubernetes.io/not-ready:NoExecute for 300s node.kubernetes.io/unreachable:NoExecute for 300s
Events: Type Reason Age From Message ---- ------ ---- ---- ------- Warning FailedScheduling 77s (x3 over 79s) default-scheduler 0/1 nodes are available: 1 node(s) had taint {node-typee: high-memory}, that the pod didn't tolerate.In this case, due to a typo, the pod's toleration (node-type=high-memory) did not match the node's taint (node-typee: high-memory), so it could not be scheduled on that node. If you fix the typo in the taint so that it matches the toleration, Kubernetes should be able to schedule the Pending pod on the expected node.
It's also important to remember that a Pending pod will fail to get scheduled if it does not specify any tolerations and all nodes in the cluster are tainted. In this case, you'll need to add the appropriate toleration(s) to pods or add untainted nodes in order to avoid scheduling failures.
To prevent the likelihood of causing scheduling issues, when adding a taint to a node you may want to set the taint effect to PreferNoSchedule if your use case can tolerate it. This specifies that the scheduler should attempt to find a node that aligns with the pod's tolerations, but it can still schedule the pod on a node with a conflicting taint if needed. For more information about configuring taints and tolerations, consult the documentation.
Pods' requested resources exceed allocatable capacity
If a pod specifies resource requests—the minimum amount of CPU and/or memory it needs in order to run—the Kubernetes scheduler will attempt to find a node that can allocate resources to satisfy those requests. If it is unsuccessful, the pod will remain Pending until more resources become available.
Let's revisit an earlier example of the "Events" section of the kubectl describe output for a Pending pod:
Events: Type Reason Age From Message ---- ------ ---- ---- ------- Warning FailedScheduling 2m (x26 over 8m) default-scheduler 0/39 nodes are available: 1 node(s) were out of disk space, 38 Insufficient cpu.In this case, one node did not have enough disk space (returned True to the DiskPressure node condition check), while the other 38 nodes in the cluster did not have enough allocatable CPU to meet this pod's request (38 Insufficient cpu).
To schedule this pod, you could lower the pod's CPU request, free up CPU on nodes, address the disk space issue on the DiskPressure node, or add nodes that have enough resources to accommodate pods' requests.
It's also important to consider that the scheduler compares a pod's requests to each node's allocatable CPU and memory, rather than the total CPU and memory capacity. This accounts for any pods already running on the node, as well as any resources needed to run critical processes, such as Kubernetes itself. As such, if a pod requests 2 cores of CPU on a cluster that runs c5.large AWS instances (which have CPU capacity of 2 cores), the pod will never be able to get scheduled until you set a lower CPU request or move the cluster to an instance type with more CPU capacity. The Kubernetes documentation expands on this and other resource-related scheduling issues in more detail.
PersistentVolume-related scheduling failures
PersistentVolumes are designed to persist data beyond the lifecycle of any individual pod that needs to access them. In addition to requesting CPU and memory, a pod can request storage by including a PersistentVolumeClaim in its specification. A PersistentVolume controller is responsible for binding PersistentVolumes and PersistentVolumeClaims. When a pod's PersistentVolumeClaim cannot bind to a PersistentVolume or cannot access its PersistentVolume for some reason, the pod will not get scheduled.
Next, we'll explore a few examples of when issues with PersistentVolumes can lead to pod scheduling failures.
Pod's PersistentVolumeClaim is bound to a remote PersistentVolume in a different zone than its assigned node
A pod's PersistentVolumeClaim may include a storage class that outlines requirements, such as the volume's access mode. Kubernetes is able to use that information to dynamically provision a new PersistentVolume (e.g., an Amazon EBS volume) that satisfies the storage class requirements. Alternatively, it may find an available PersistentVolume that matches the storage class and bind it to the pod's PersistentVolumeClaim.
Because the PersistentVolume controller works independently of the scheduler, they could make conflicting decisions. For example, the PersistentVolume controller could bind the pod's PersistentVolumeClaim to a PersistentVolume in one zone, while the scheduler simultaneously assigns the pod to a node in a different zone. This would result in a FailedScheduling event that says node(s) had no available volume zone, indicating that one or more nodes failed to satisfy the NoVolumeZone predicate.
Let's take a look at another example involving the Cluster Autoscaler. If a Pending pod's PersistentVolumeClaim is bound to a PersistentVolume, the pod may remain Pending if the autoscaler is unable to add a node in the same zone as the pod's PersistentVolume (e.g., because it has already reached its configured max-nodes-total, or maximum number of nodes across all node groups), and no other nodes in that zone are available to host it. If this occurs, you may see a log similar to the one shown below, accompanied by a NotTriggerScaleUp event.
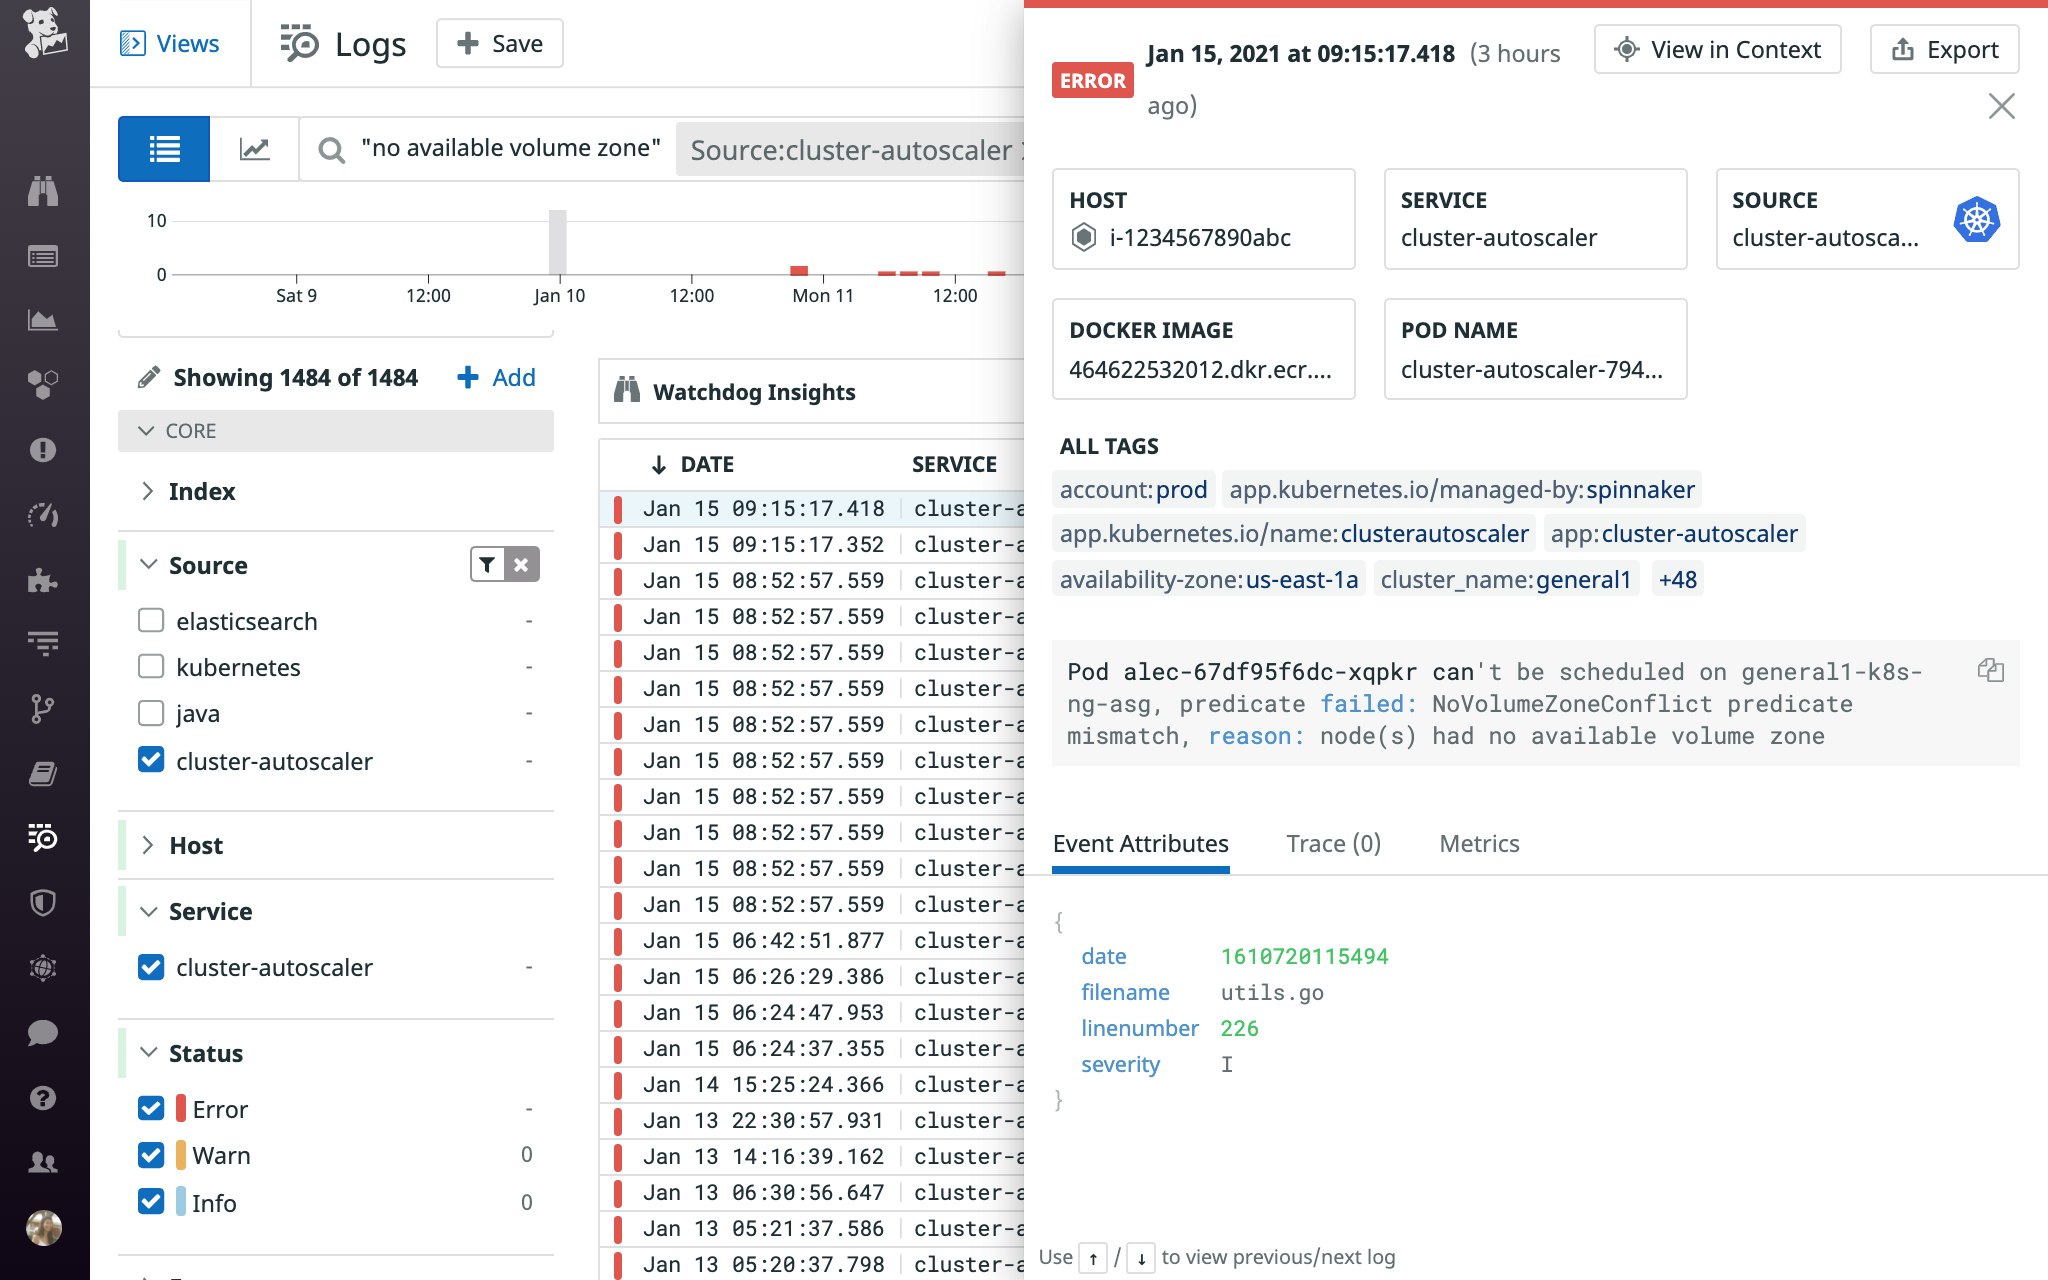
If your cluster is distributed across multiple zones, the Kubernetes documentation recommends specifying WaitForFirstConsumer in the storage class's volume binding mode. This way, the PersistentVolume controller will wait for the scheduler to select a node that meets the pod's scheduling requirements before creating a compatible PersistentVolume (i.e., in the selected node's zone) and binding it to a pod's PersistentVolumeClaim. And if you're using this setting in conjunction with the Cluster Autoscaler, the documentation recommends creating a separate node group for each zone so that the newly provisioned node will be located in the right zone. When the Cluster Autoscaler provisions a node for a multi-zone node group, it cannot specify which zone the node should end up in—the cloud provider makes that decision, so the new node may end up in a zone other than the Pending pod's associated PersistentVolume.
Because WaitForFirstConsumer only applies to newly provisioned PersistentVolumes, a scheduling failure can still arise when a pod's PersistentVolumeClaim is already bound to a PersistentVolume in one zone, but the scheduler assigns it to a node in another zone.
Consider, for instance, the following scenario:
- Pod A, part of a StatefulSet, runs in zone 0.
- The PersistentVolume controller binds pod A's PersistentVolumeClaim to a PersistentVolume in zone 0.
- In the next rollout of the StatefulSet, Pod A's specification is modified to include a node affinity rule that requires it to get scheduled in zone 1. However, its PersistentVolumeClaim is still bound to the PersistentVolume in zone 0.
- Pod A cannot be scheduled because its PersistentVolumeClaim is still referencing a PersistentVolume in a zone that conflicts with the affinity rule.
In this case, you should delete the pod's PersistentVolumeClaim and then delete the pod. Note that you must complete both steps in this order—if you delete the pod without deleting the PersistentVolumeClaim, the controller will recreate the pod, but the PersistentVolumeClaim will continue to reference a PersistentVolume in a different zone than the pod's newly assigned node. Once you delete both, the StatefulSet controller will recreate the pod and PersistentVolumeClaim, and this should allow the pod to get scheduled again.
Pod's PersistentVolumeClaim is bound to an unavailable local volume
Pods can access their nodes' local storage by using Local Persistent Volumes. Local storage provides performance benefits over remote storage options, but it can also lead to scheduling issues. When a node is removed (i.e., drained), or becomes unavailable for any reason, its pods need to get rescheduled. However, if a pod's PersistentVolumeClaim is still bound to local storage on the unavailable node, it will remain Pending and emit a FailedScheduling event similar to this: Warning FailedScheduling 11s (x7 over 42s) default-scheduler [...] 1 node(s) didn't find available persistent volumes to bind, [...].
To get the pod running again, you need to delete the Local Persistent Volume and the PersistentVolumeClaim, and then delete the pod. This should allow the pod to get rescheduled.
Pod's PersistentVolumeClaim's request exceeds capacity of local storage
The local volume static provisioner manages Local Persistent Volumes created for local storage. If your pod's PersistentVolumeClaim specifies a request that exceeds the capacity of local storage, the pod will remain Pending.
To see if a pod is Pending due to this reason, you can check the capacity of a local volume on a node that's expected to host this pod:
$ kubectl get pv -lkubernetes.io/hostname=<HOSTNAME> -ojson | jq -r '.items[].spec.capacity'
{ "storage": "137Gi" }Then compare it to the amount of storage requested in the PersistentVolumeClaim:
$ kubectl get pvc <PVC_NAME> -ojson | jq -r '.spec.resources'
{ "requests": { "storage": "300Gi" }}In this case, the PersistentVolumeClaim's request (300Gi) exceeds the capacity of the Local Persistent Volume (137Gi) created based on the disk capacity of the node, so the pod's PersistentVolumeClaim can never be fulfilled. To address this, you'll need to reduce the PersistentVolumeClaim request so it is less than or equal to the capacity of the partitions/disks on nodes, or upgrade nodes to an instance type that has enough capacity to fulfill the PersistentVolumeClaim's request.
The Kubernetes community has added an enhancement that should address this issue by factoring nodes' storage capacity into pod scheduling decisions.
Inter-pod affinity and anti-affinity rules
Inter-pod affinity and anti-affinity rules define where pods can (and cannot) get scheduled based on other pods that are already running on nodes. Because this is a more intensive calculation for the scheduler, it is the last predicate the scheduler will check. These rules complement node affinity/anti-affinity rules and allow you to further shape scheduling decisions to suit your use case. In certain situations, however, these rules can cause scheduling failures.
An inter-pod affinity rule specifies when certain pods can get scheduled on the same node (or other topological group)—in other words, that these pods have an affinity for one another. This can be useful, for instance, if you would like an application pod to run on a node that is running a cache that the application depends on.
If you add the following inter-pod affinity rule to the web application pod's specification, Kubernetes can only schedule the pod on a node (specified using the built-in hostname node label in the topologyKey) that is running a pod with an app: memcached label:
affinity: podAffinity: requiredDuringSchedulingIgnoredDuringExecution: - labelSelector: matchExpressions: - key: app operator: In values: - memcached topologyKey: kubernetes.io/hostnameTo schedule this type of pod, you need to ensure that a node is already running a cache pod (with the label app: memcached), in addition to satisfying other scheduling predicates. Otherwise, it will remain Pending.
On the other hand, an inter-pod anti-affinity rule declares which pods cannot run on the same node. For instance, you may want to use an anti-affinity rule to distribute Kafka pods (pods with the app: kafka label) across nodes for high availability:
affinity: podAntiAffinity: requiredDuringSchedulingIgnoredDuringExecution: - labelSelector: matchExpressions: - key: app operator: In values: - kafka topologyKey: kubernetes.io/hostnameYou can query a pod's affinity or anti-affinity specification at any time, as shown in the following command (make sure to replace podAntiAffinity with podAffinity if you'd like to query affinity instead):
$ kubectl get pod <PENDING_POD_NAME> -ojson | jq '.spec.affinity.podAntiAffinity'
{ "requiredDuringSchedulingIgnoredDuringExecution": [ { "labelSelector": { "matchExpressions": [ { "key": "app", "operator": "In", "values": [ "kafka" ] } ] }, "topologyKey": "kubernetes.io/hostname" } ]}In this case, we are using the topologyKey to ensure that application pods are not colocated on the same node. Therefore, if the number of available nodes is less than the number of pods that are labeled with app: kafka, any pods with that label will not be able to get scheduled until enough nodes are available to host them.
Similar to soft and hard requirements for node taints and node affinity/anti-affinity rules, you can use preferredDuringSchedulingIgnoredDuringExecution instead of requiredDuringSchedulingIgnoredDuringExecution in an inter-pod affinity or anti-affinity rule if you want to prevent it from blocking a pod from getting scheduled. If you use preferredDuringSchedulingIgnoredDuringExecution, the scheduler will attempt to follow this request based on the weight you assign it, but can still ignore it if that is the only way to schedule the pod. You can learn about this configuration, along with other use cases for inter-pod affinity and anti-affinity rules, in the documentation.
Rolling update deployment settings
So far, we've covered a few predicates that can lead Pending pods to fail to get scheduled. Next, we will explore how Pending pods can encounter scheduling issues during a rolling update.
In this type of deployment strategy, Kubernetes attempts to progressively update pods to reduce the likelihood of degrading the availability of the workload. To do so, it gradually scales down the number of outdated pods and scales up the number of updated pods according to your rolling update strategy configuration. The following rolling update strategy parameters restrict the number of pods that can be initialized or unavailable during a rolling update:
maxSurge: the maximum number of pods that can be running during a rolling updatemaxUnavailable: the maximum number of pods that can be unavailable during a rolling update
maxSurge prevents too many pods from starting at once to reduce the risk of overloading your nodes, while maxUnavailable helps ensure a minimal level of pod availability for the Deployment you are updating. You can specify these fields as a percentage or integer. If you use a percentage, it is calculated as a percentage of desired pods and then rounded up (for maxSurge) or down (for maxUnavailable) to the nearest whole number. By default, maxSurge and maxUnavailable are set to 25 percent.
Let's take a look at a few scenarios where a rolling update could get stalled and how these settings factor into the overall picture. The first problem arises when the number of desired pods is less than four and the default values for maxUnavailable and maxSurge are in effect.
If you want to update a Deployment with three desired pods, the maximum number of pods that can be unavailable at all times is 0 (25 percent * 3 nodes = 0.75, which rounds down to 0). This essentially prevents the rolling update from making any progress—pods from the old Deployment cannot be terminated because that would violate the maxUnavailable requirement. To unblock this, you need to revise maxUnavailable to be an absolute value above 0 instead of a percentage.
The second problem arises when the maxUnavailable threshold is reached. Even if you've set maxUnavailable to an absolute value above 0, your rolling update may need to pause as it hits that threshold. In many cases, this is just a temporary halt in the rollout (i.e., until unavailable pods can get rescheduled). However, if the update remains stalled for an unusually long period of time, you may need to troubleshoot.
To get more details, you can kubectl describe the Deployment, which is being used to roll out a new ReplicaSet in this example. You will see a list of desired, updated, total, available, and unavailable pods, as well as the rolling update strategy settings.
$ kubectl describe deployment webapp
...Replicas: 15 desired | 11 updated | 19 total | 9 available | 10 unavailableRollingUpdateStrategy: 25% max unavailable, 25% max surge...Conditions: Type Status Reason ---- ------ ------ Available False MinimumReplicasUnavailable Progressing False ProgressDeadlineExceededOldReplicaSets: webapp-55cf4f7769 (8/8 replicas created)NewReplicaSet: webapp-5684bccc75 (11/11 replicas created)In this case, one or more nodes may have become unavailable during the rolling update, causing the associated pods to transition to Pending. Because Pending pods contribute to the unavailable pod count, they may have caused this Deployment to hit the maxUnavailable threshold, which stopped the update.
A few other scenarios may also have led to an increase in unavailable pods. For instance:
- Someone could have triggered a voluntary disruption—an action that caused those pods to restart or fail (e.g., deleting a pod or draining a node).
- The pods were evicted. When a node is facing resource constraints, the kubelet starts evicting pods, first those that are using more than their requested resources, and then in order of priority.
Regardless of what caused those pods to become unavailable, you can get the rolling update to resume by adding more nodes to host Pending pods, manually scaling down the old ReplicaSet, or reducing the desired replica count.
Auto-detect Kubernetes scheduling issues
Pending pods are completely normal in Kubernetes clusters, but as covered in this post, they can sometimes lead to scheduling failures that require intervention. At the same time, the "normal" number of Pending pods—and how long it typically takes to schedule them—will vary based on your environment, making it challenging to configure one-size-fits-all alerts.
For example, if you're using the Cluster Autoscaler, it may need to provision a new node to host a Pending pod—and when doing so, it will factor in the scheduling predicates for the pod, which could add a few minutes to the time the pod remains Pending. If all goes well, after the node joins the cluster, the default scheduler will schedule the pod on it. This means that pods could remain Pending for upwards of five minutes without necessarily indicating a problem. To reduce noise while still getting visibility into critical issues, you'll need to determine what's normal—and what's not—by observing your cluster and events from your pods. The Cluster Autoscaler also emits events to help you understand when it was able—or unable—to help schedule a pod. For example, the Cluster Autoscaler creates a NotTriggerScaleUp event on a pod whenever it is not able to add a node that would allow that pod to get scheduled.
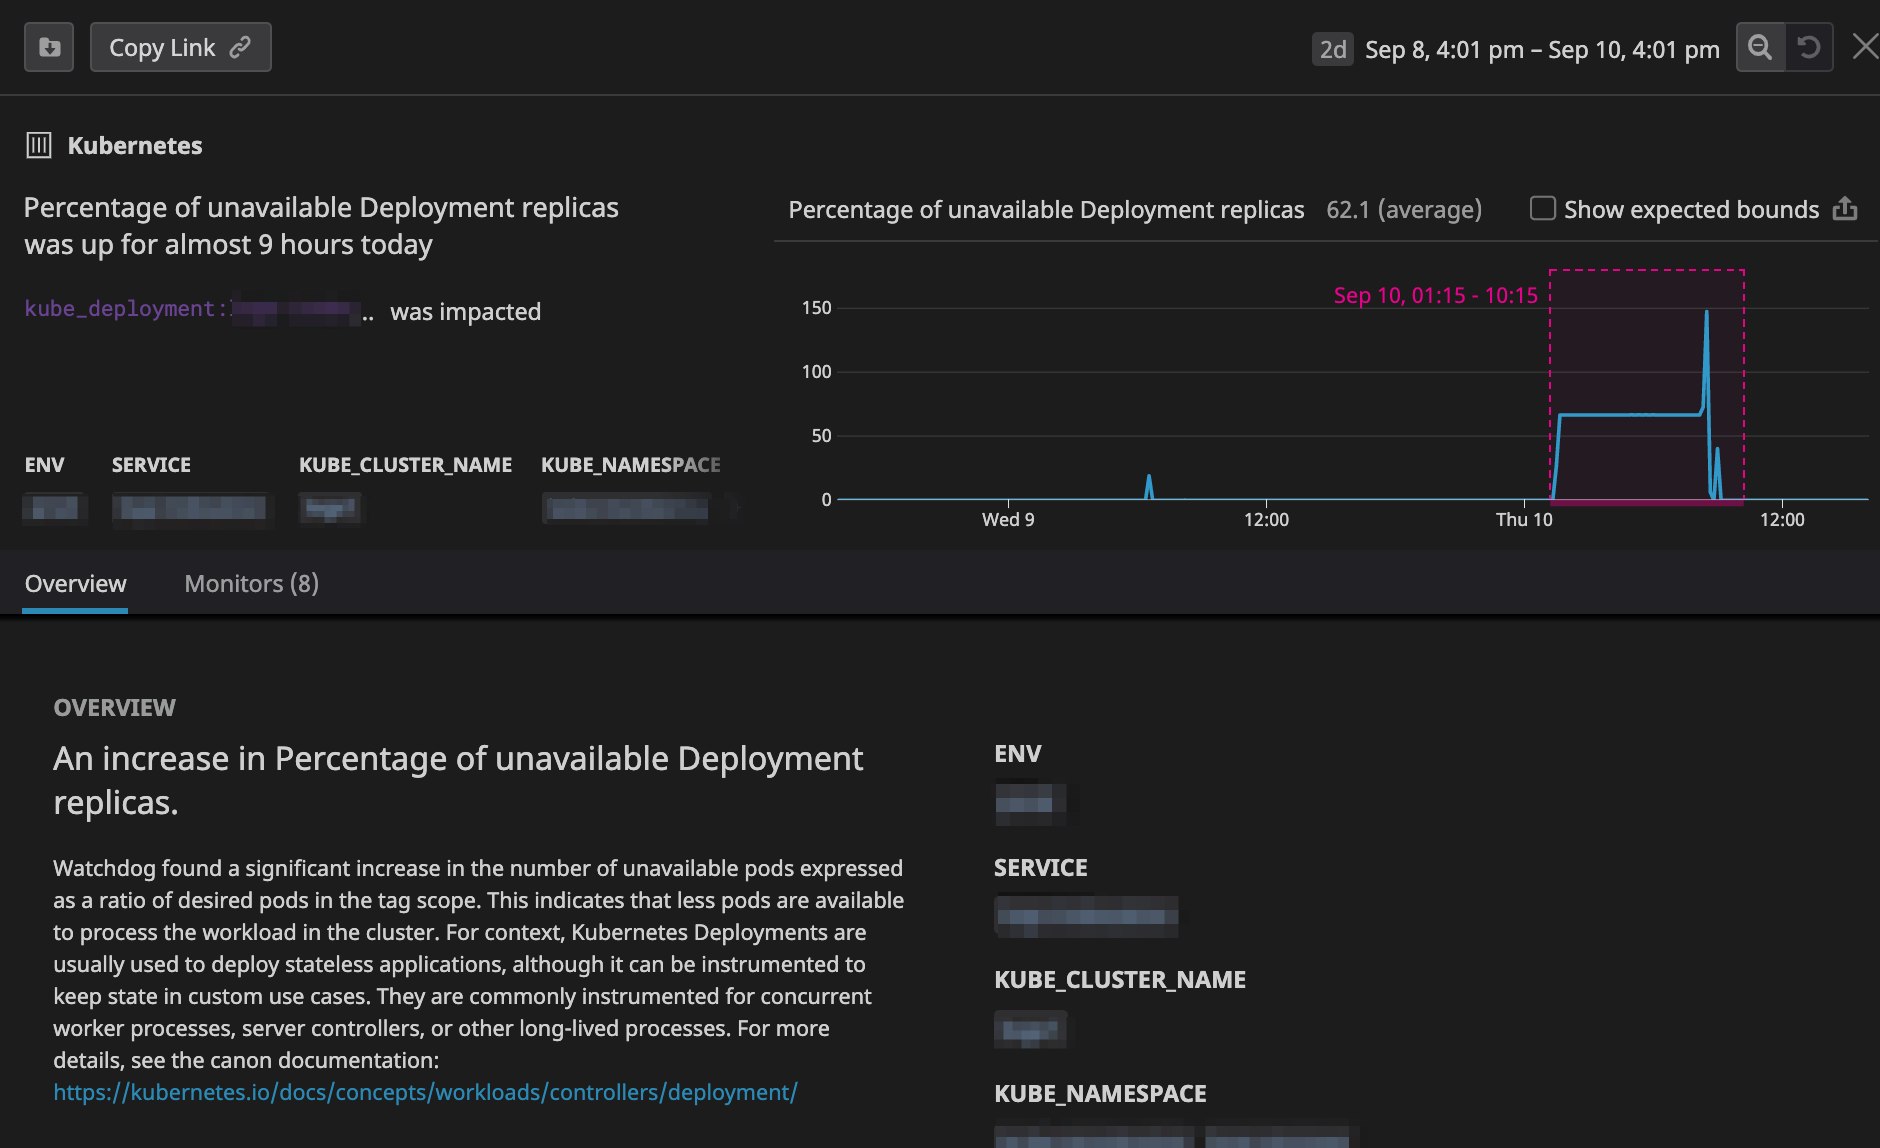
If you're using Datadog to monitor Kubernetes, Watchdog automatically analyzes data from your clusters and generates a story whenever it detects an abnormality, such as an unusual number of Pending pods.
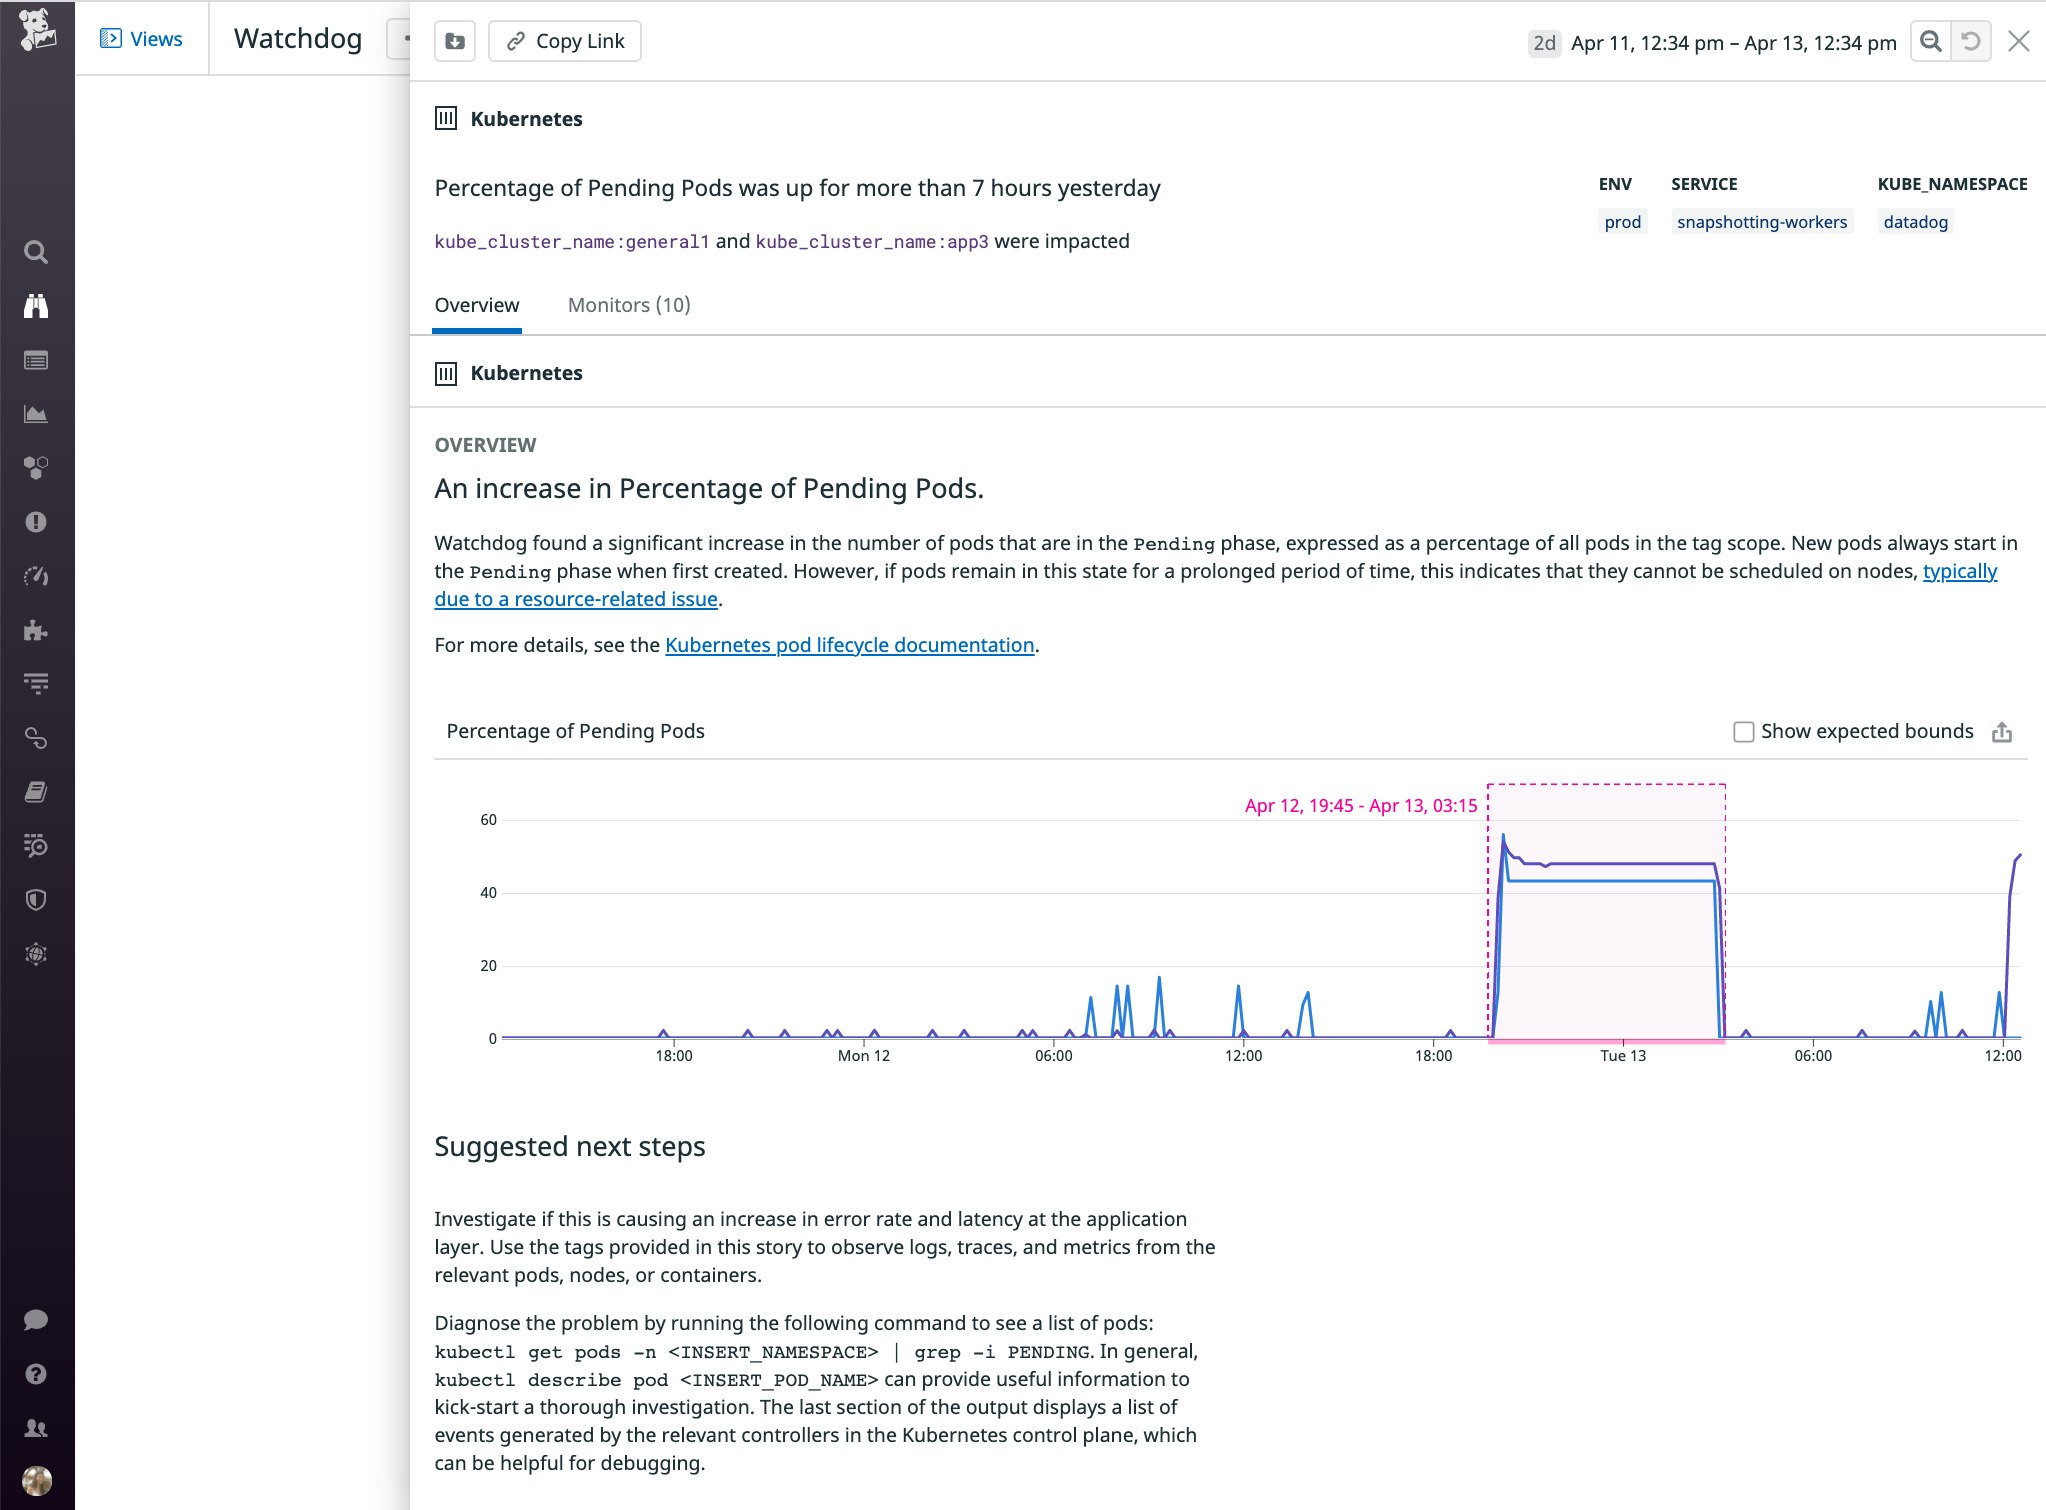
Watchdog will also generate a story if it detects a significant increase in the percentage of unavailable replicas in a Deployment. As shown below, it reports relevant information about the scope of the issue, including the affected environment, service, cluster, and namespace . This provides visibility into additional scenarios where pods fail to run (e.g., not just Pending pods, but also pods with a status such as Unknown), so you can get a more holistic view of issues that prevent your workloads from running smoothly.
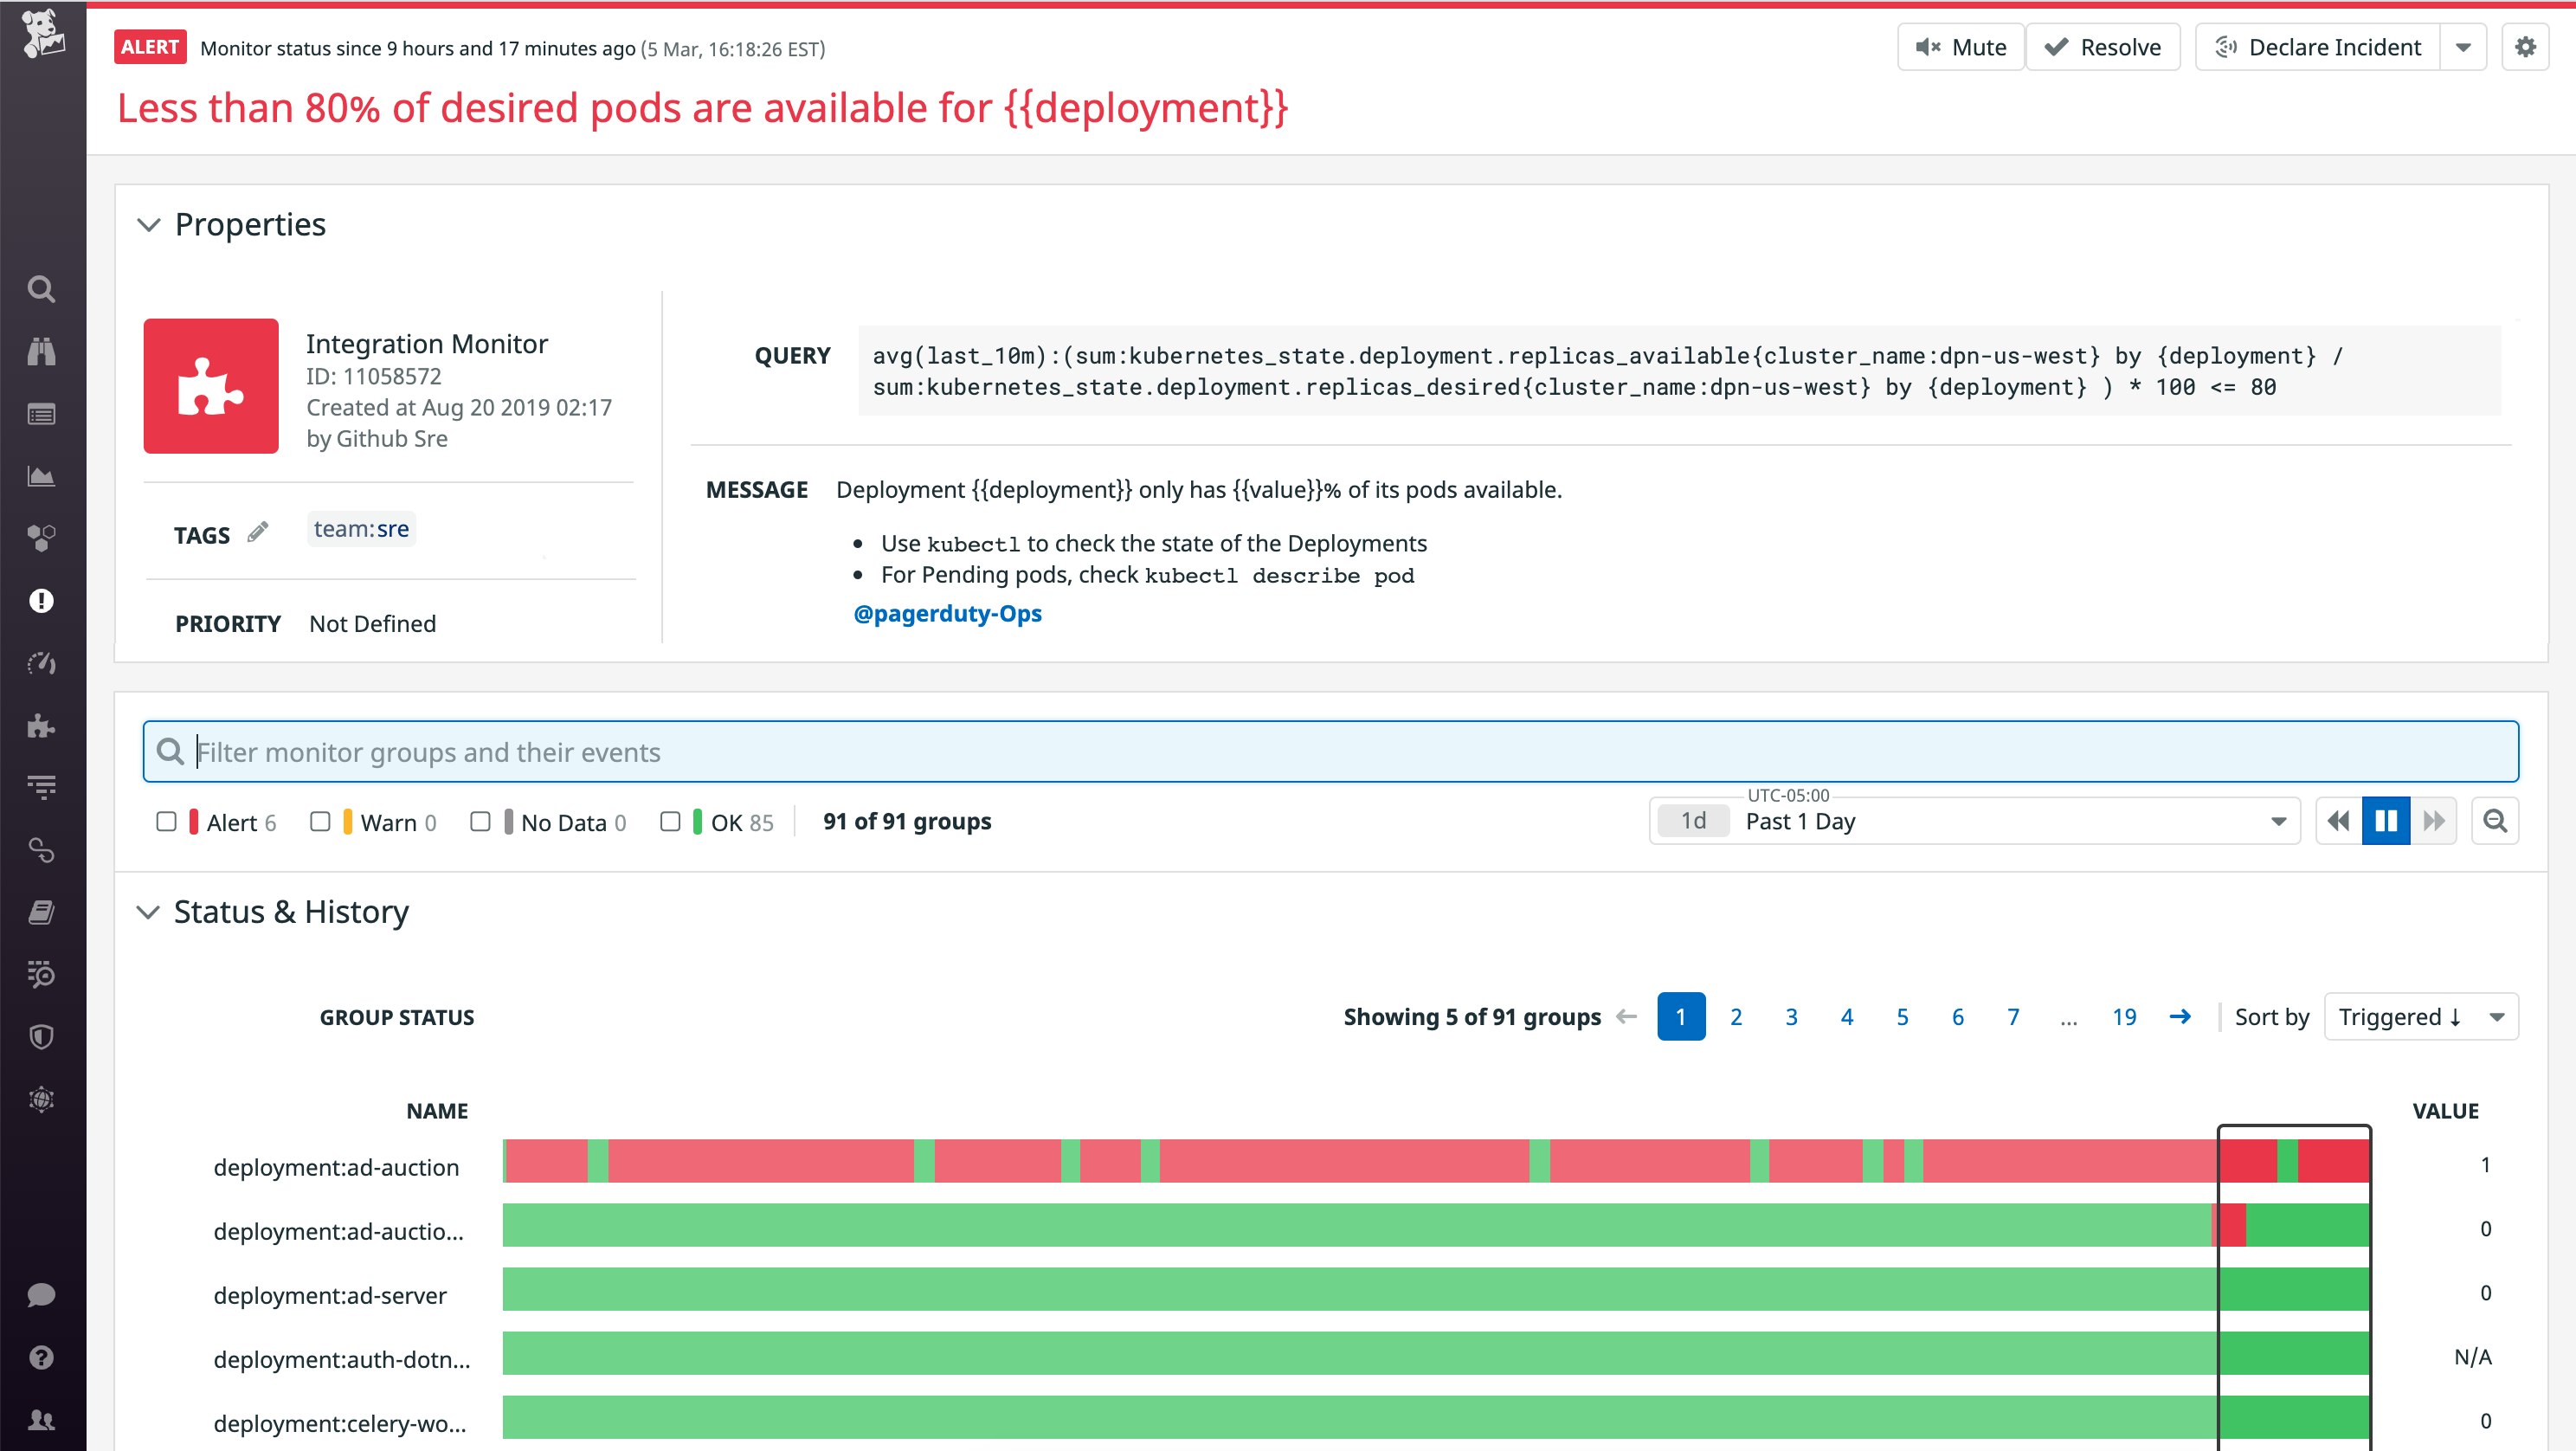
You can also supplement Watchdog's auto-detection capabilities by setting up automated alerts to detect issues in your workloads. In the example below, we set up an alert to trigger a PagerDuty notification when less than 80 percent of pod replicas in a Deployment have been running over the past 10 minutes.
You may need to adjust the threshold for smaller workloads. For example, in a Deployment with only three pods, an 80 percent threshold would trigger a notification every time a single pod became unavailable, making this alert overly noisy. In general, your alerts should tolerate the loss of a single pod in a workload without triggering a notification. Temporary failures are to be expected in the cloud—for example, cloud providers will periodically need to replace hardware for maintenance reasons—so you will want to plan for these disruptions when designing a high availability setup.
You may also want to set up an alert that notifies you when the number of Pending pods in a service is not respecting the rolling update settings you've configured. For example, if you've defined a maxSurge of 1 in your rolling update strategy, Kubernetes should only launch one new pod at a time before proceeding with the rest of the update. If you get notified that you have more than one Pending pod in that Deployment or ReplicaSet, you'll know that it's not respecting the rolling update strategy (e.g., because nodes or pods became unavailable for some reason during the rollout).
Start troubleshooting Kubernetes Pending pods
In this post, we've walked through several reasons why the Kubernetes scheduler may encounter issues with placing Pending pods. Although the Kubernetes scheduler attempts to find the best node to host a pod, things are constantly in flux, making it hard to future-proof every scheduling decision. The descheduler is a Kubernetes Special Interest Group that is working to address scheduling-related issues, including the ones covered in this post. If you are implementing a static or manual scaling strategy, the descheduler could help improve scheduling decisions in your clusters. It is currently not compatible with the Cluster Autoscaler, but future support is on the roadmap.
To learn more about monitoring Kubernetes with Datadog, check out our documentation. Or, if you're not yet using Datadog to monitor your Kubernetes clusters, sign up for a free trial to get started.


