Angelina Jin

Ken Schneider

Kyler Kang

Zoe Tiet
Modern enterprises rely on software-defined wide area networks (SD-WANs) to connect branch offices, data centers, and cloud environments. While this flexibility improves resiliency and performance, it also increases operational complexity. When users report slow applications or intermittent connections, teams need to determine whether the issue originates from an unhealthy WAN edge, a tunnel or path that isn’t meeting service level agreement (SLA) targets, or congestion caused by specific applications.
Datadog’s Versa SD-WAN integration provides visibility into Versa-managed environments by collecting key device health, SLA, interface, and traffic metrics from appliances and bringing them into Datadog alongside your infrastructure and application data. With this unified view, network and infrastructure teams can quickly validate that traffic is flowing over expected paths, identify degraded links, and understand how application and user traffic impact performance across sites.
In this post, we’ll cover how the Versa integration helps engineering teams:
- Monitor WAN edge and controller health across sites
- Track link, tunnel, and path SLA metrics
- Analyze interface utilization and congestion
- Understand application, user, and Quality of Service (QoS) traffic patterns
Monitor WAN edge and controller health
Reliable connectivity in distributed environments starts with healthy appliances and controllers. A single unhealthy device or overloaded edge can create a cascading impact and affect application performance across many sites. When users report instability, teams need to find the bottleneck as quickly as possible to define a remediation plan.
The Versa integration collects device health metrics for Versa SD-WAN edges and controllers, including availability, CPU utilization, memory usage, disk utilization, and uptime. These metrics help teams quickly identify overloaded or unhealthy devices that may be impacting traffic forwarding or SLA compliance.
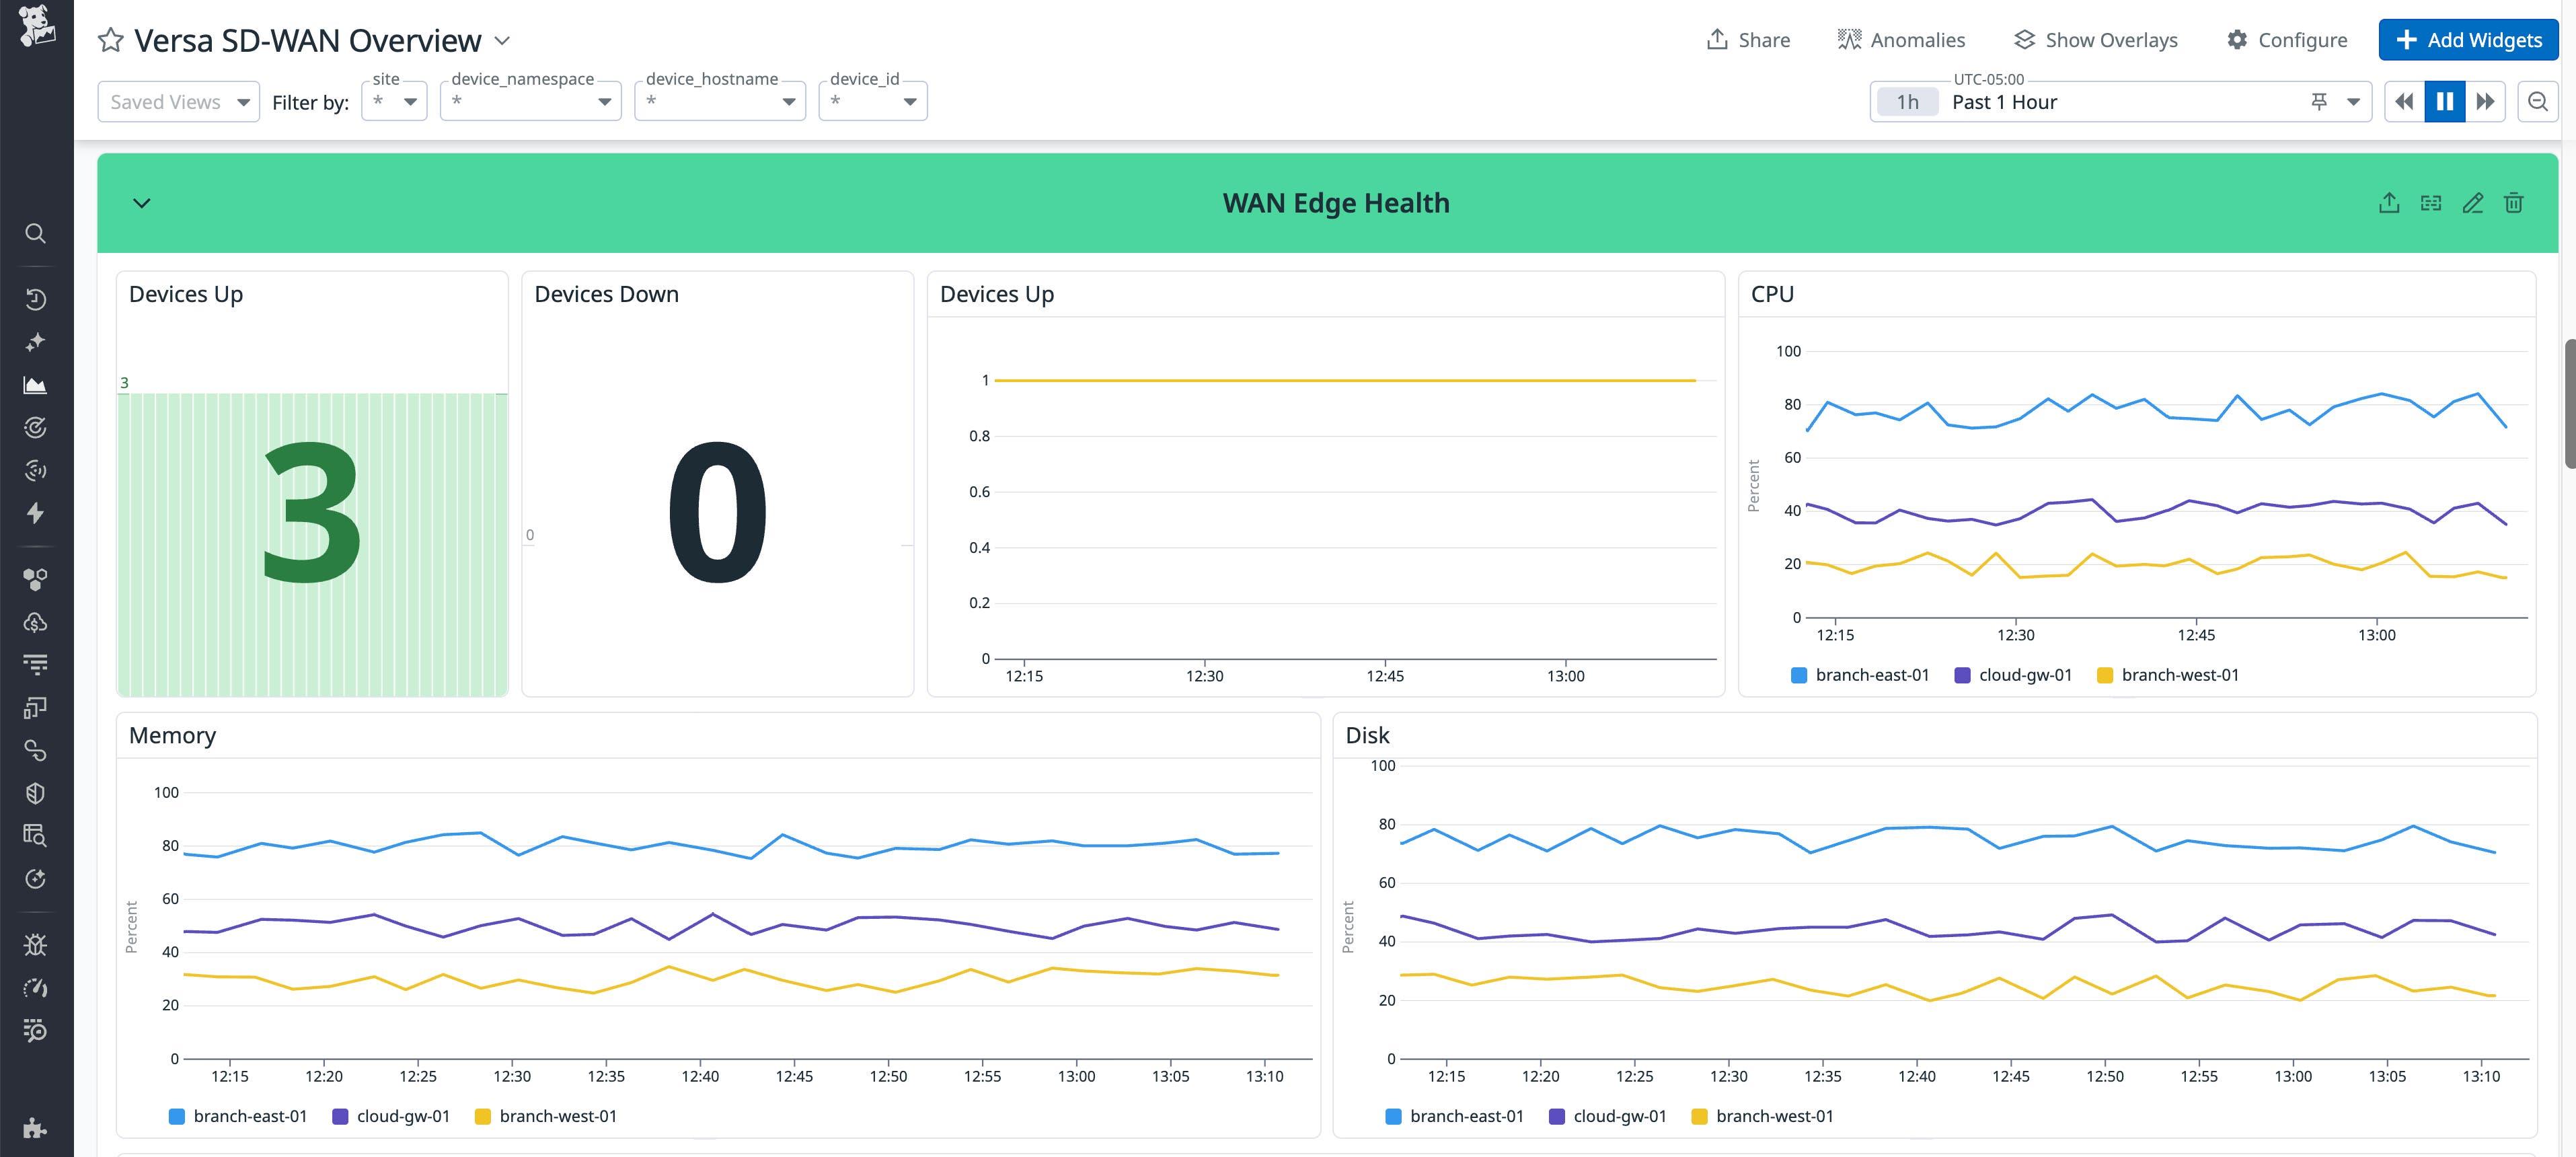
By visualizing these metrics in Datadog and setting monitors on device availability or sustained resource saturation, teams can detect instability early. They can then address issues before they escalate into site outages or widespread performance degradation.
Track link, tunnel, and path SLA metrics
A core capability of SD-WAN is steering traffic based on SLAs. To make sure those targets are being met, teams need clear, continuous visibility into tunnel performance and traffic paths.
The Datadog Versa integration ingests the necessary metrics for teams to ensure adherence to SLAs, including delay, jitter, loss ratio, and errors for links, tunnels, and paths. These metrics are tagged by local and remote sites, making it easier to pinpoint where degradation is occurring and which locations are affected.
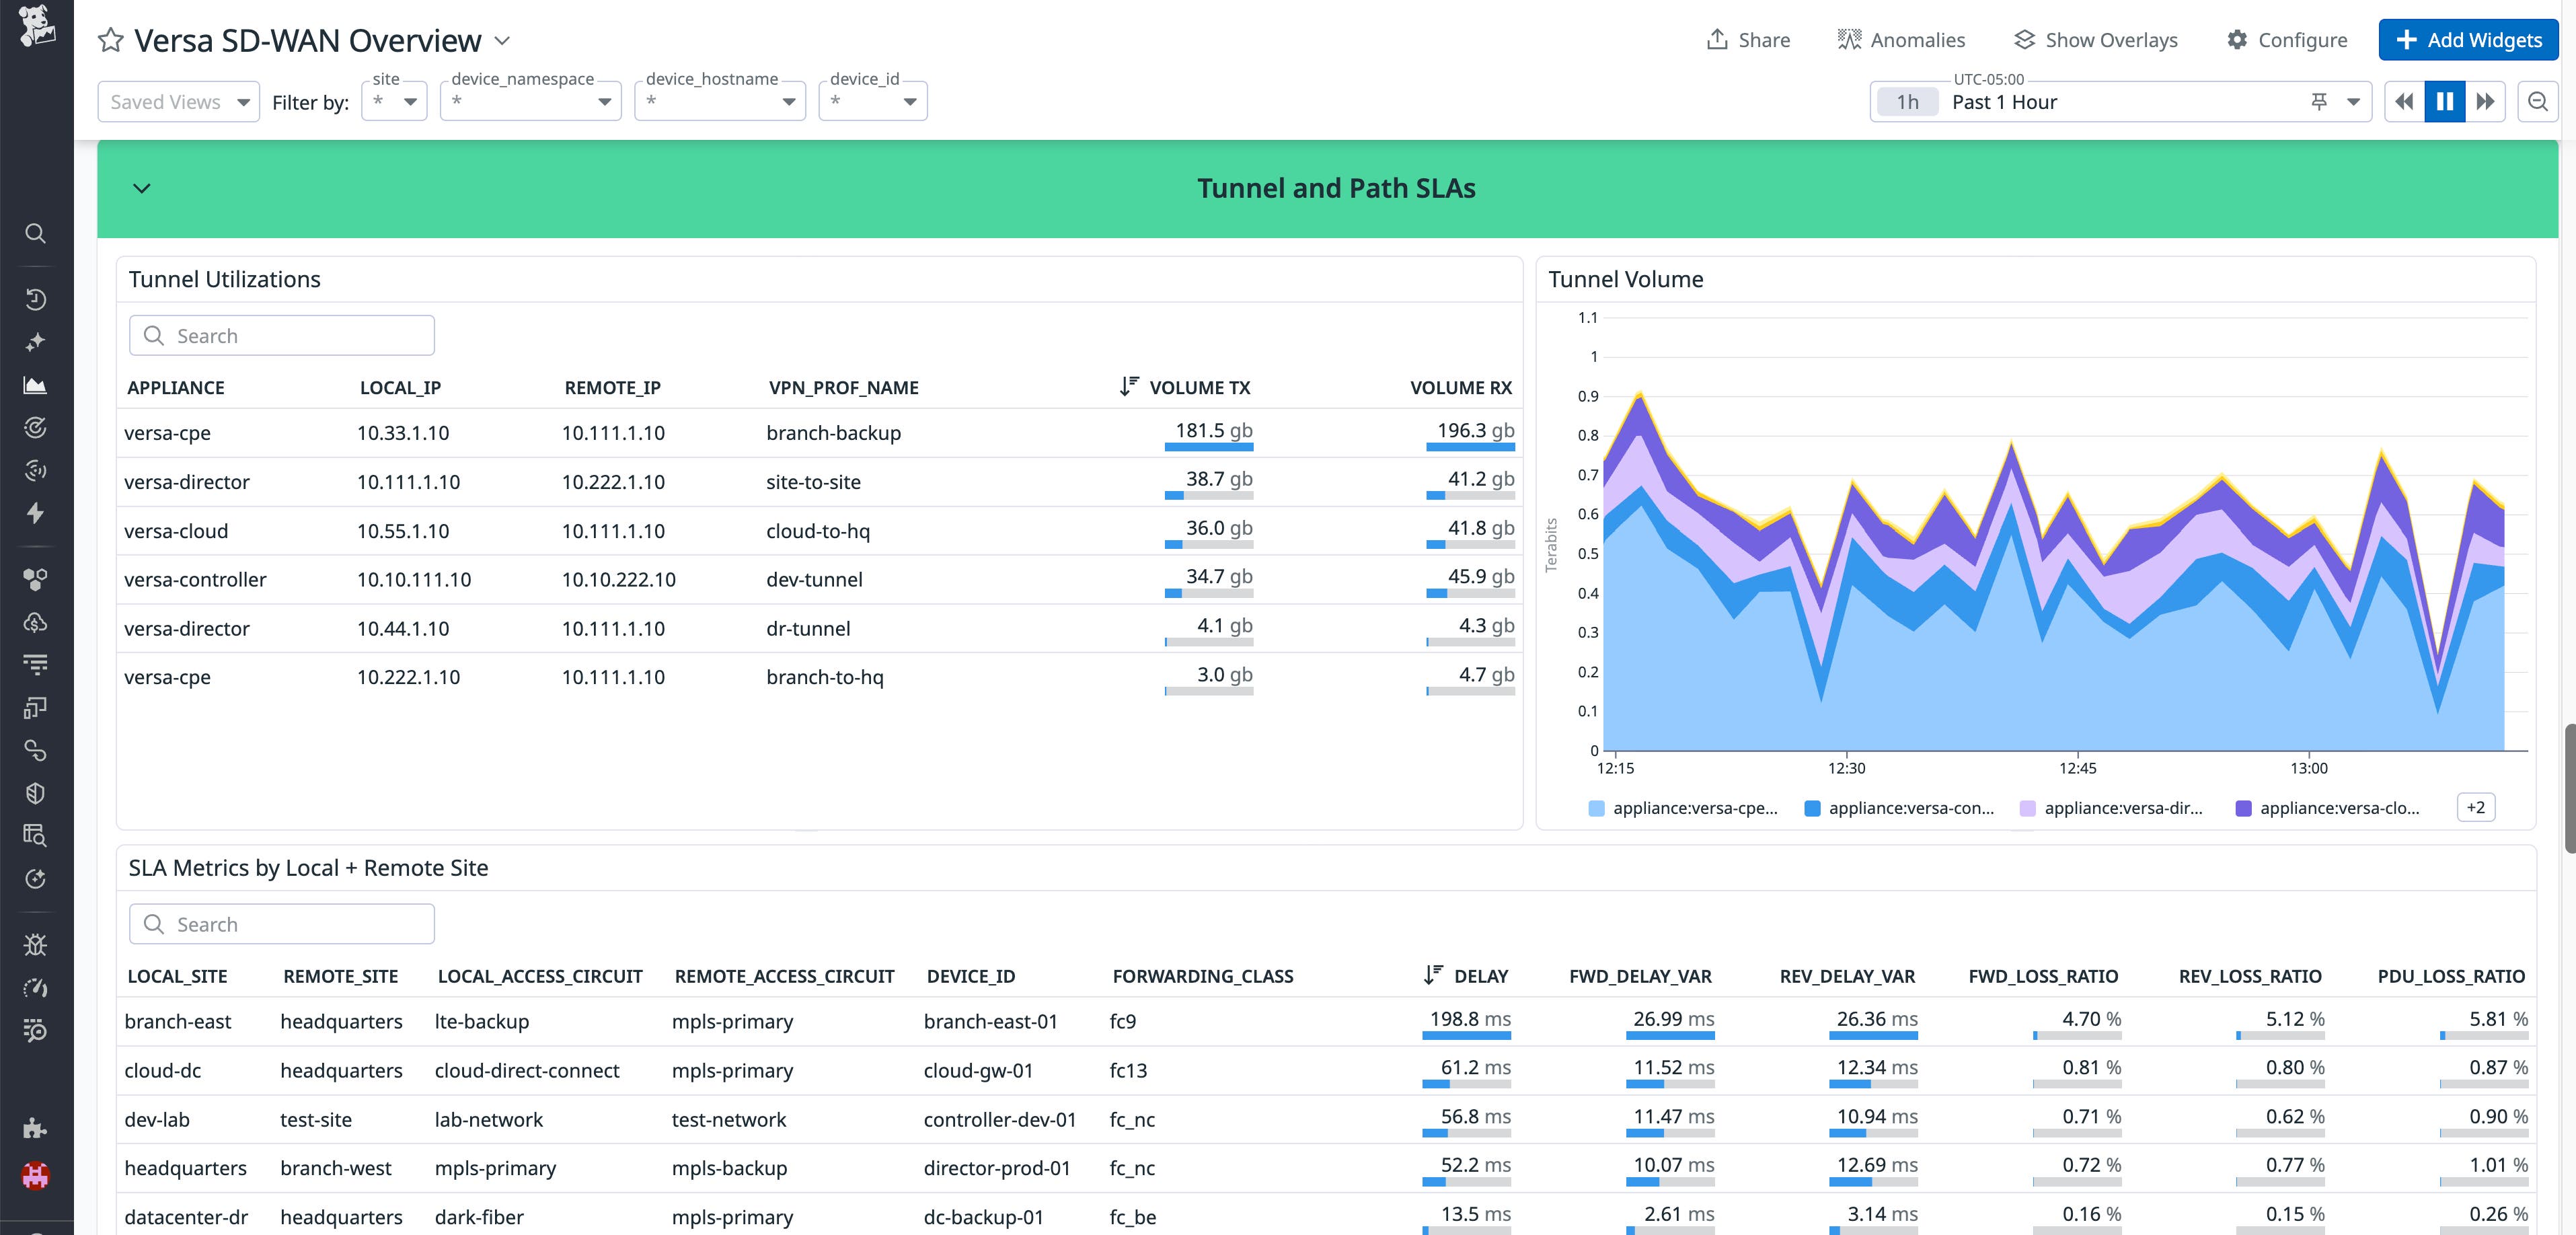
With these insights, teams can confirm that SLA-based policies are working as intended and quickly make adjustments when a tunnel or path starts to violate performance thresholds before users feel the impact.
Analyze interface utilization and congestion
Even when links are available, congestion can degrade tunnel performance and application experience. Teams often need visibility into utilization percentages and packet counts to avoid unexpected traffic spikes or oversubscribed interfaces.
With the Datadog Versa integration, engineers have interface-level visibility of their SD-WAN, including inbound and outbound throughput, utilization percentages, packet counts, and error metrics. This helps teams identify which interfaces are saturated, when congestion occurs, and whether it aligns with specific traffic patterns or time windows.
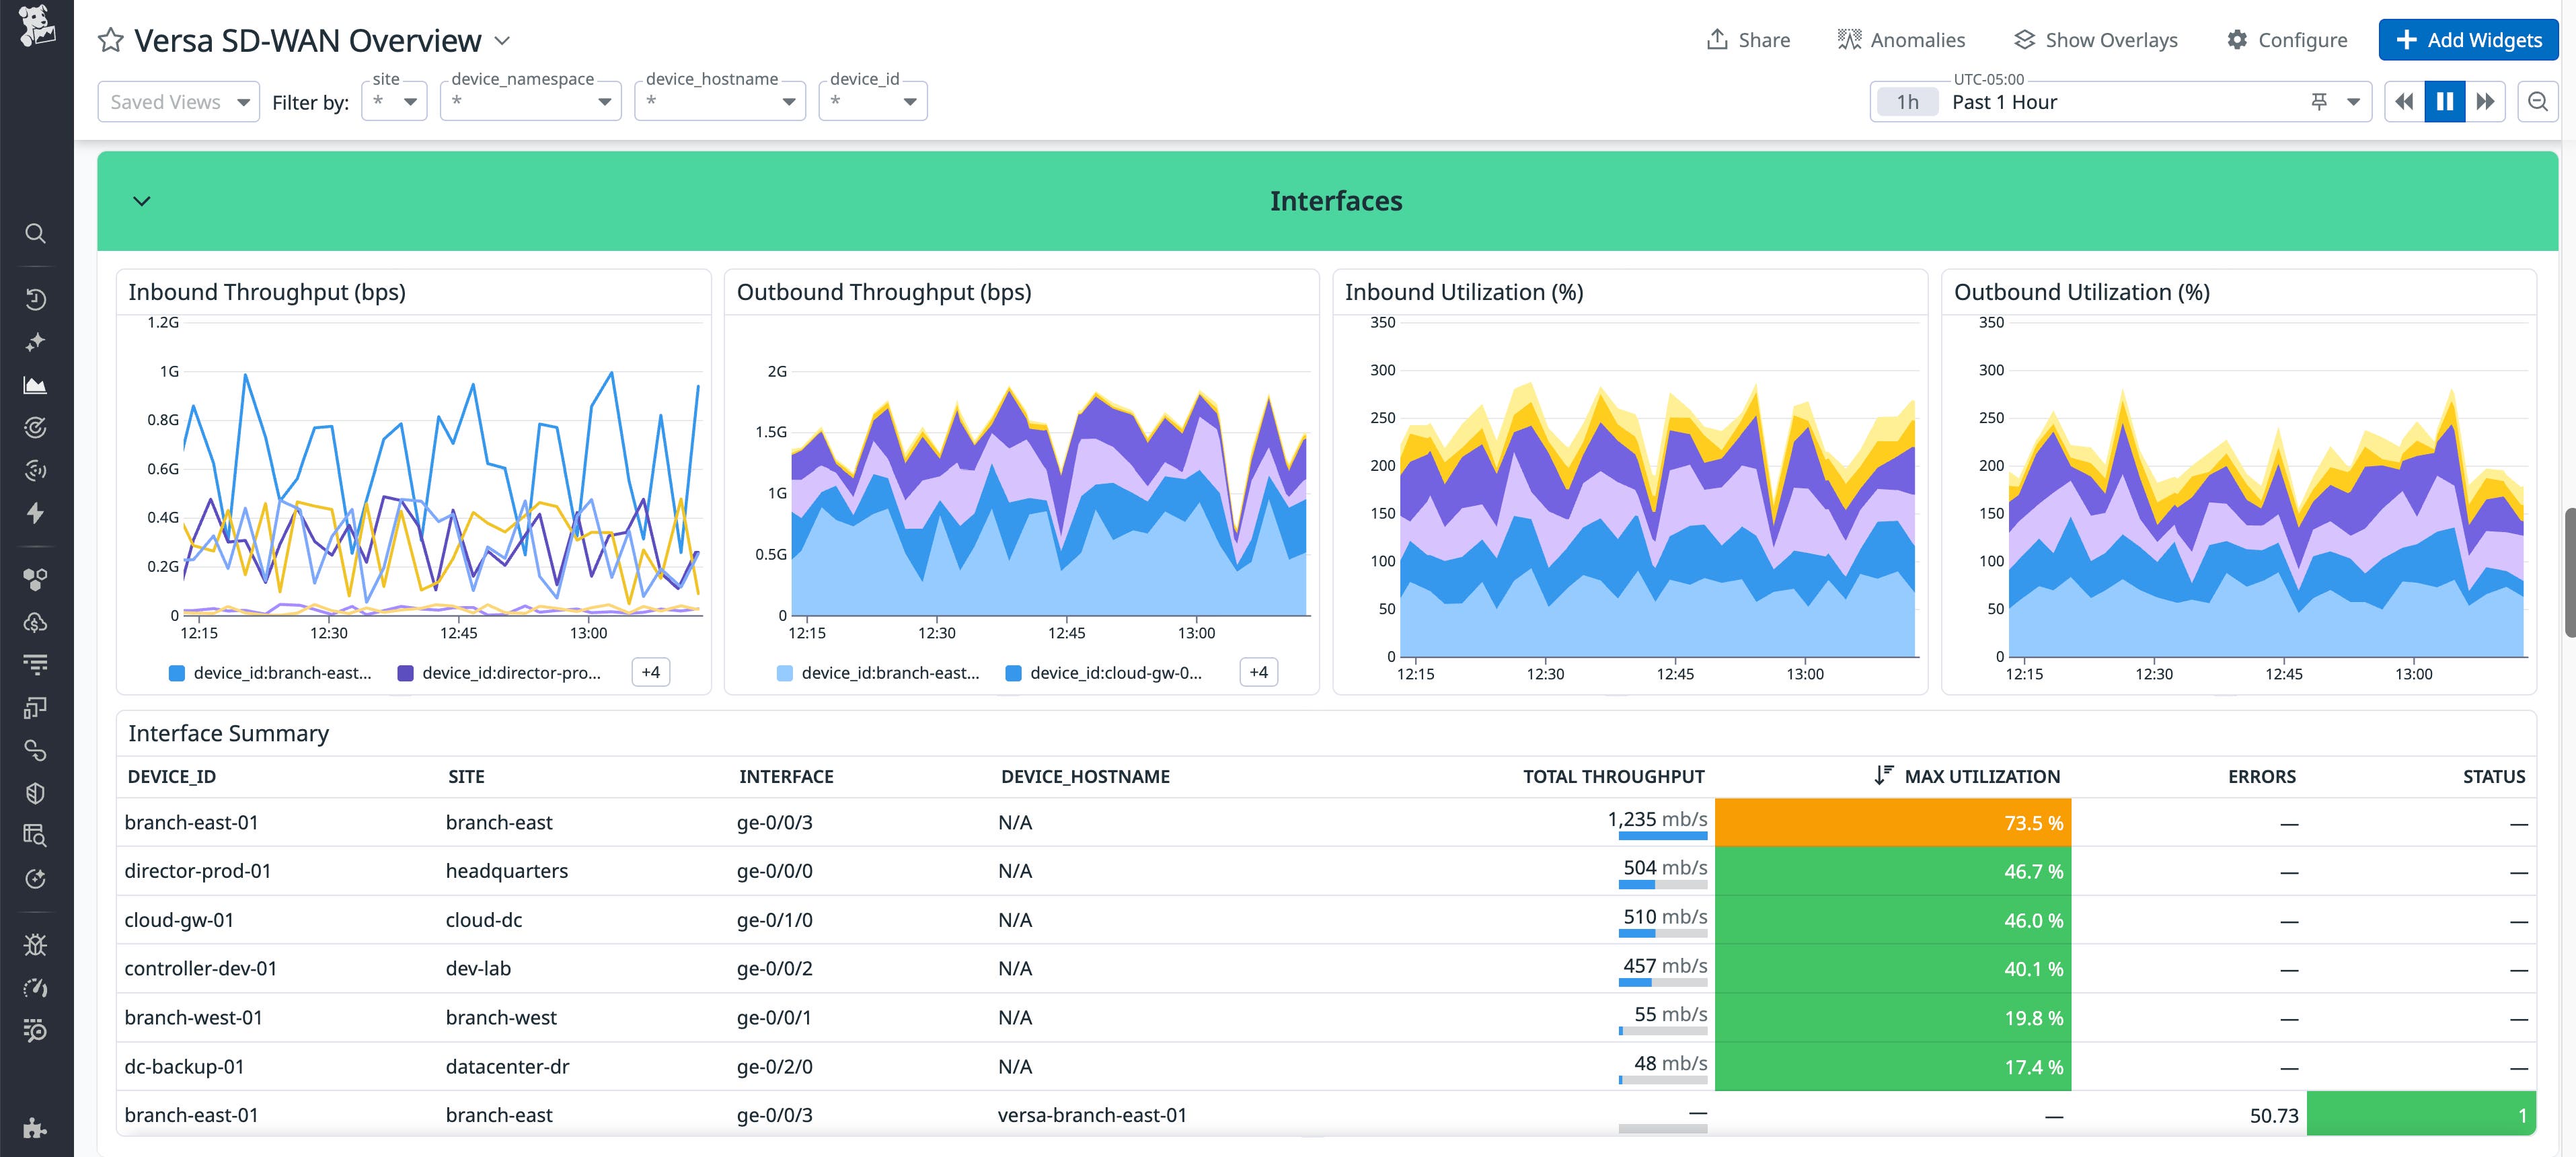
With this data, network engineers can make data-backed decisions around capacity planning, traffic shaping, and SD-WAN policy tuning to reduce contention on critical links.
Understand application, user, and QoS traffic patterns
Teams often need to go beyond monitoring link and device health to guarantee optimal performance of their networks. Understanding how bandwidth is being consumed is also key for capacity planning and troubleshooting WAN performance.
The Datadog integration surfaces application and user-level traffic metrics from Versa, including top applications and users by bandwidth, dedicated internet access traffic, and QoS metrics such as transmitted and dropped traffic per class. This makes it easier to see which workloads are driving WAN usage and whether QoS policies are prioritizing critical traffic as expected.
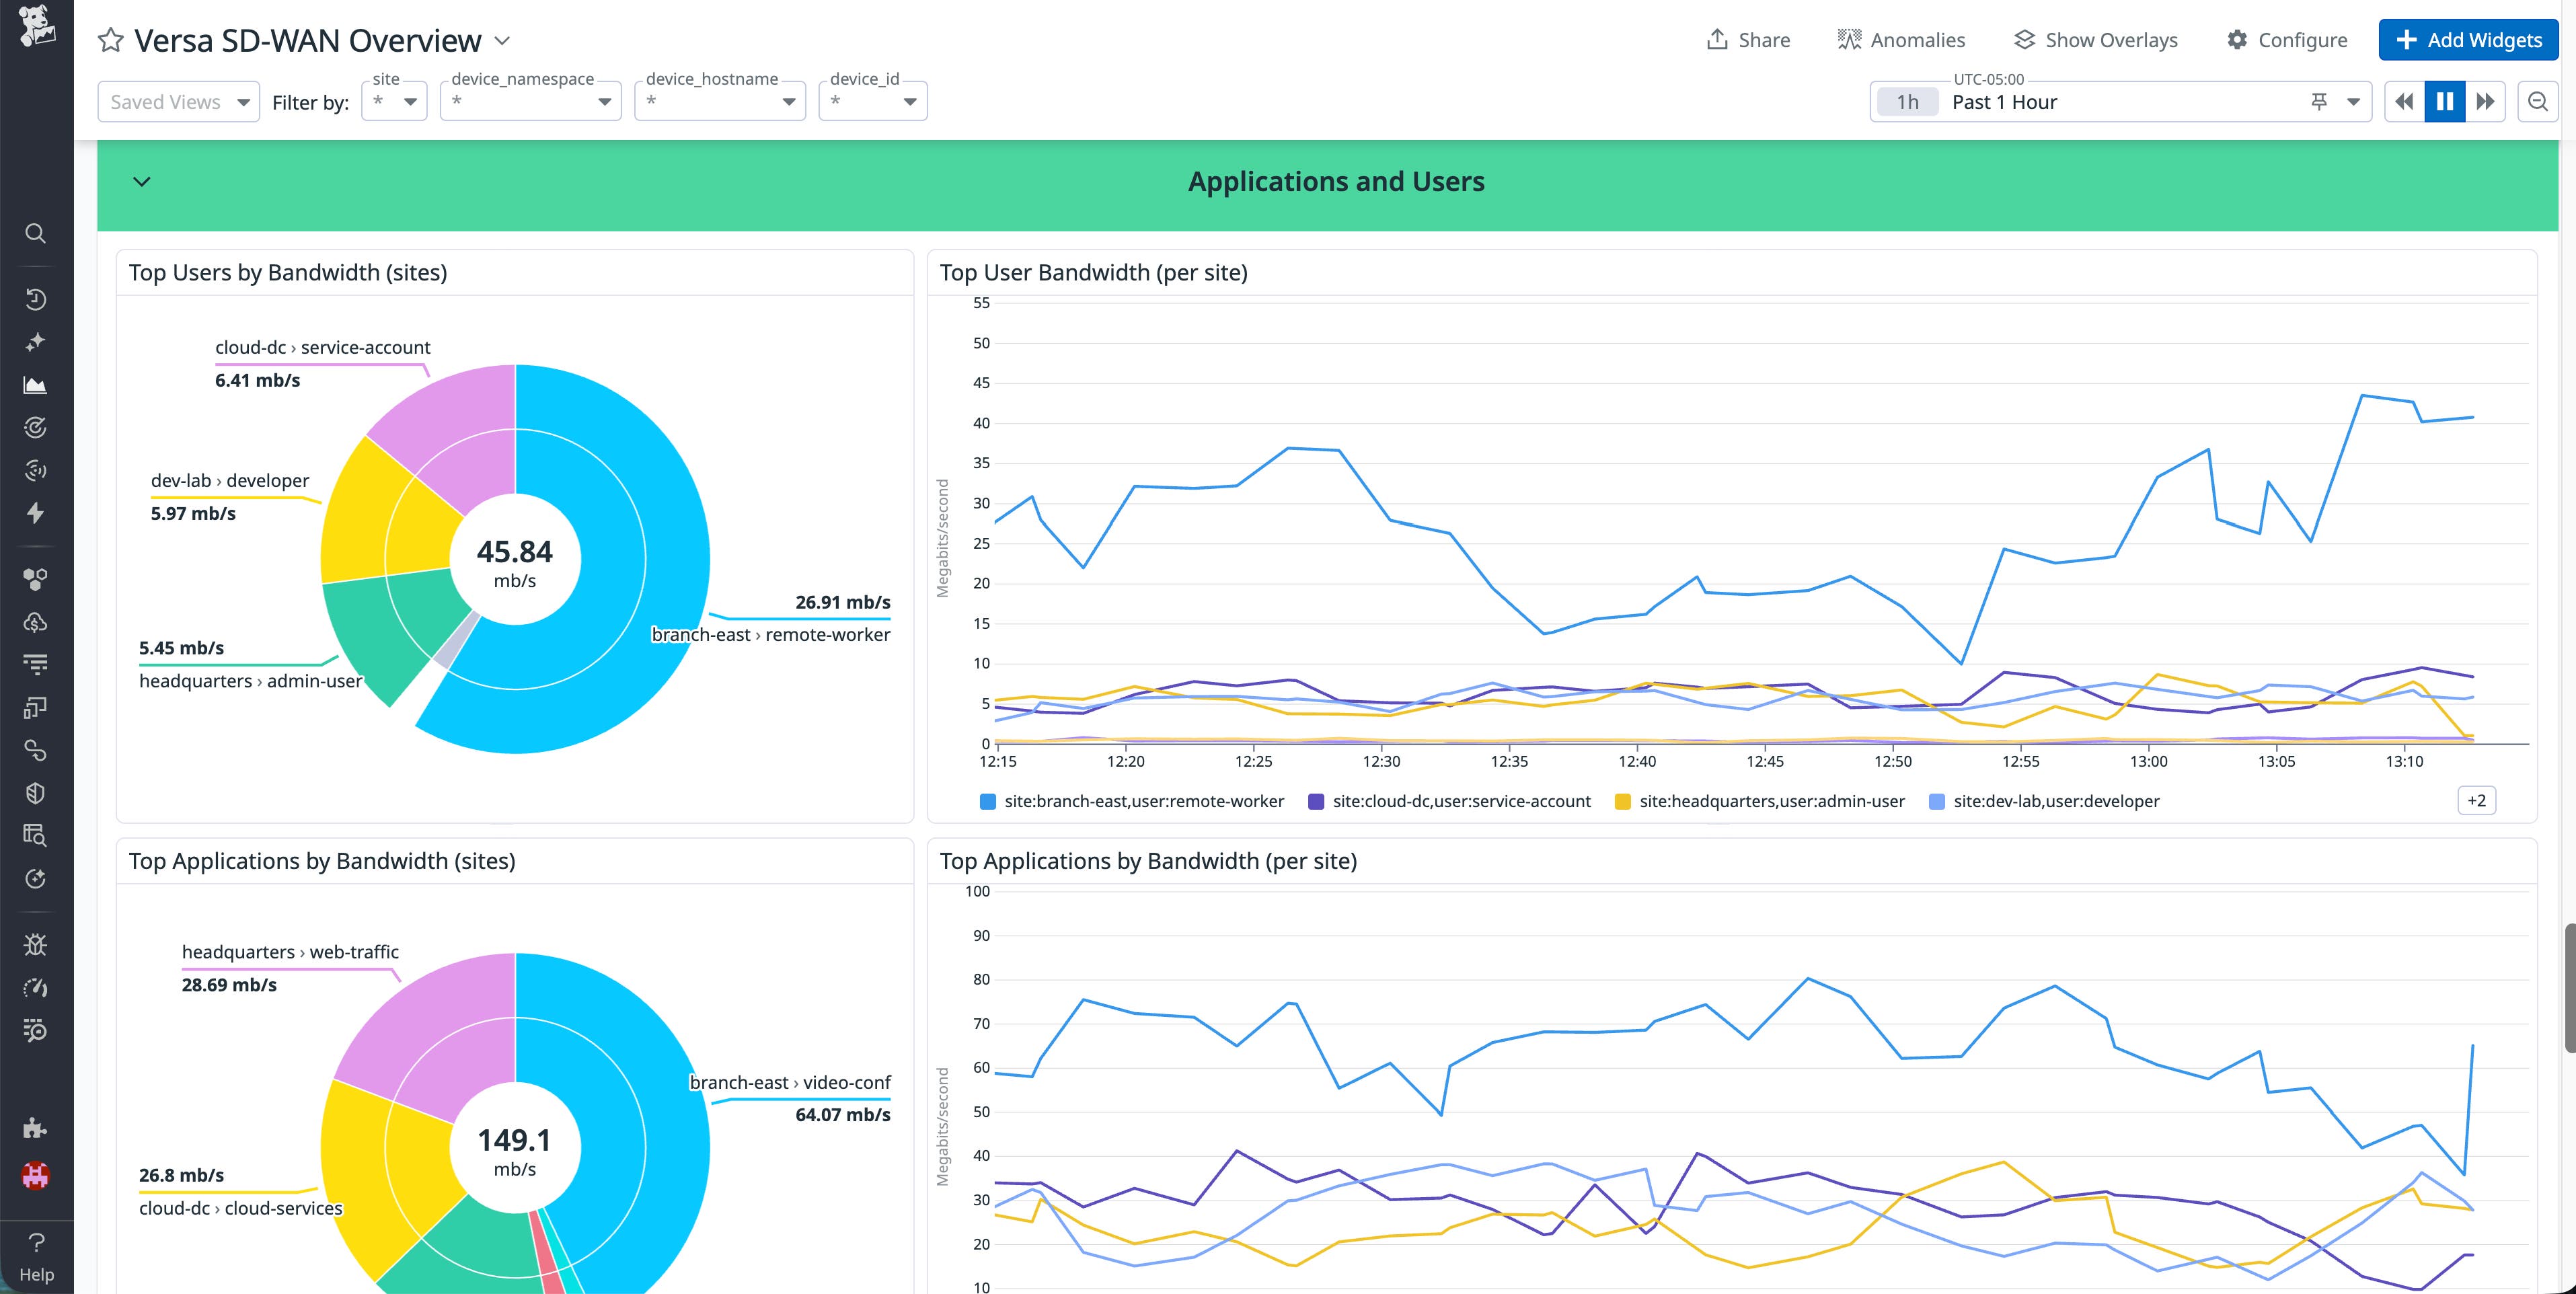
By combining traffic insights with device health and SLA data, teams can connect user behavior and application demand directly to observed WAN performance issues, making it easier to spot any flaws in policies that might be impacting critical applications.
Get end-to-end visibility into Versa SD-WAN with Datadog
The Versa integration extends Datadog Network Device Monitoring with end-to-end visibility into SD-WAN health, performance, and traffic patterns. By bringing device health, SLA metrics, interface utilization, and application traffic data into Datadog, teams can troubleshoot issues faster and make informed decisions about routing, capacity, and policy design.
To get started, configure the Versa integration and explore its corresponding out-of-the-box dashboard in Datadog. For setup and configuration details, see the Versa documentation. If you’re new to Datadog, you can start a free 14-day trial.


