
Kai Xin Tai
In this series, we’ve introduced key HashiCorp Vault metrics and logs to watch, and looked at some ways to retrieve that information with built-in monitoring tools. Vault is made up of many moving parts, including the core, secrets engine, and audit devices. To get a full picture of Vault health and performance, it’s important to track all these components, along with the resources they consume from their underlying infrastructure. With Datadog, you can get deep visibility into all these components—and the applications that request secrets from Vault—in one place.
In this post, we’ll show you how Datadog helps you monitor Vault more comprehensively with 1,000+ turn-key integrations, sophisticated alerting, and log analytics. With Datadog, you can automatically detect potential security threats, correlate data across your stack, and track long-term performance trends, all in one platform.
To get you started with monitoring Vault, we’ll cover how to:
- Set up Datadog’s Vault integration
- Explore Vault metrics in customizable dashboards
- Collect and analyze Vault logs
- Create automated alerts to detect Vault health and performance issues
Getting from Vault to Datadog
Vault aggregates metrics every 10 seconds and holds them in memory for one minute, giving you a quick snapshot of your cluster’s vital signs. But in order to track long-term performance trends and effectively troubleshoot issues, you can configure Datadog to collect and retain these metrics over a longer period of time.
The Datadog Agent is open source software that collects metrics, distributed traces, and logs from your environment and sends them to Datadog, where they are retained at full granularity for 15 months. In addition to gathering telemetry data from Vault’s /sys/metrics endpoint, the Agent automatically reports resource metrics (e.g., CPU, memory, network throughput) from your servers.
To install the Agent, navigate to the Agent installation page of your Datadog account and follow the instructions for your host’s OS. If you’re new to Datadog and would like to follow along with this post, sign up for a free trial. To set up Datadog’s Vault integration, you’ll either need to use a client token or provide the Agent with unauthenticated access to Vault’s metrics endpoint. We’ll describe both of these methods in the following sections.
Use a client token
Our documentation provides instructions on creating a client token to authenticate the Datadog Agent to Vault. Once you’ve created the token, you’ll need to locate the Agent’s directory for integration-specific configuration files—refer to our documentation for more information. In that directory, you should see a Vault subdirectory (vault.d) that contains a sample Vault configuration file named conf.yaml.example. Make a copy of the file in the same directory and save it as conf.yaml. Edit the file to include the location of your Vault HTTP server (api_url), as well as the client token you created for the Datadog Agent earlier (client_token) or path to a directory that contains this client token (client_token_path):
init_config:
instances: ## @param api_url - string - required ## URL of the Vault to query. # - api_url: http://localhost:8200/v1
## @param client_token - string - optional ## Client token necessary to collect metrics. # client_token: <CLIENT_TOKEN>
## @param client_token_path - string - optional ## Path to a file containing the client token. Overrides `client_token`. ## The token will be re-read after every authorization error. # # client_token_path: <CLIENT_TOKEN_PATH>Restart the Agent so that your configuration changes take effect.
Or, if you would rather not add the token to the configuration file, you can use Datadog’s secrets management package to call an executable that can authenticate to and retrieve the token from Vault.
Enable unauthenticated access to the metrics endpoint
Alternatively, the Datadog Agent can collect metrics without a client token. To do this, you will first need to set the unauthenticated_metrics_access option in the telemetry stanza of your Vault configuration to true to provide the Agent with unauthenticated access to the /sys/metrics endpoint.
listener "tcp" { telemetry { unauthenticated_metrics_access = true }}Then, in conf.yaml, set the no_token option to true.
init_config:
instances: ## @param api_url - string - required ## URL of the Vault to query. - api_url: http://localhost:8200/v1
## @param no_token - boolean - optional - default: false ## Attempt metric collection without a token. no_token: trueRestart the Agent to apply these configuration changes. The Agent should now be collecting Vault metrics and forwarding them to your Datadog account.
Explore Vault metrics in customizable dashboards
Within minutes of enabling Datadog’s Vault integration, data from your clusters will begin flowing into an out-of-the-box dashboard. This dashboard provides a high-level overview of the health and performance of your clusters, ranging from request throughput and latency to token activity and Consul usage.
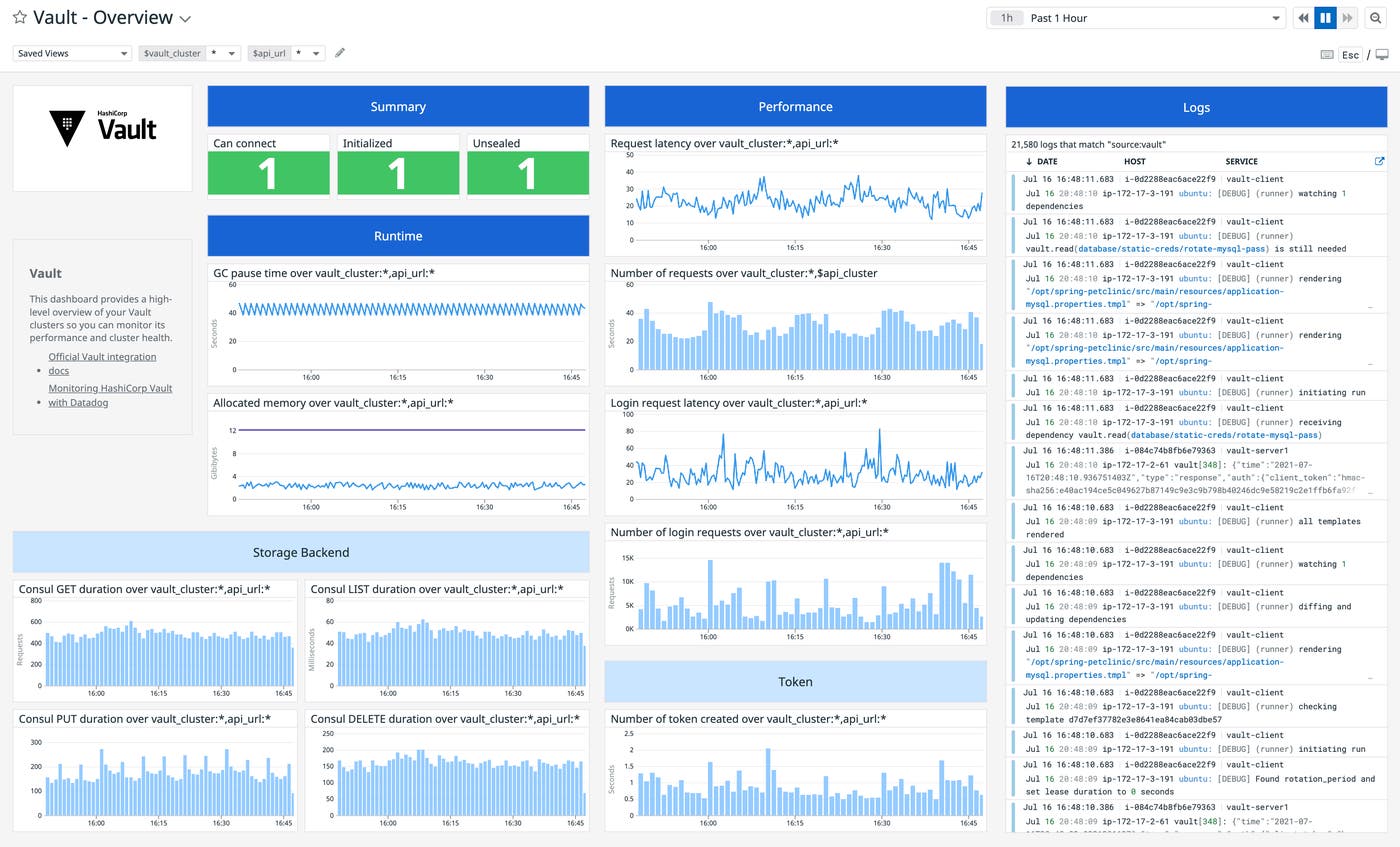
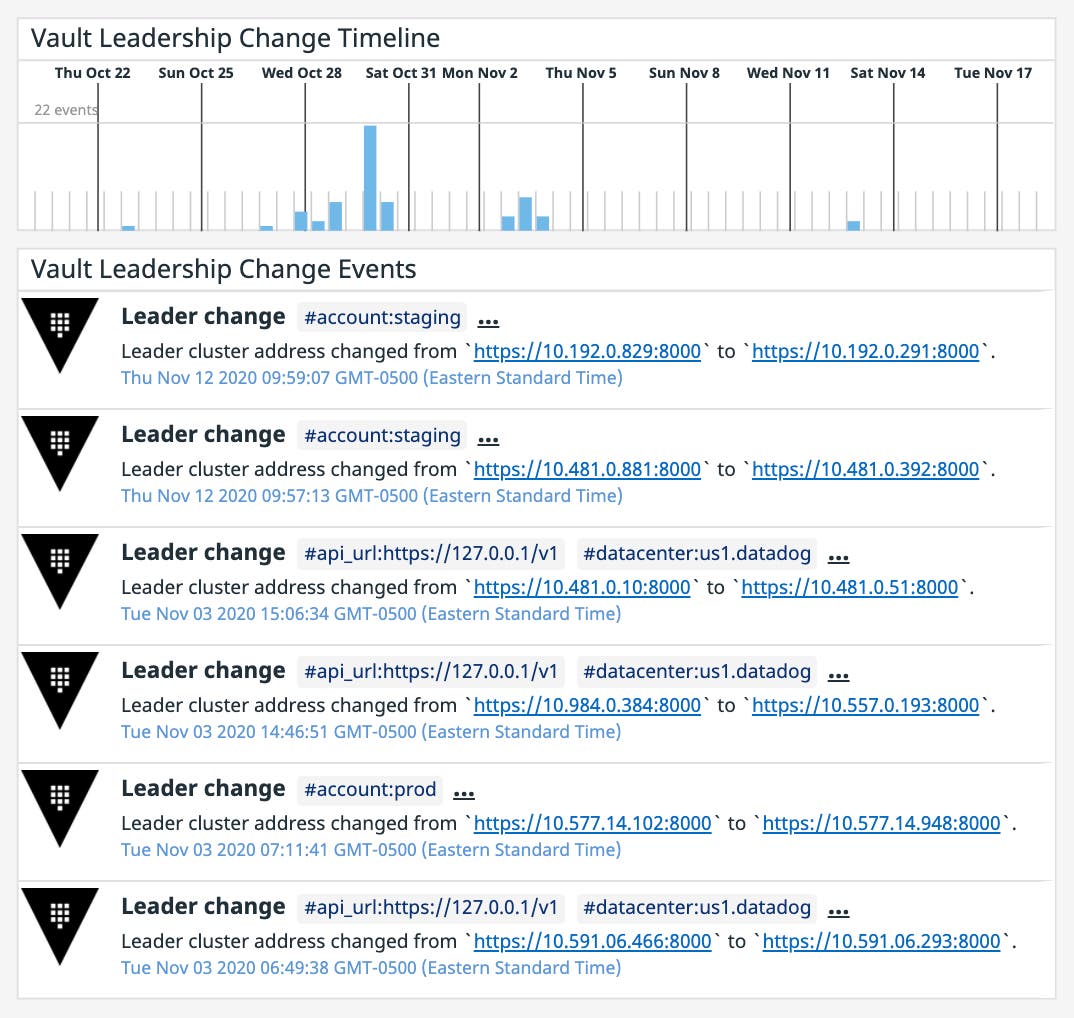
You can clone and customize the dashboard to include data from 1,000+ technologies for even more comprehensive monitoring. If you’re not using Consul, you can include graphs and widgets from your storage backend, such as Amazon S3, PostgreSQL, or Cassandra. You can also add event timeline and event stream widgets to your dashboards, allowing you to track when (and how often) important events occur. For instance, frequent changes in cluster leadership in a short period of time could be indicative of a security incident. Later in the post, we’ll show you how you can alert on leadership issues.
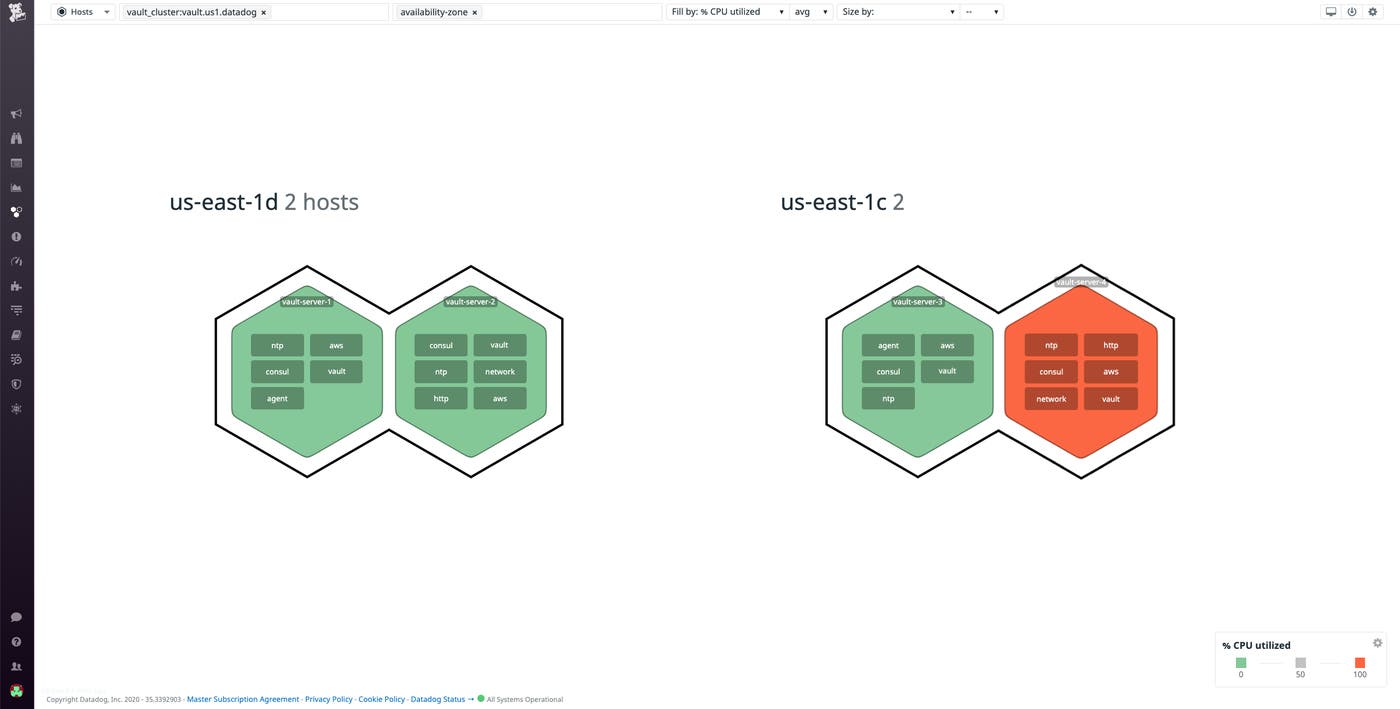
In addition, Datadog’s host maps give you a high-level view of your servers, helping you visualize and understand their resource utilization. You can use tags (e.g., instance, host, cloud provider) to group and filter your map, making it easy to drill down to specific segments of your infrastructure when troubleshooting an issue. For example, you can see at a glance if one of your servers is consuming more CPU than the rest, or if a particular availability zone is experiencing higher load and might benefit from rebalancing.
Collect and analyze all your Vault logs
You can gain an even deeper understanding of Vault’s activity by collecting and analyzing logs from your Vault servers. By uniting your metrics and logs, Datadog gives you the context you need to detect errors, investigate issues, and gain deeper insight into your infrastructure and applications. And Datadog Cloud SIEM uses vault logs to automatically detect potential threats to your cluster. In this section, we’ll show you how to collect and analyze your Vault logs with Datadog.
Enable log collection
To configure the Datadog Agent to collect logs, you will need to set the logs_enabled parameter to true in your Agent configuration file (datadog.yaml):
logs_enabled: trueThen, add the following configuration block to your vault.d/conf.yaml file to start collecting Vault logs:
logs: - type: file path: /path/to/vault-audit.log source: vault - type: file path: /path/to/vault.log source: vaultYou’ll need to specify the paths to your Vault audit and server logs. For audit logs, you would have specified a location when you used the vault audit enable file command to enable audit logging. The location of your Vault server logs varies depending on the platform you’re running; see Vault’s documentation for details.
Next, you’ll want to ensure that the source attribute is set to vault to trigger Datadog’s built-in Vault integration pipeline, which automatically extracts key attributes from your logs. And by applying tags to your services in a consistent way through Datadog’s unified service tagging, you can seamlessly pivot between related logs, metrics, distributed traces, and profiles for all the context you need to troubleshoot an issue.
Save the configuration file and restart the Agent to apply the latest changes.
Explore all of your logs
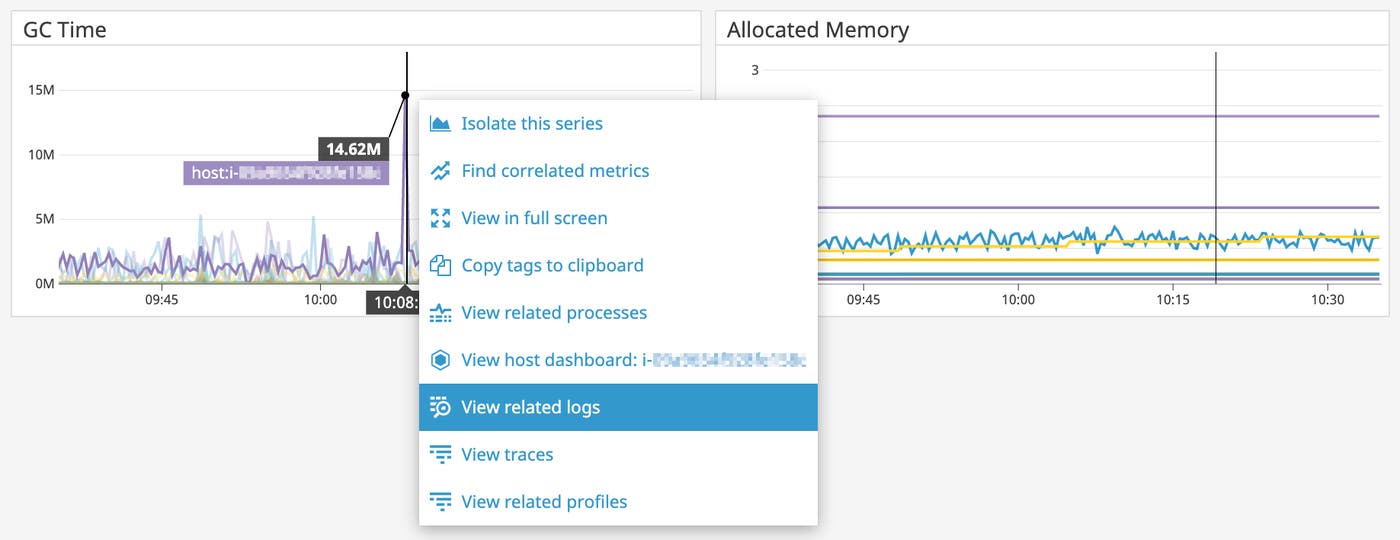
Now that the Datadog Agent is collecting logs from your Vault servers, you can start correlating metrics with logs to get deeper insights into Vault performance. For example, if you notice any unusual activity in the out-of-the-box Vault dashboard, you can immediately pivot to logs for more context to begin troubleshooting. Datadog’s log processing pipeline automatically parses and enriches your logs with metadata from your host and cloud provider, making it easy for you to filter and analyze logs from Vault and any of the other technologies you’re monitoring.
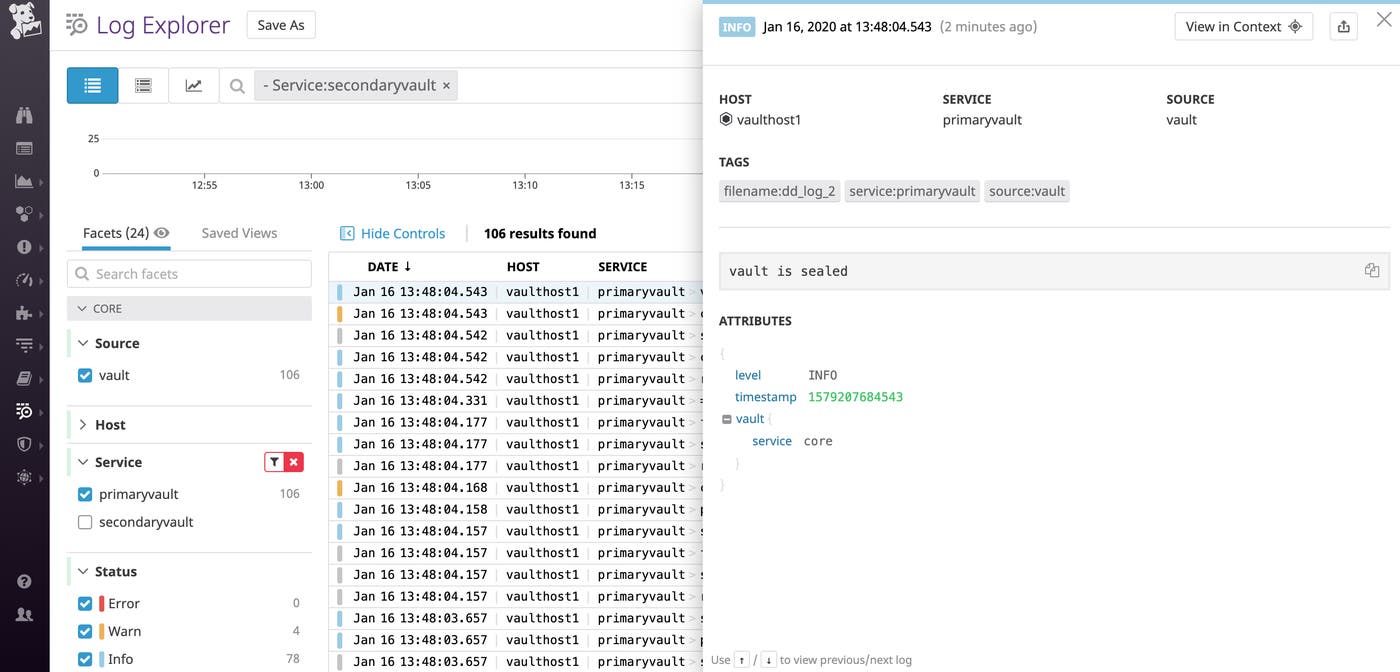
The screenshot below shows how you can use the service attribute to filter your logs. In this example, we’re showing only logs related to the primaryvault service and filtering out logs from the secondaryvault service. The highlighted log indicates that the Vault is sealed, which could mean that your secrets management service is unavailable, preventing your services from communicating with one another.
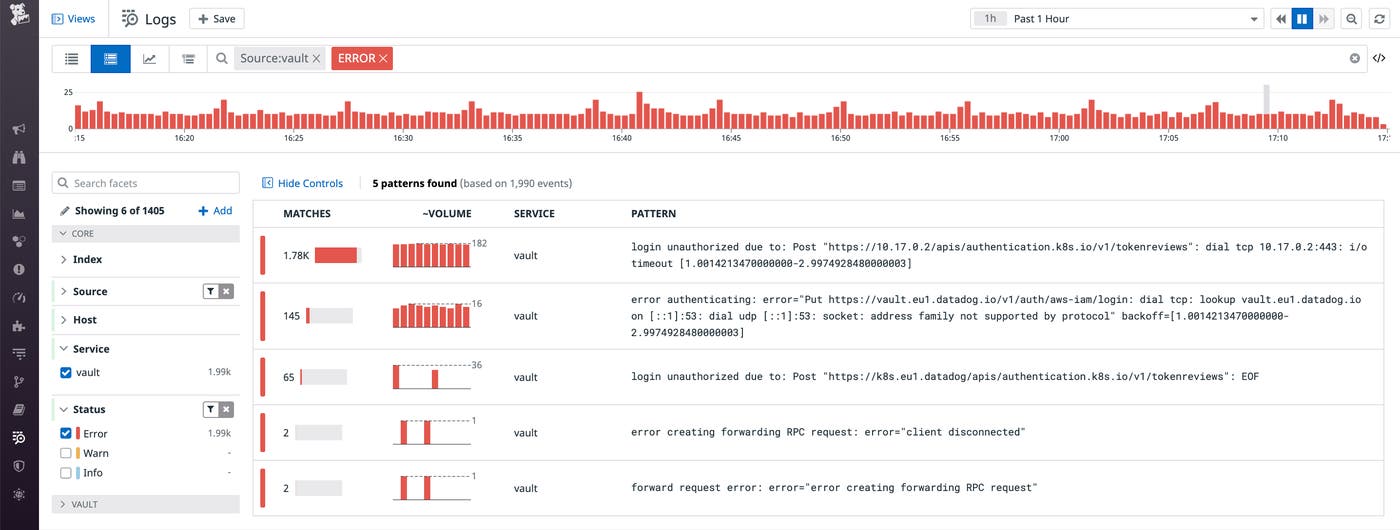
As Vault generates large volumes of logs, it might not be immediately obvious where to look when you’re trying to troubleshoot an issue. The Log Patterns view groups your logs into clusters based on common patterns to surface interesting trends. This is especially useful for cutting through the noise and steering your investigation in the right direction so you can speed up resolution time.
For example, if you notice that Vault is returning more errors than usual, you can use Log Patterns to identify the most common types of errors. In the example below, we see that logs with the message [ERROR]: login unauthorized due to: Post "https://10.17.0.2/apis/authentication.k8s.io/v1/tokenreviews": dial tcp 10.17.0.2:443: i/o timeout are the most common, which means that we’ll want to look into why Vault is unable to connect to Kubernetes for authentication.
Be alerted of issues within your Vault cluster
Since authentication is crucial to the availability of your applications, you’ll want to know if Vault is facing any issues as soon as possible, so you can address them and minimize downtime. Datadog can automatically alert you of anomalous changes in Vault’s activity—such frequent changes in leadership and spikes in failed login requests—that could be indicative of attempted attacks.
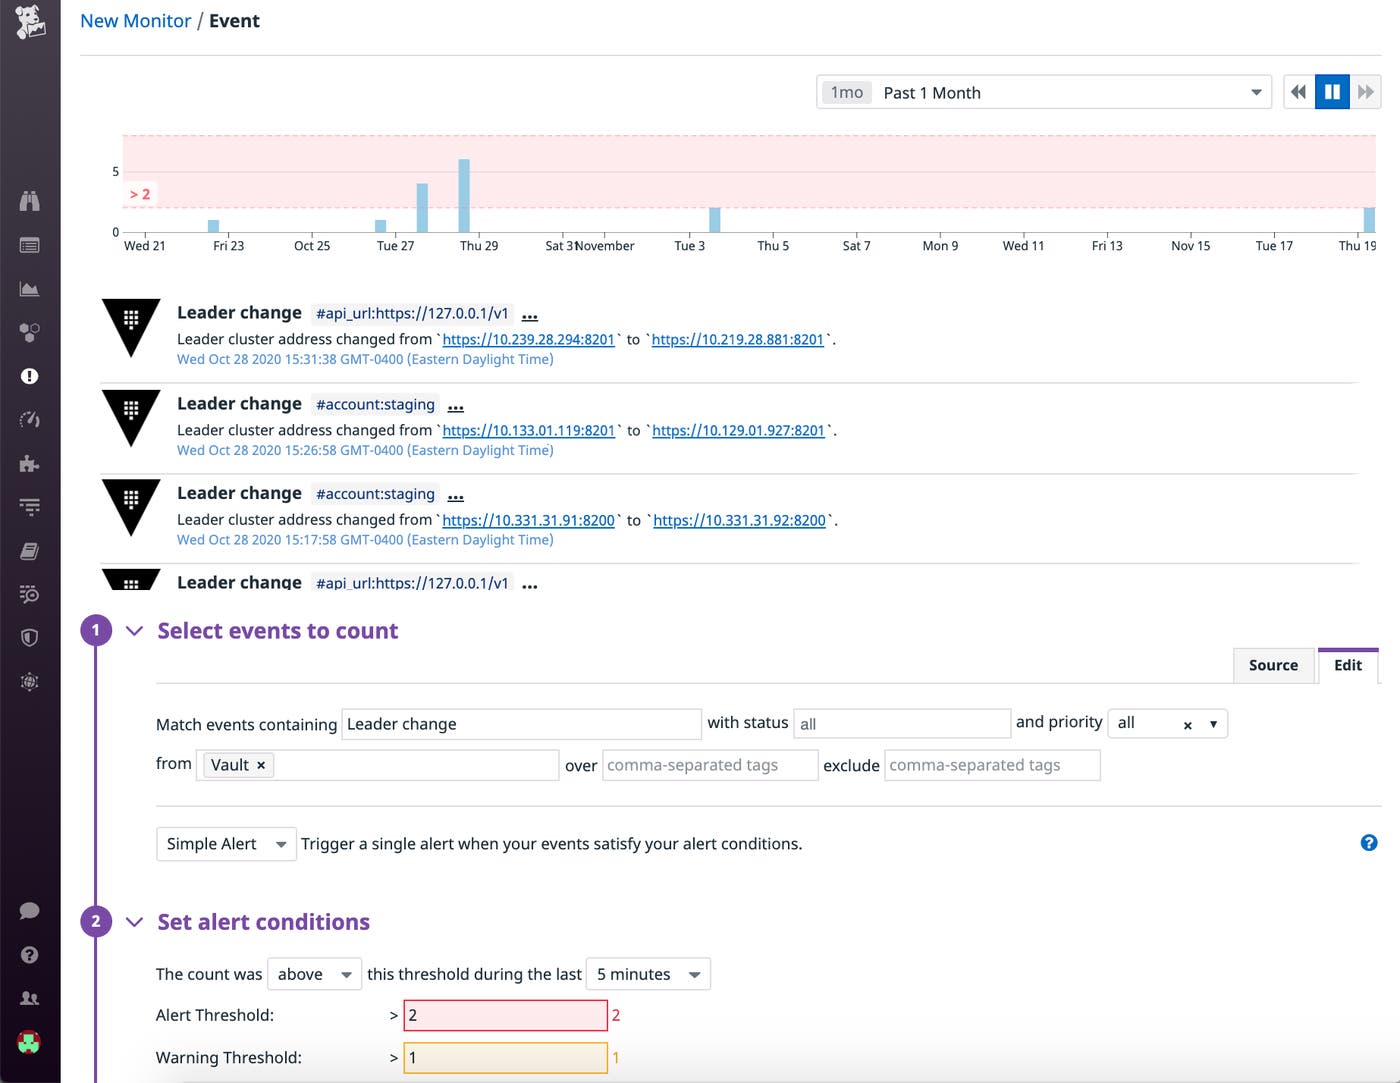
As we discussed in Part 1, high leadership turnover in a short period of time could mean that your Vault servers are failing repeatedly or a member of your team is manually sealing them in response to a detected breach. When a leader fails, it stops serving requests and becomes unavailable to clients that depend on Vault. With Datadog, you can create an alert to notify you when the number of leadership changes exceeds a certain threshold. You can also use tags to trigger separate alerts for each datacenter, availability zone, or host.
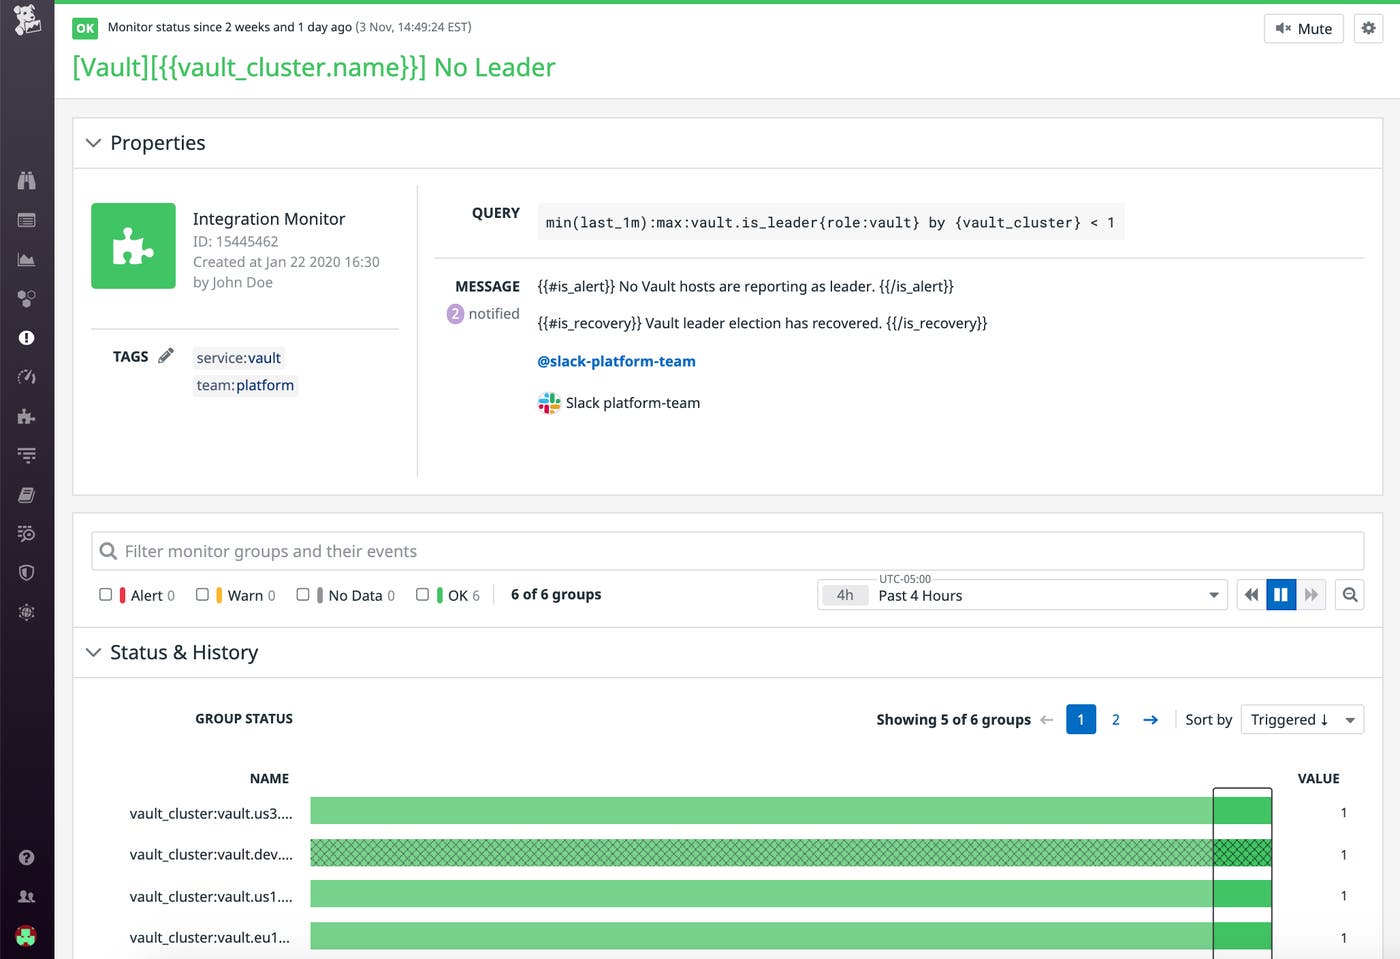
Additionally, we’ve configured an alert to notify us when Vault fails to elect any of its servers as the leader since it means that the service is unavailable. When setting up the alert, we’ve instructed Datadog to send a notification to our team’s Slack channel each time it triggers. This way, a member of the team is able to immediately troubleshoot the issue before users experience any performance degradations.
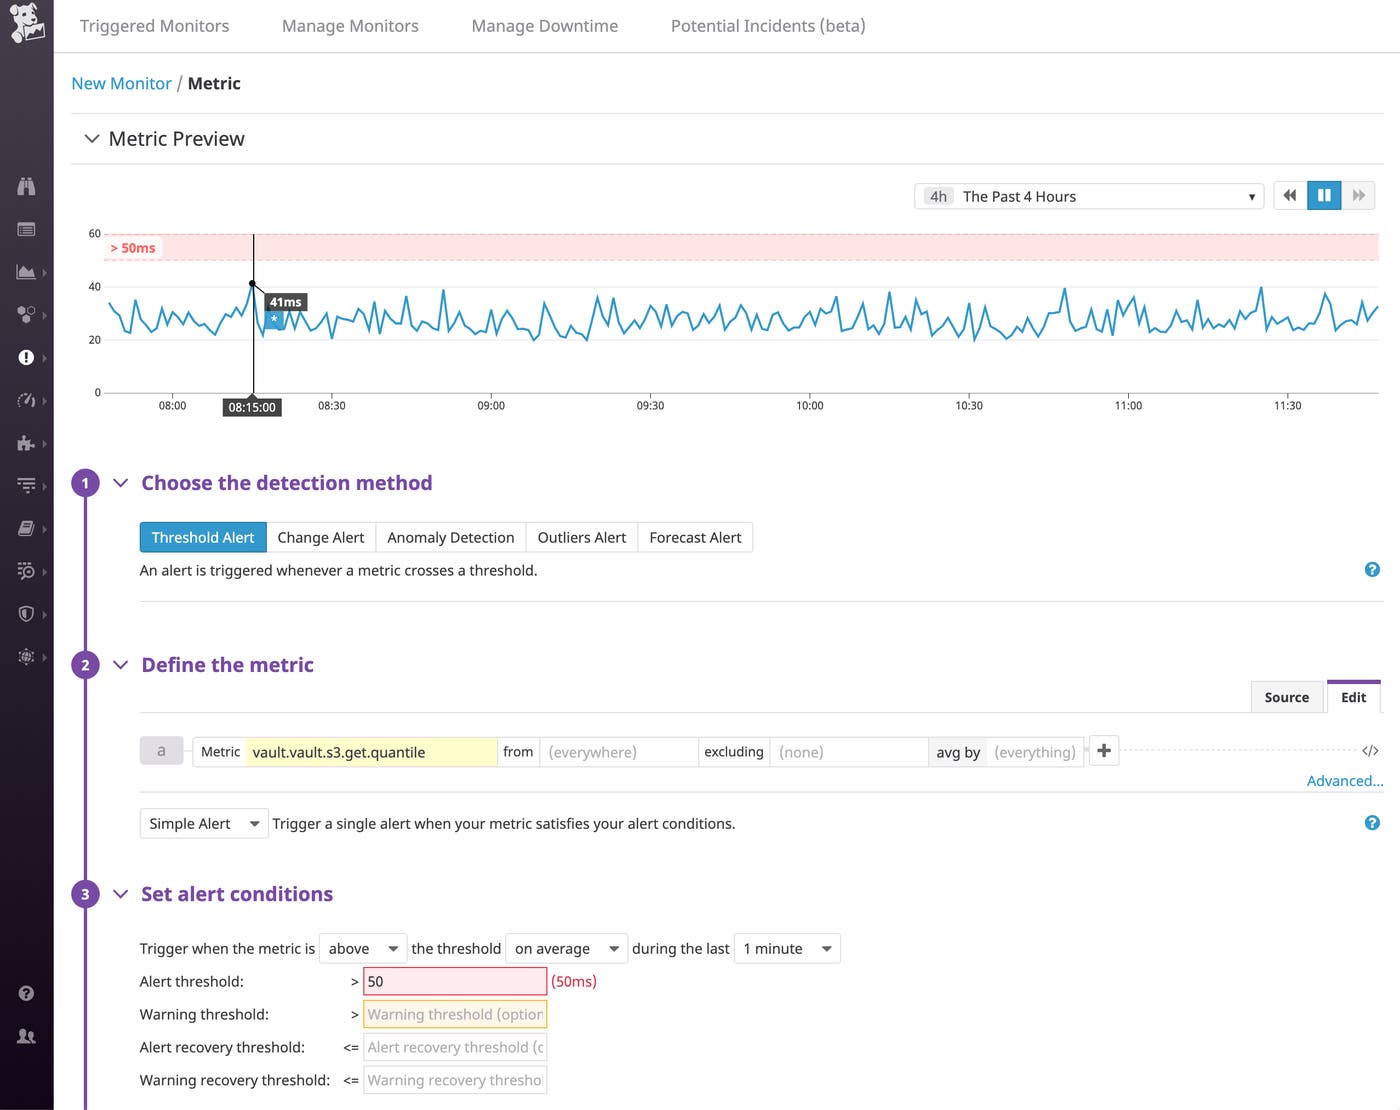
Besides leadership changes, you may also want to configure an alert to notify you if your storage backend (Amazon S3 in the example below) is taking too long to access your secrets. Adding a descriptive notification message, along with recommended next steps and links to resources (e.g., related dashboards and runbooks) can give your team the necessary context to troubleshoot the issue in a timely manner.
Start monitoring Vault with Datadog
If your applications depend on Vault to manage their secrets, you will want to ensure that Vault is always properly configured, highly performant, and protected against attacks. In this post, we’ve covered how Datadog can give you comprehensive visibility into the health and performance of your Vault clusters. Since Datadog integrates with more than 1,000 technologies, you can monitor all of Vault’s components, alongside the clients that connect to it and the infrastructure that runs it all—in a single, unified platform. With customizable dashboards, log management, and automated alerting, Datadog can help you discover and troubleshoot complex issues from blocked audit devices to misconfigured policies that are preventing clients from properly accessing the secrets they need.
If you don’t yet have a Datadog account, sign up for a free 14-day trial to start monitoring Vault today.


