Antoine Dussault

Aaron Kaplan
Tracing provides indispensable insights into the state and performance of distributed applications, but it can often be difficult to determine the root cause or ultimate business impact of issues indicated by traces. Translating visibility of individual microservices into broader performance insights often requires drawing complex correlations between spans. This can be a laborious process, which can complicate everything from troubleshooting and triage to tracking KPIs and managing costs.
To address these challenges, Trace Queries in Datadog APM allows you to filter and analyze traces based on trace-level attributes (such as the number of spans or end-to-end trace duration), service relationships, endpoints, and other properties. Powered by the Trace Query Language, Trace Queries enables application developers to quickly turn granular visibility of microservices into bigger-picture insights on the health of application requests and the business impact of service performance.
In this post, we’ll guide you through using Trace Queries to:
Pinpoint the root causes of performance issues
Root cause analysis can be a considerable challenge when it comes to troubleshooting errors surfaced by distributed traces. As engineers probe for underlying bugs, they must often work their way progressively upstream or downstream from wherever they first detected an error, tracking down dependencies and investigating a wide range of interconnected services managed by separate teams. This can be a painstaking, time-consuming process, which can cause customer-facing issues to linger.
With Trace Queries, you can expedite your troubleshooting by quickly putting any performance issue or piece of your application architecture in context. Trace Queries lets you search for traces by combining span properties and trace-level attributes with Boolean and other relational operators for flexible querying.
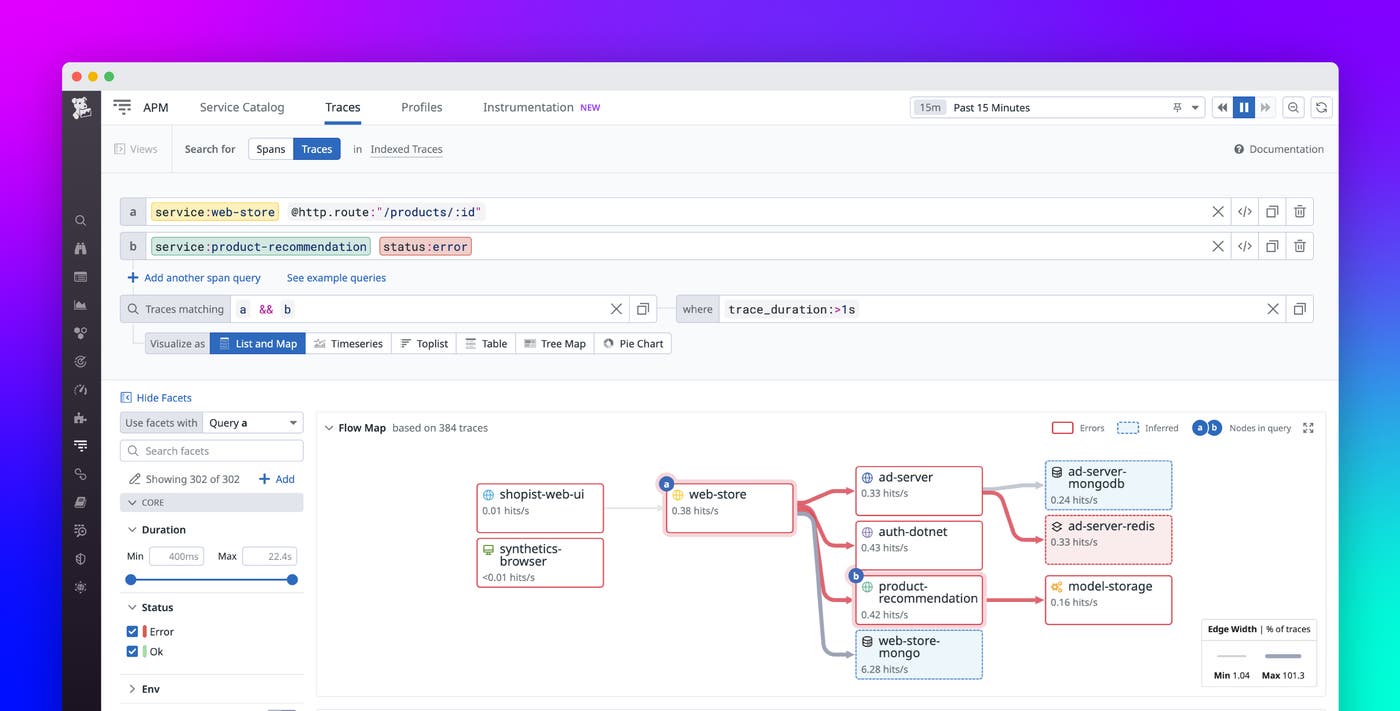
By default, all matches for each trace query are visualized using the List and Map option. This option provides a Flow Map, which visualizes request paths and service dependencies based on your query, as well as a list of all traces matching your query. The Flow Map visually highlights components with an elevated error rate, and you can hover over any component to inspect its error rate and request rate. Overall, the Flow Map enables you to quickly break down request paths and zero in on errors.
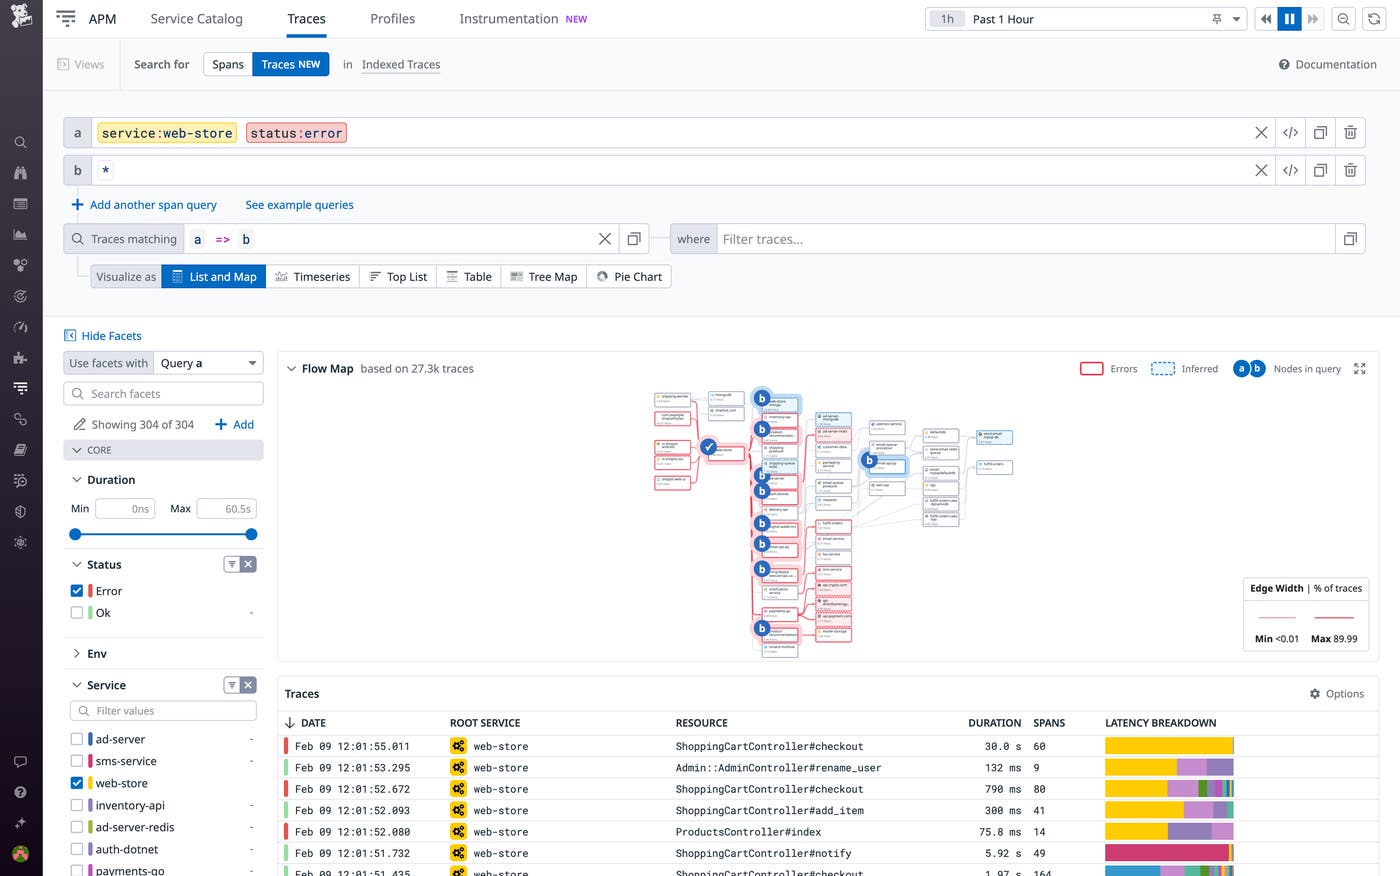
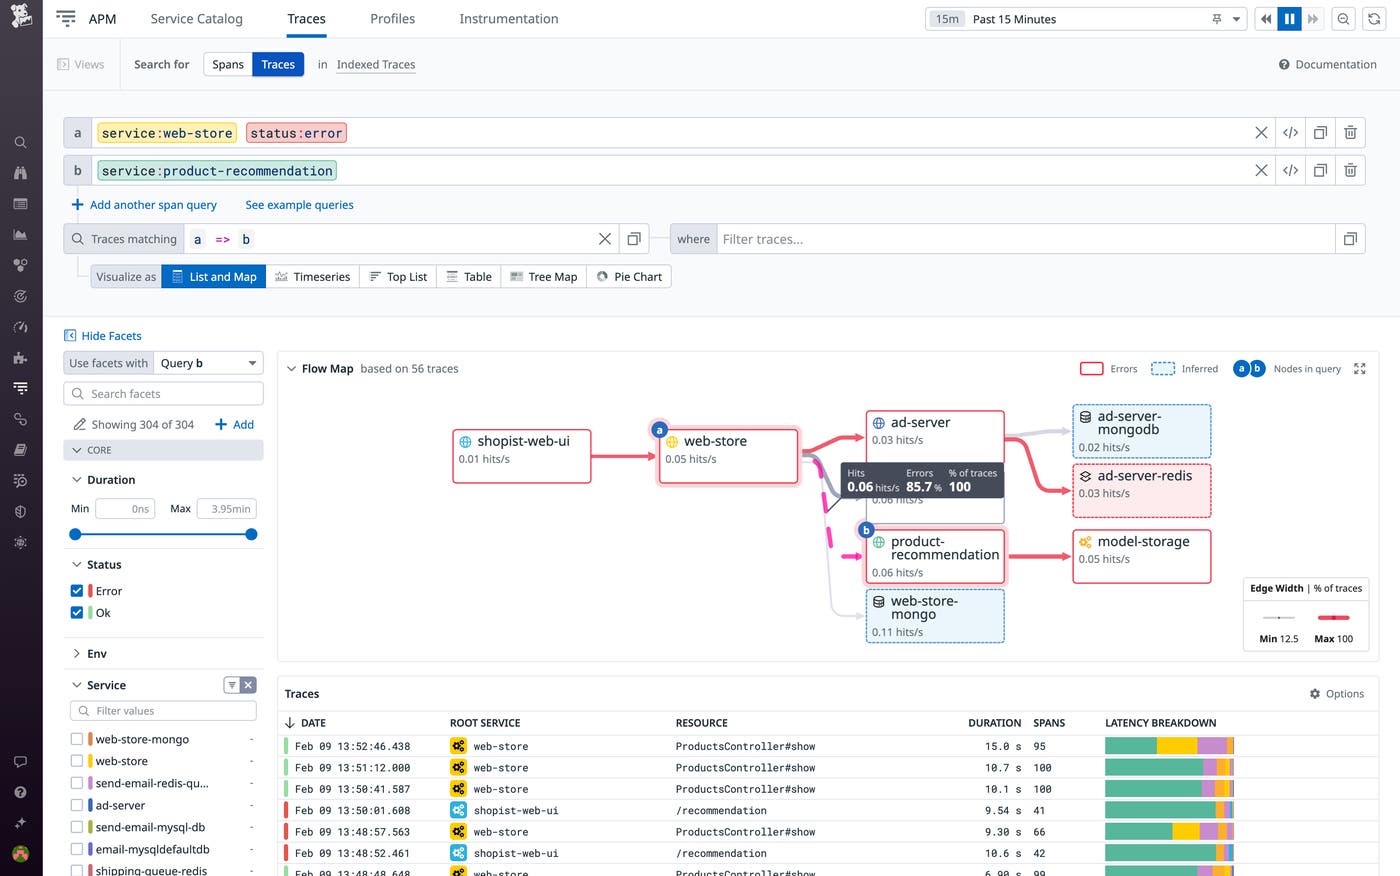
Let’s say you notice an elevated error rate in a service with numerous upstream and downstream dependencies, like the web-store service in the screenshot above. To determine the root cause, you navigate to the Trace Explorer and create a trace query. You can isolate all potential culprits for the elevated error rate by querying all traces that include an error in web-store and highlighting every component called in those traces’ request paths. To do so, you use the service:web-store and status:error properties for one of the span queries comprising your trace query. By assigning the wildcard operator (*) to another span query and then composing a trace query using the child operator (=>), you surface all traces flowing through web-store with an error to any direct downstream dependency. The product-recommendation service plays a critical role in total business sales and revenue, and you notice it’s highlighted as a downstream dependency of the web-store service. You refine the trace query to surface all traces flowing through web-store with an error, and then through the product-recommendation service. By doing so, you’re able to zero in on the root cause of these errors: when calling the third-party model-storage API, the product-recommendation service is erroring out in 100 percent of the cases where the web-store service is erroring out.
Measure end-to-end latency and other trace-level attributes
Traces let you analyze latency by breaking down the duration of every service call by your application. But except with fully synchronous requests in which the root span encompasses the entire trace, measuring the overall latency of a request—and not just the duration of each of its individual spans—has been difficult. This poses particular problems in event-driven architectures with asynchronous requests and messaging (often handled by technologies like Kafka and RabbitMQ).
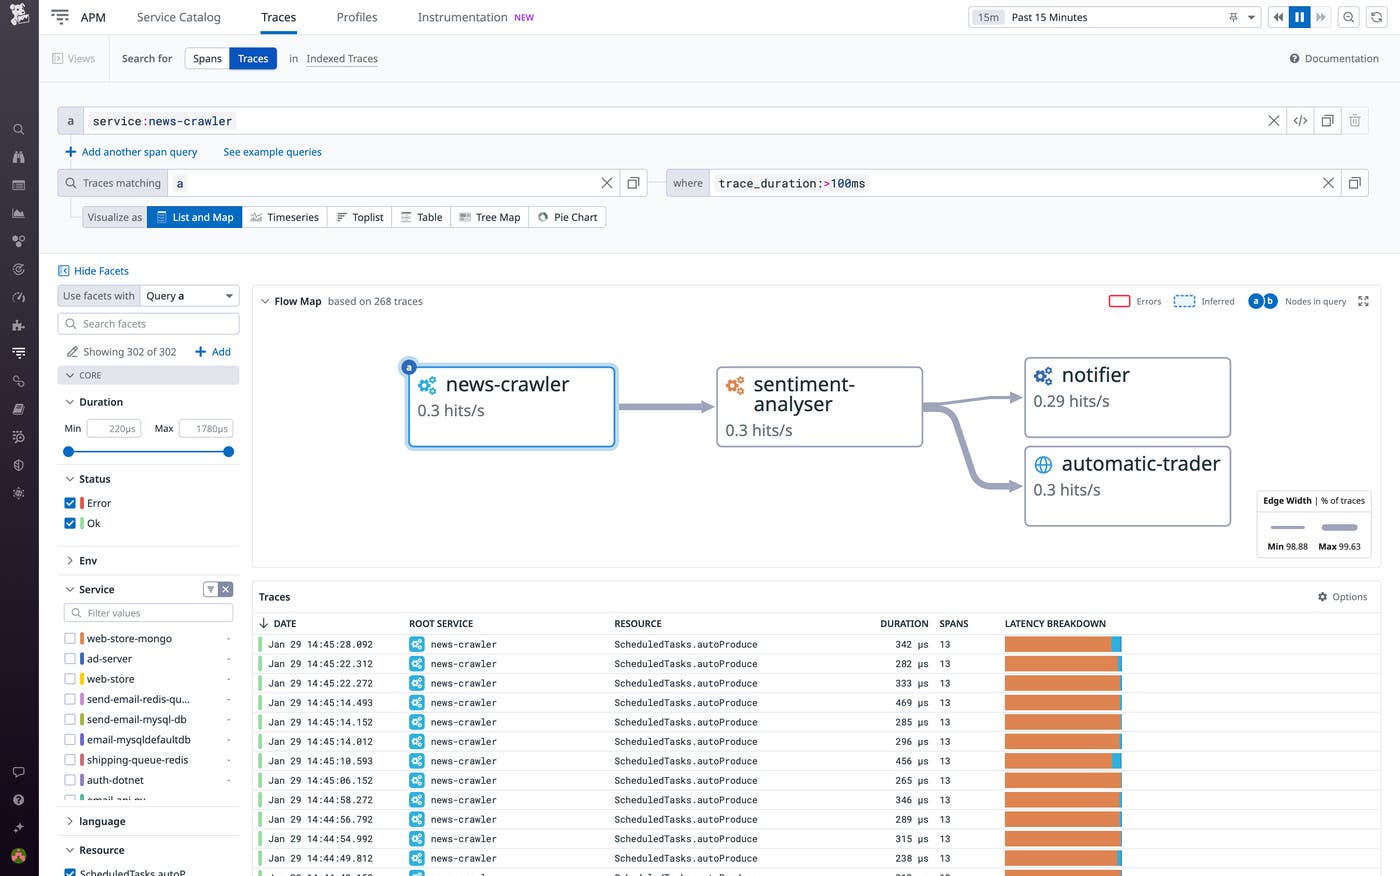
With Trace Queries, you can quickly measure the end-to-end duration of any trace and query accordingly. You can query your traces by specifying one or more endpoints and group the results by average end-to-end trace duration. The screenshot below illustrates a query that gauges the average overall duration of traces from a sentiment analysis service, from crawling news articles to delivering the results of the analysis in a notification. By visualizing the results in a timeseries graph, you can easily assess the fluctuation of the metric over time.
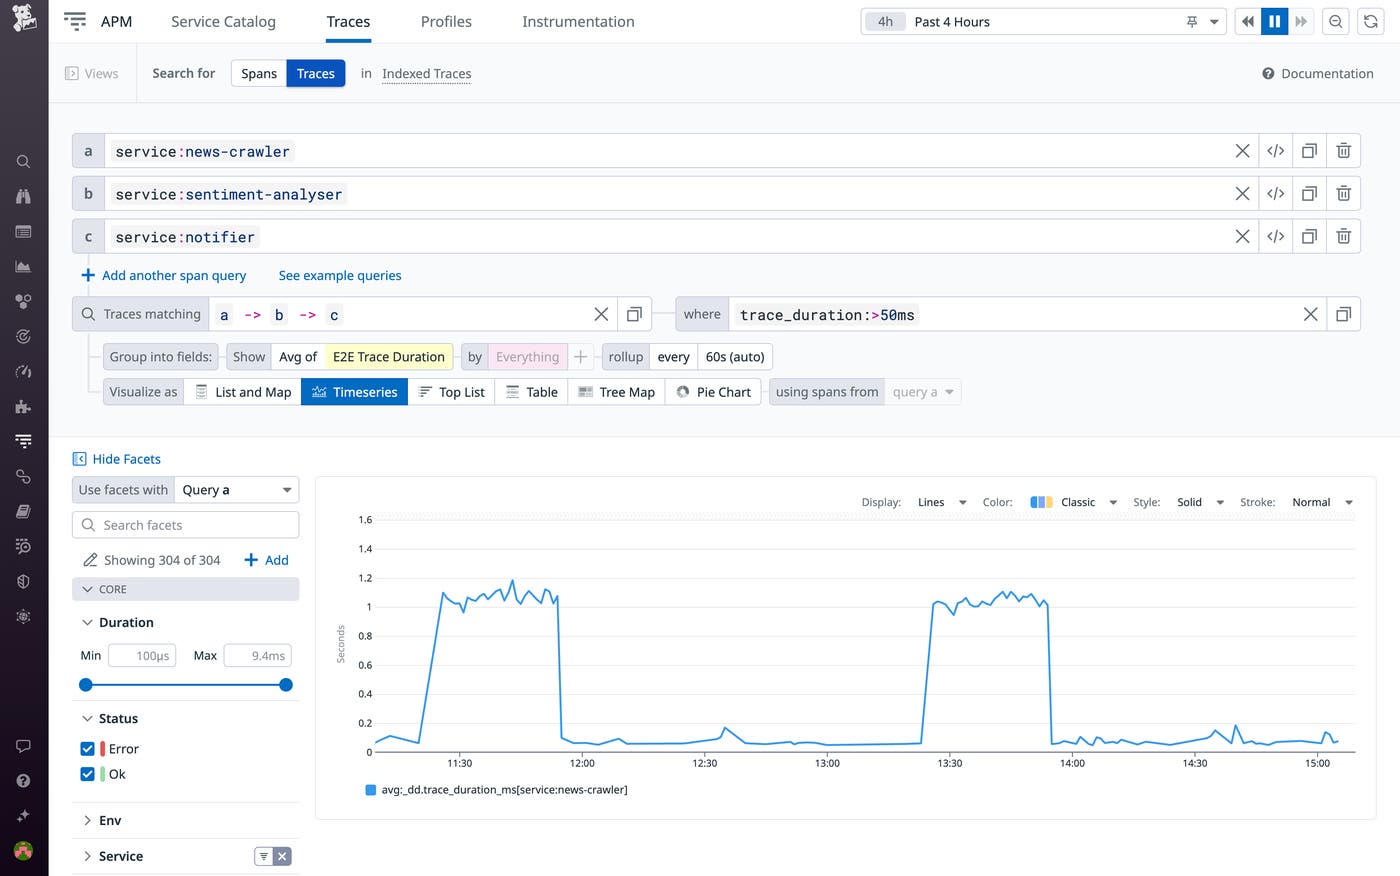
Filtering by trace duration also enables you to identify slow requests flowing through particular services separated by message queues, for example.
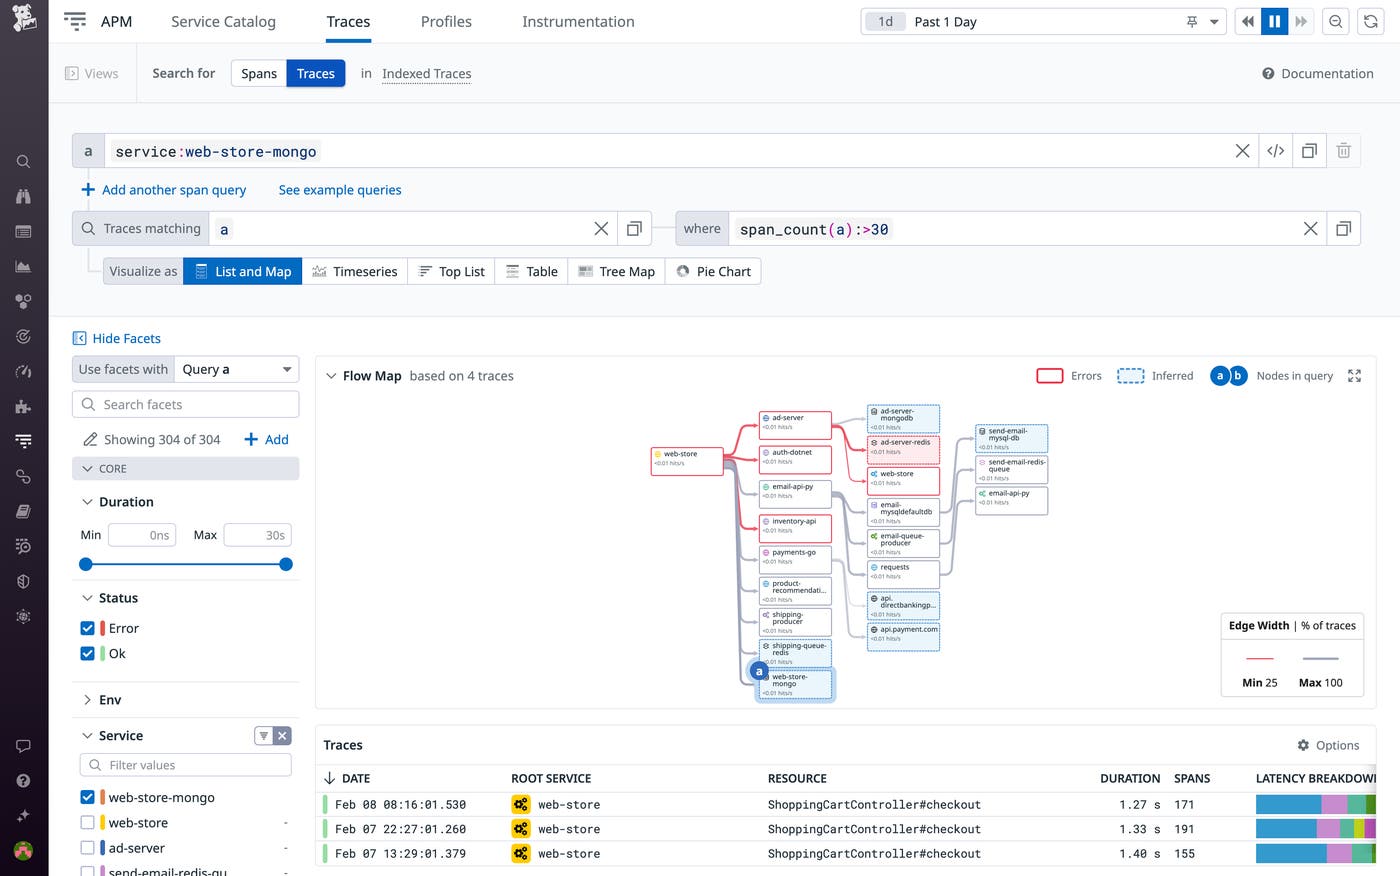
Trace Queries can also help you zero in on the root causes of high latency. For example, by filtering traces by span count and isolating those with an unusually high number of spans, you can identify symptoms of the n+1 problem, in which requests get bogged down in erroneously looping database calls.
Track the business impact of application performance
Translating the performance of individual microservices into clear business-level performance insights requires analyzing dependencies and drawing correlations using dispersed data. Trace Queries helps you cut through this complexity and go beyond the piecemeal insights offered by monitoring individual microservices. Using Trace Queries, you can flexibly analyze the performance of any subset of your infrastructure, enabling SREs and other engineers to fine-tune their monitoring to their business interests, KPIs, and the business-level impact of performance issues.
Let’s say you want to track how often there is any deviation from expected functionality when a customer clicks the “checkout” button in the shopping cart of your ecommerce application. With Trace Queries, you can query all application requests that 1) hit the checkout endpoint, 2) flow through a downstream payments service with an error status, and 3) make a call to your payments API.
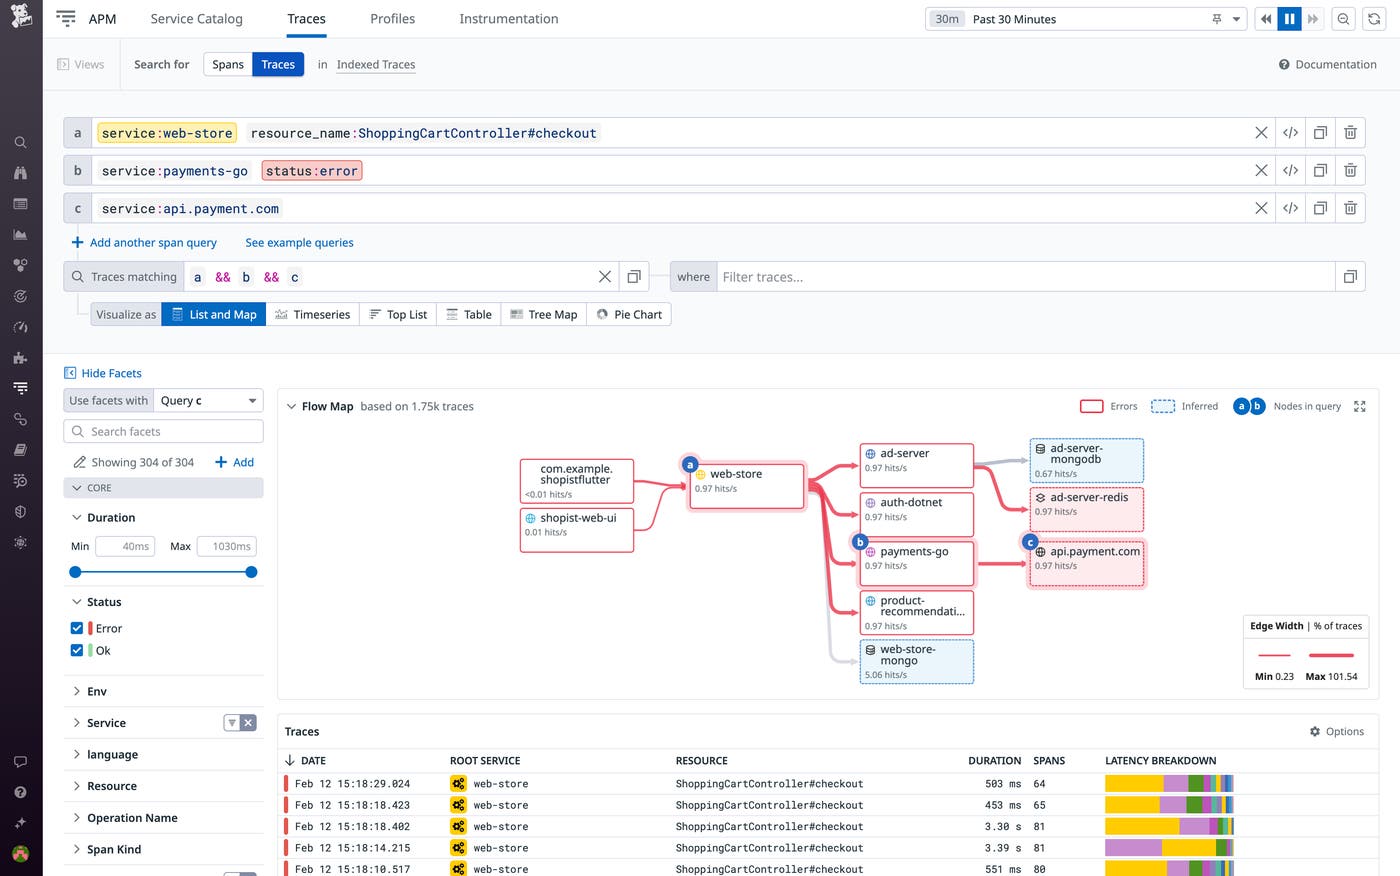
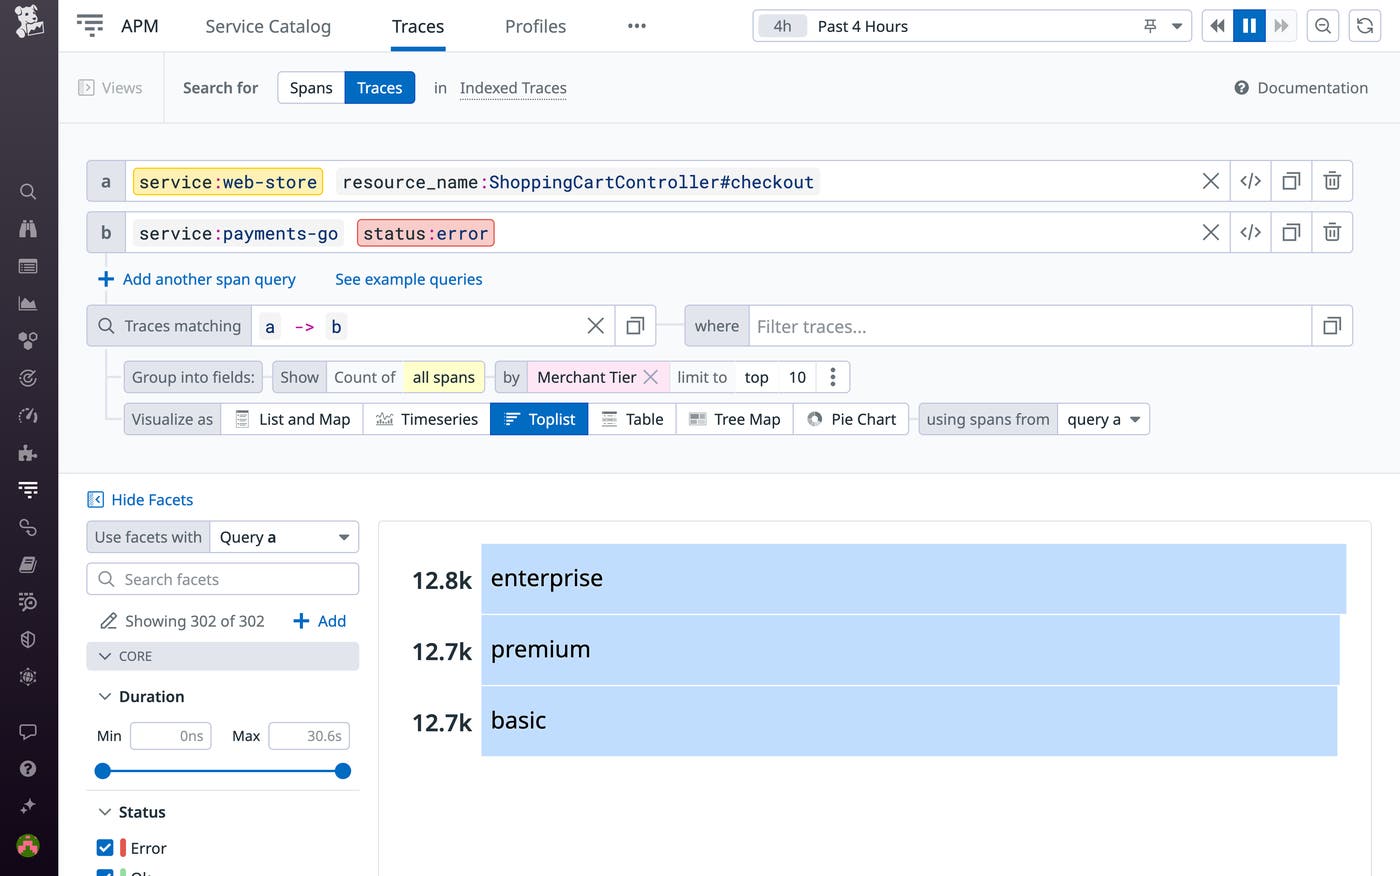
From here, Trace Queries enables you to analyze the impact of these errors in a variety of ways. For example, you can find which end users are affected by an error in order to determine the footprint of the resulting performance issue. The following screenshot shows a trace query that groups erroring requests to the payments-go service by the number of affected customers per tier (enterprise, premium, and basic).
To analyze the impact of these errors from another angle, you can look at the affected endpoints in your application. The screenshot below illustrates a query that yields the application endpoints affected by an error in a payment-processing pipeline. The query surfaces the traces in which a request from the web-store service triggers an error status in the downstream payments-go service. Grouping the results by HTTP Path Group and displaying them in a top list shows you the endpoints in the order of their error rate.
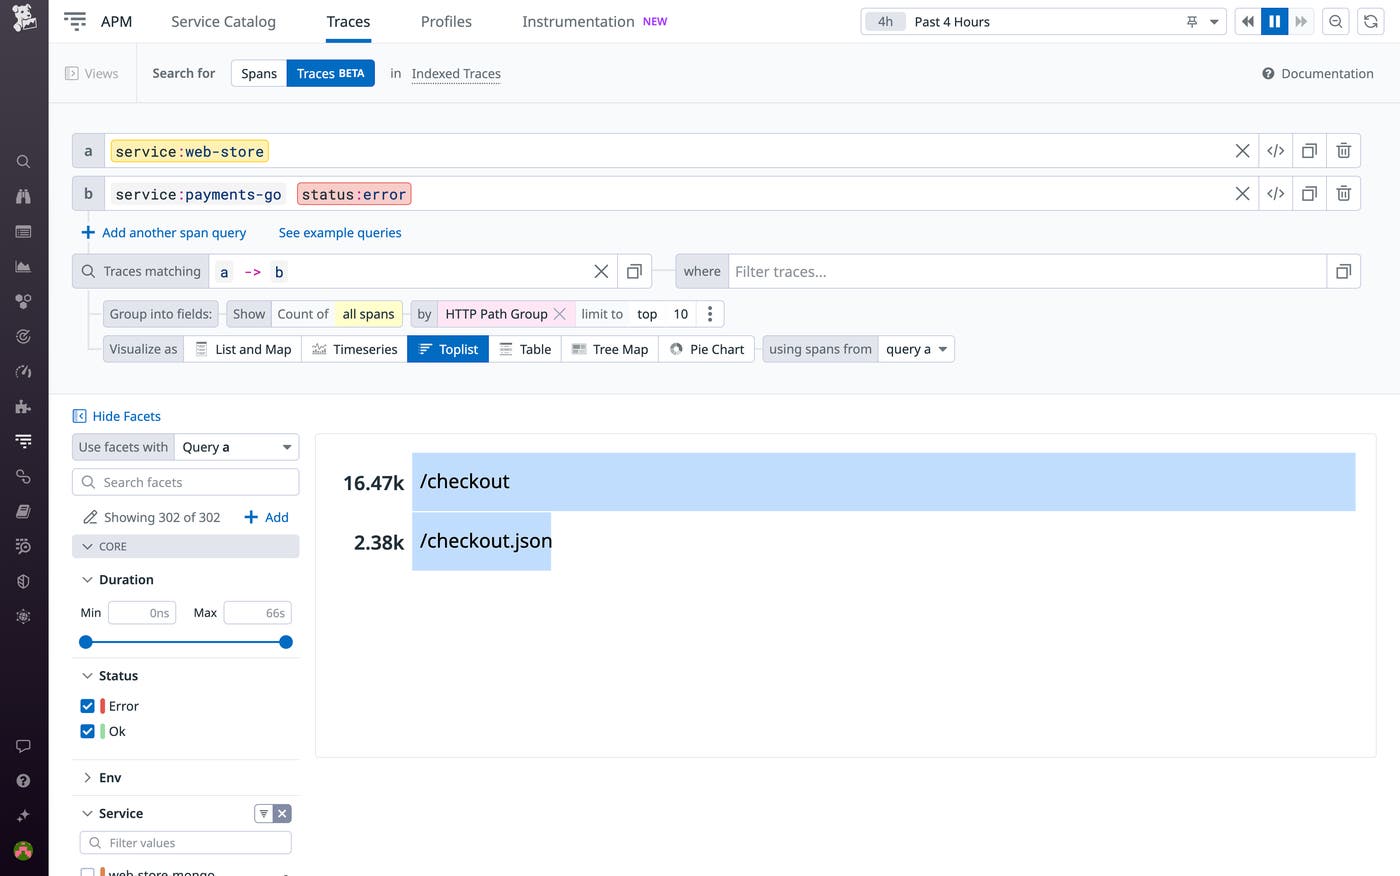
By enabling you to quickly analyze the impact of performance issues, Trace Queries helps you determine how to prioritize these issues and where to focus your optimization efforts.
Put application performance data in context
With Trace Queries, you can get to the root of errors, determine the end-to-end impact of performance issues to prioritize your troubleshooting, and translate isolated data on microservices into business-level performance insights. Trace Queries enables you to dedicate more time to your KPIs and less time correlating siloed data points and parsing the intricacies of your distributed infrastructure.
Datadog APM users can get started with Trace Queries today. If you’re new to Datadog, you can sign up for a 14-day free trial.
