Abhinav Vedmala
AWS Step Functions offers the Distributed Map state, enabling you to coordinate massively parallel workloads within your serverless applications. With this feature, a single Step Functions execution can fan out into up to 10,000 parallel workflows simultaneously, making it possible to efficiently process millions of items in parallel.
This capability unlocks new possibilities for large-scale data processing, such as image transformation, log ingestion, or batch analytics. However, this scale presents new observability challenges: How can you track the progress and performance of thousands of concurrent executions? How do you quickly identify errors or bottlenecks in such a distributed system?
Now, you can visualize Distributed Map executions, key metrics, end-to-end traces across parent and child workflows, and full parallelized serverless processes with Datadog. In this post, we’ll walk through a real-world use case for distributed image processing that uses a Distributed Map in Step Functions and show how Datadog helps monitor and troubleshoot these complex workflows.
Set up and instrument a Distributed Map
To get started, ensure you’re using a Standard workflow type in AWS Step Functions, as Distributed Maps are not supported in Express workflows.
In the visual workflow editor:
- Drag and drop a Map component into your workflow.
- In the configuration pane, set the processing mode to Distributed.
- For item source, choose Amazon S3 and specify the bucket that should be used as input.
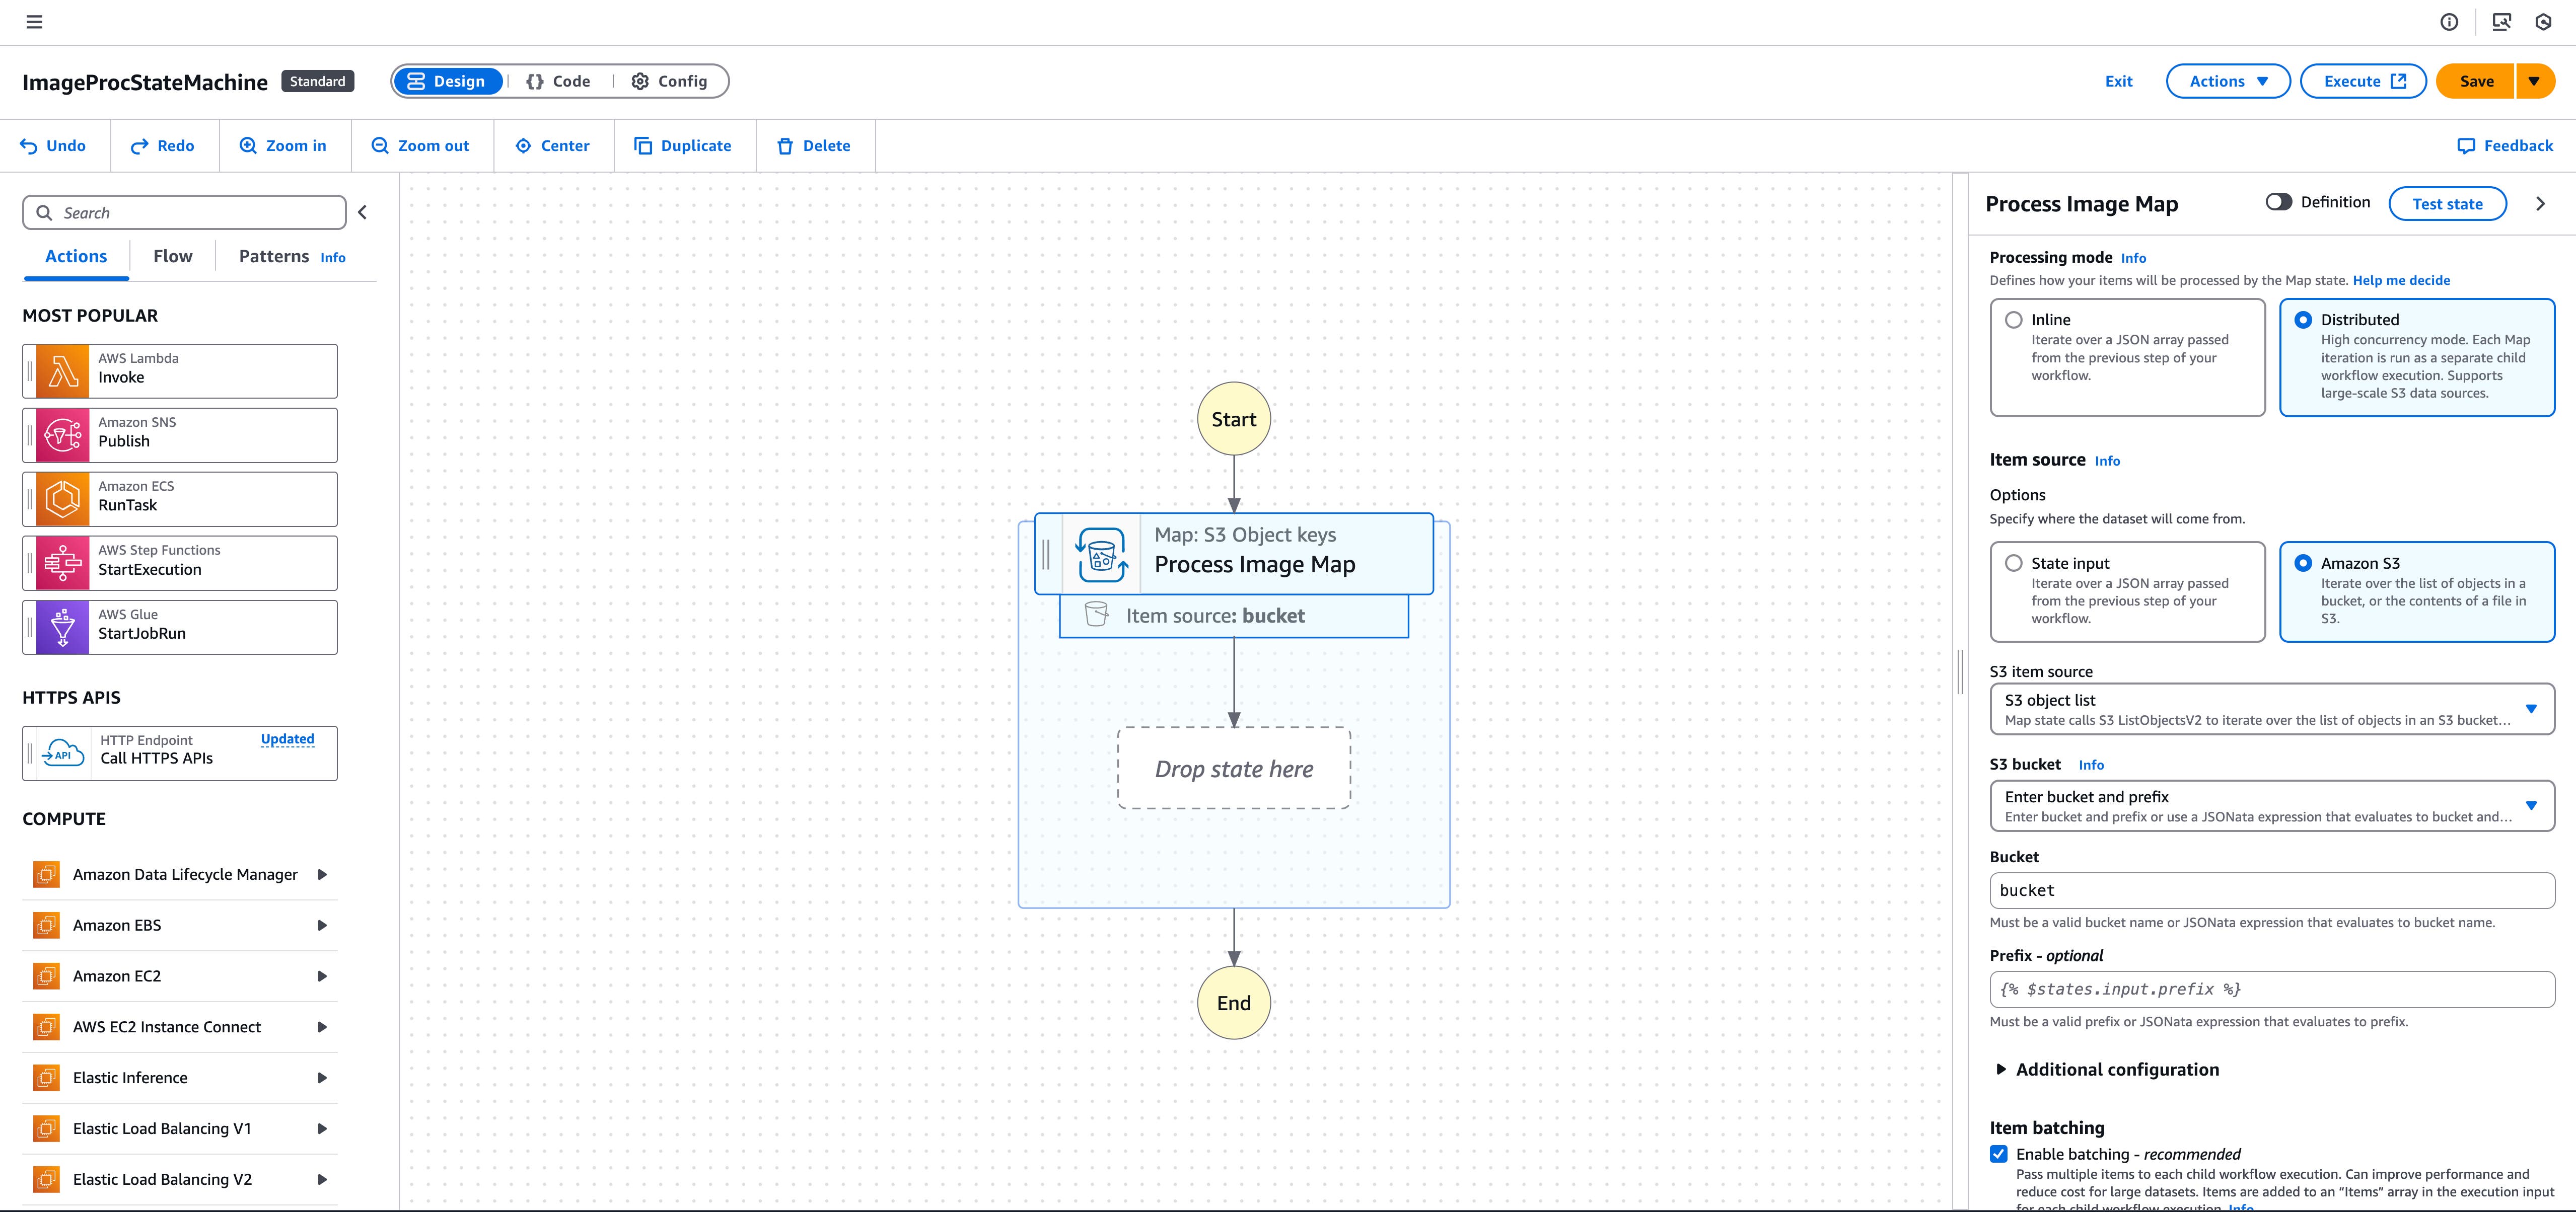
Each item in the specified S3 bucket will be passed into the Distributed Map. In our example, we’re invoking an AWS Lambda function, ProcessImageLambda, for each object. This function reads the image, attaches a watermark, and writes the result back to S3.
To instrument your Distributed Map workflows in Datadog, start by ensuring that tracing is enabled for your Step Functions. You can follow our installation guide for detailed setup.
To ensure that your child workflows are linked to the parent and that the downstream Lambda trace is also linked, we must follow both of these setup instructions:
- Set up Distributed Map trace merging, which allows Datadog to capture and visualize parent-child workflow relationships.
- Merge Step Functions and Lambda traces, which ensures that traces from child workflows and the Lambda functions they invoke are all part of the same trace.
The complex JSONata expression below is essentially a nested if-else statement to propagate trace context once the final State Machine definition setup is complete.
{ "StartAt": "Process Image Map", "States": { "Process Image Map": { "Type": "Map", "ItemProcessor": { "ProcessorConfig": { "Mode": "DISTRIBUTED", "ExecutionType": "STANDARD" }, "StartAt": "Lambda Invoke", "States": { "Lambda Invoke": { "Type": "Task", "Resource": "arn:aws:states:::lambda:invoke", "Output": "{% $states.result.Payload %}", "Arguments": { "FunctionName": "FUNCTION_NAME", "Payload": "{% ($execInput := $exists($states.context.Execution.Input.BatchInput) ? $states.context.Execution.Input.BatchInput : $states.context.Execution.Input; $hasDatadogTraceId := $exists($execInput._datadog.`x-datadog-trace-id`); $hasDatadogRootExecutionId := $exists($execInput._datadog.RootExecutionId); $ddTraceContext := $hasDatadogTraceId ? {'x-datadog-trace-id': $execInput._datadog.`x-datadog-trace-id`, 'x-datadog-tags': $execInput._datadog.`x-datadog-tags`} : {'RootExecutionId': $hasDatadogRootExecutionId ? $execInput._datadog.RootExecutionId : $states.context.Execution.Id}; $sfnContext := $merge([$states.context, {'Execution': $sift($states.context.Execution, function($v, $k) { $k != 'Input' })}]); $merge([$states.input, {'_datadog': $merge([$sfnContext, $ddTraceContext, {'serverless-version': 'v1'}])}])) %}" }, "End": true } } }, "End": true, "Label": "ProcessImageMap", "MaxConcurrency": 1000, "ItemReader": { "Resource": "arn:aws:states:::s3:listObjectsV2", "Arguments": { "Bucket": "BUCKET_NAME", "Prefix": "PREFIX" } }, "ItemBatcher": { "MaxItemsPerBatch": 1, "BatchInput": { "_datadog": "{% ($execInput := $states.context.Execution.Input; $hasDatadogTraceId := $exists($execInput._datadog.`x-datadog-trace-id`); $hasDatadogRootExecutionId := $exists($execInput._datadog.RootExecutionId); $ddTraceContext := $hasDatadogTraceId ? {'x-datadog-trace-id': $execInput._datadog.`x-datadog-trace-id`, 'x-datadog-tags': $execInput._datadog.`x-datadog-tags`} : {'RootExecutionId': $hasDatadogRootExecutionId ? $execInput._datadog.RootExecutionId : $states.context.Execution.Id}; $merge([$ddTraceContext, {'serverless-version': 'v1', 'timestamp': $millis()}])) %}" } } } }, "QueryLanguage": "JSONata"}Observe Distributed Map executions
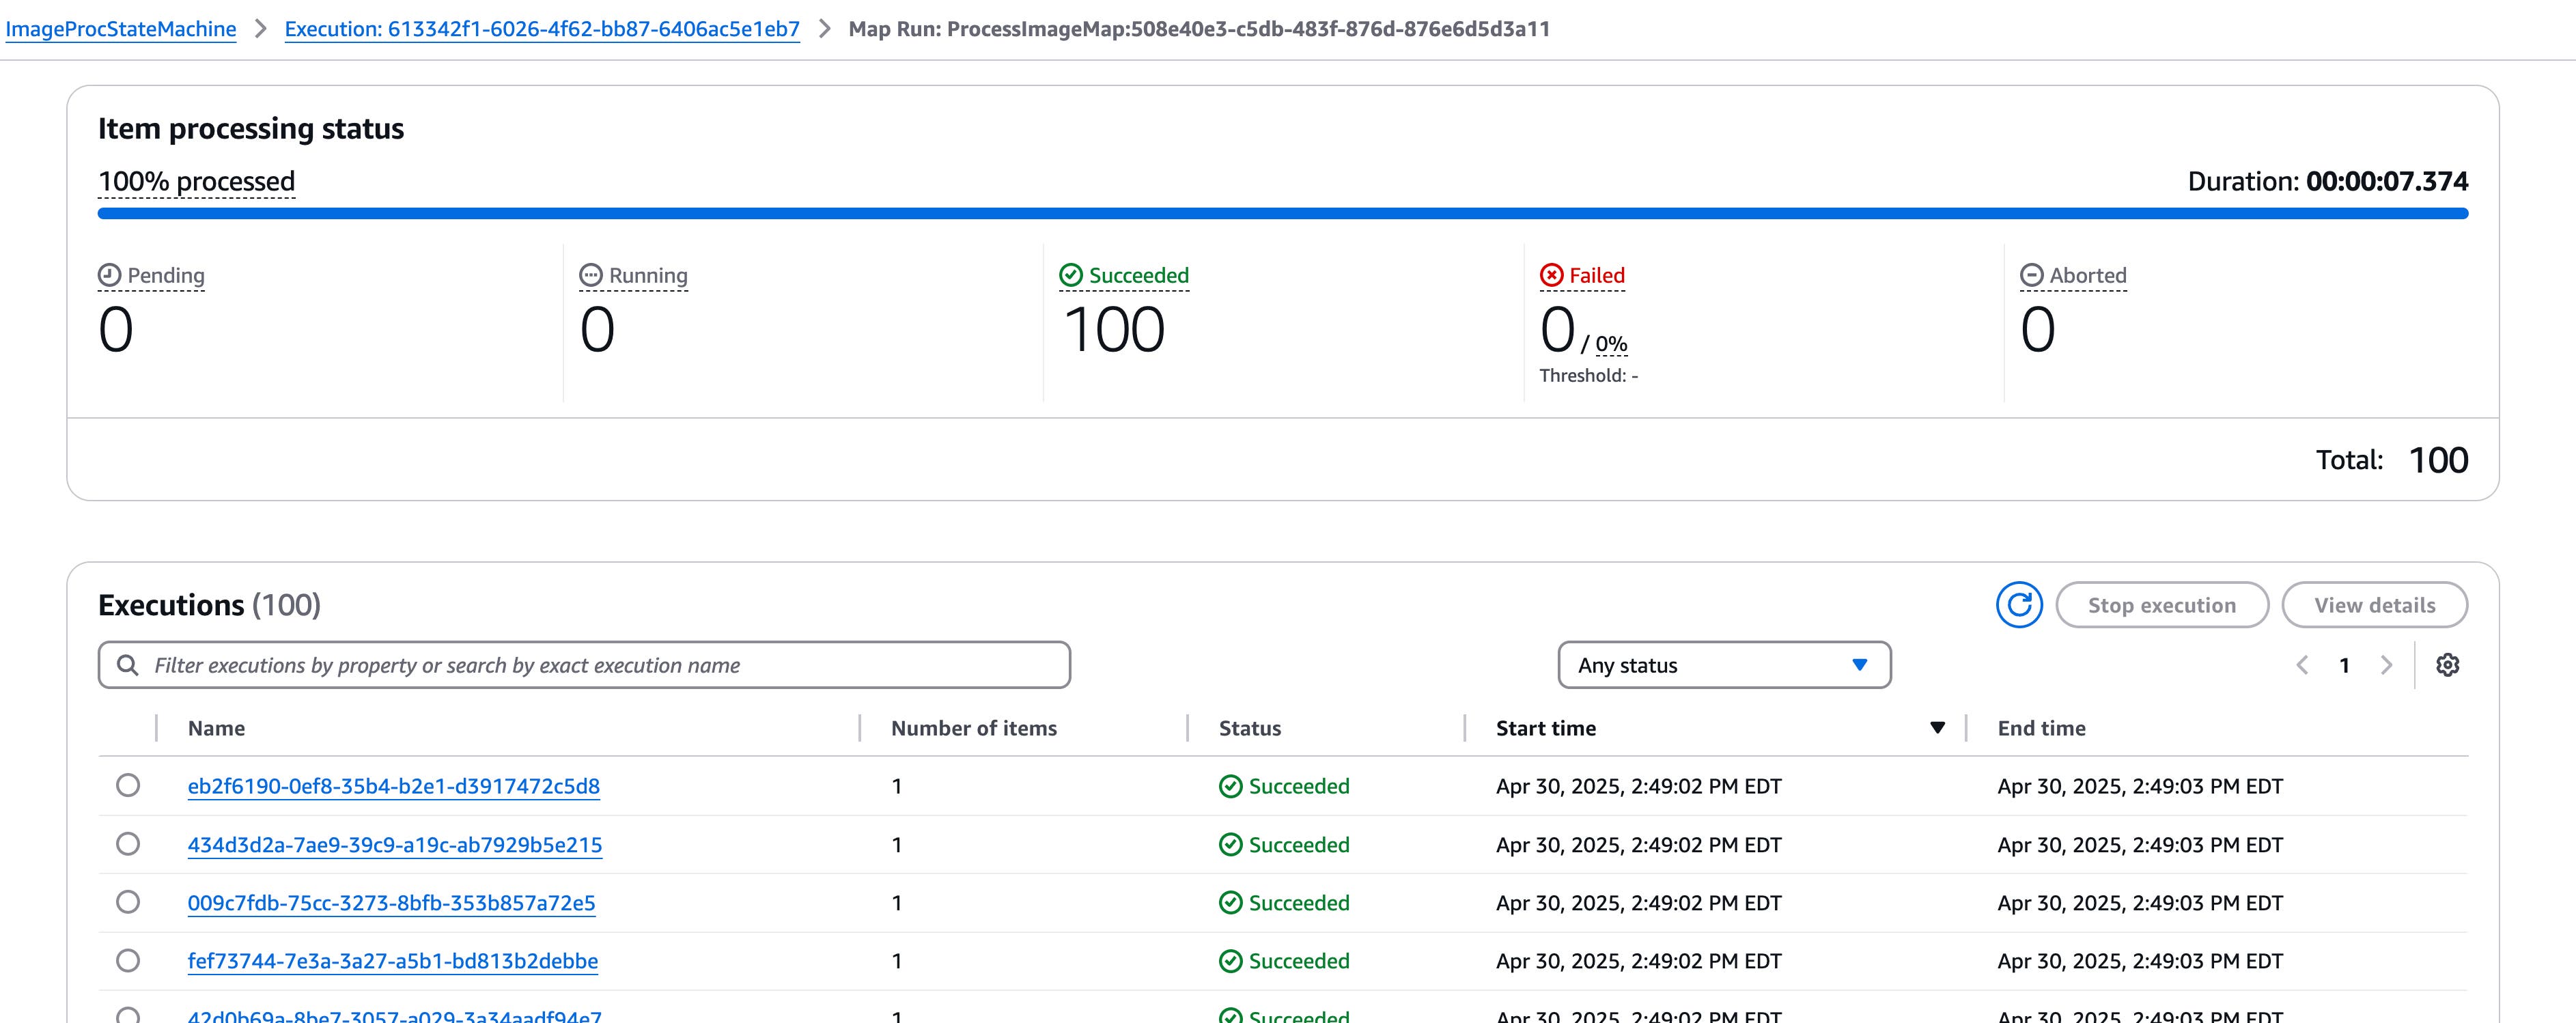
The AWS Console provides a Map Run view where you can see an overview of each child execution triggered by a Distributed Map. While this is useful for simple workflows, it can be limiting at scale; you need to click into each child execution individually to understand what happened.
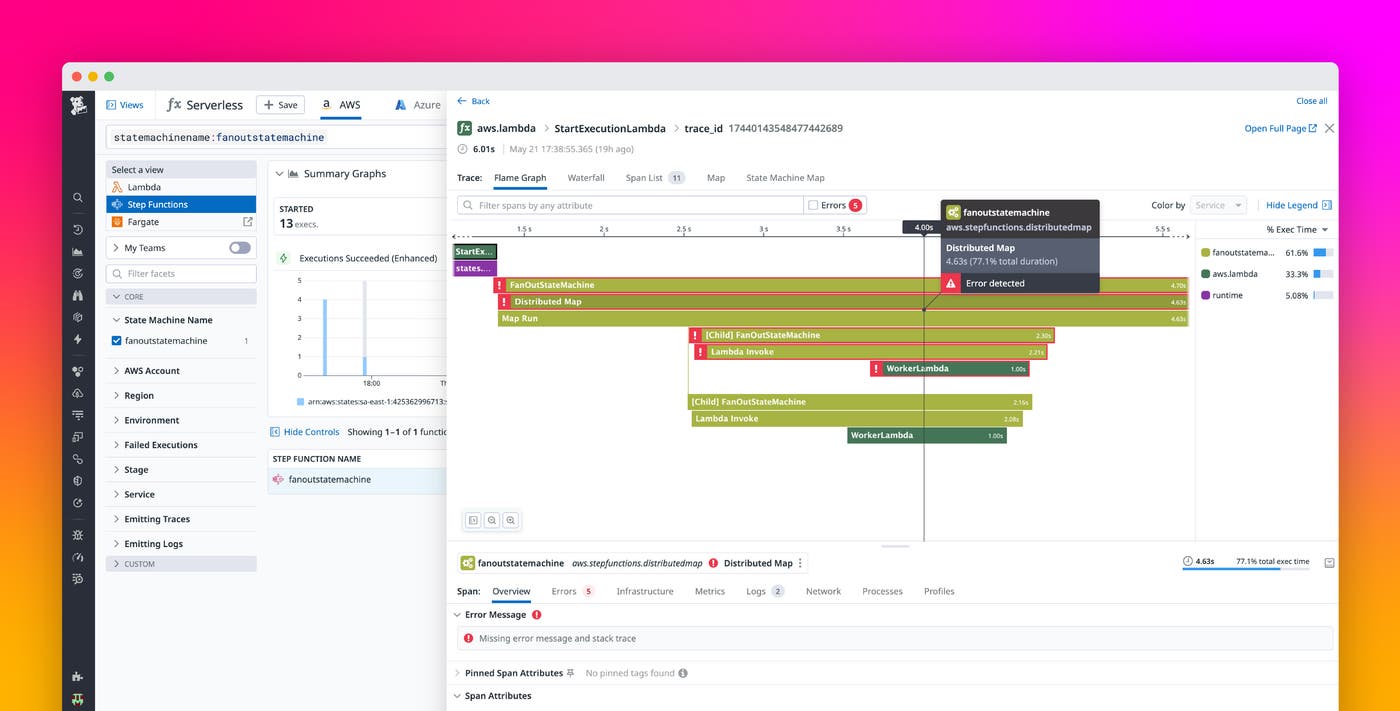
Datadog tracing for Step Functions provides a single-pane view of all your workflow activity, including:
- The parent Step Functions workflow
- All child workflows launched by the Distributed Map
- Any Lambda functions invoked within those children
Each span in the trace includes rich context, such as input and output payloads, execution duration, and error information, so you can quickly understand what data was processed, where it flowed, and where things may have gone wrong. Because ProcessImageLambda is instrumented with the Datadog Lambda Extension, calls to external services like Amazon S3 also show up as spans.
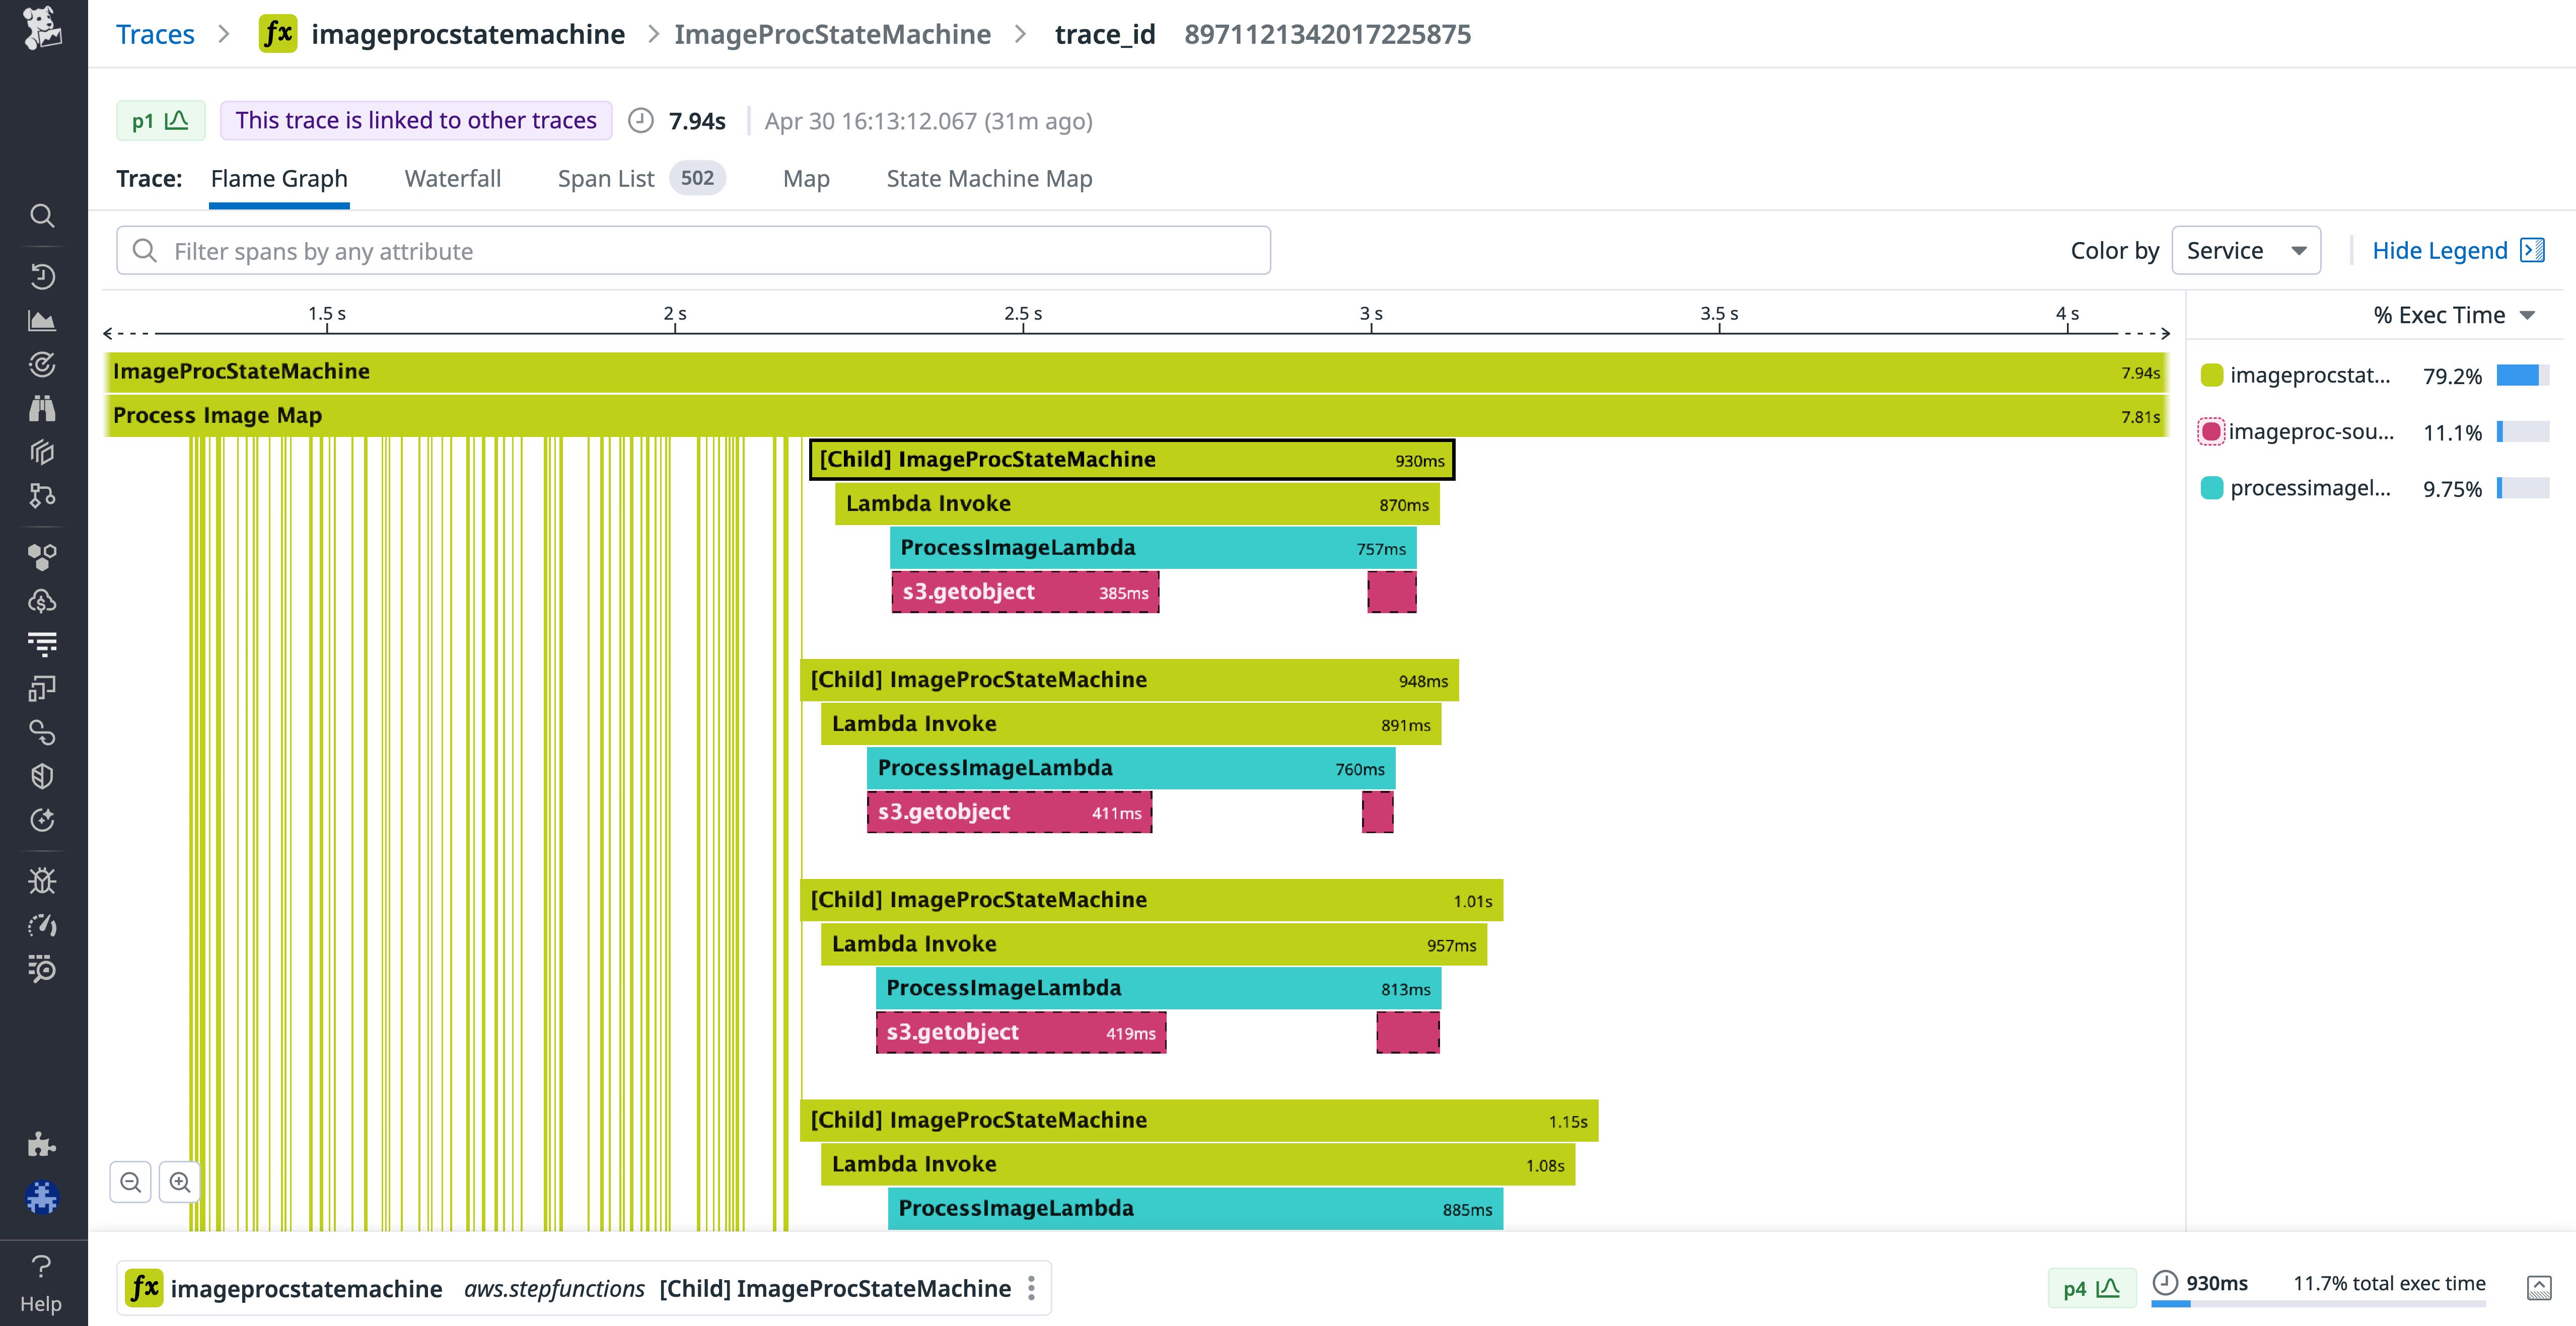
If the default Flame Graph view is too granular for large fan-outs, the Waterfall view provides a cleaner summary. It groups child executions into a more digestible timeline, making it easier to spot patterns and anomalies across parallel tasks.
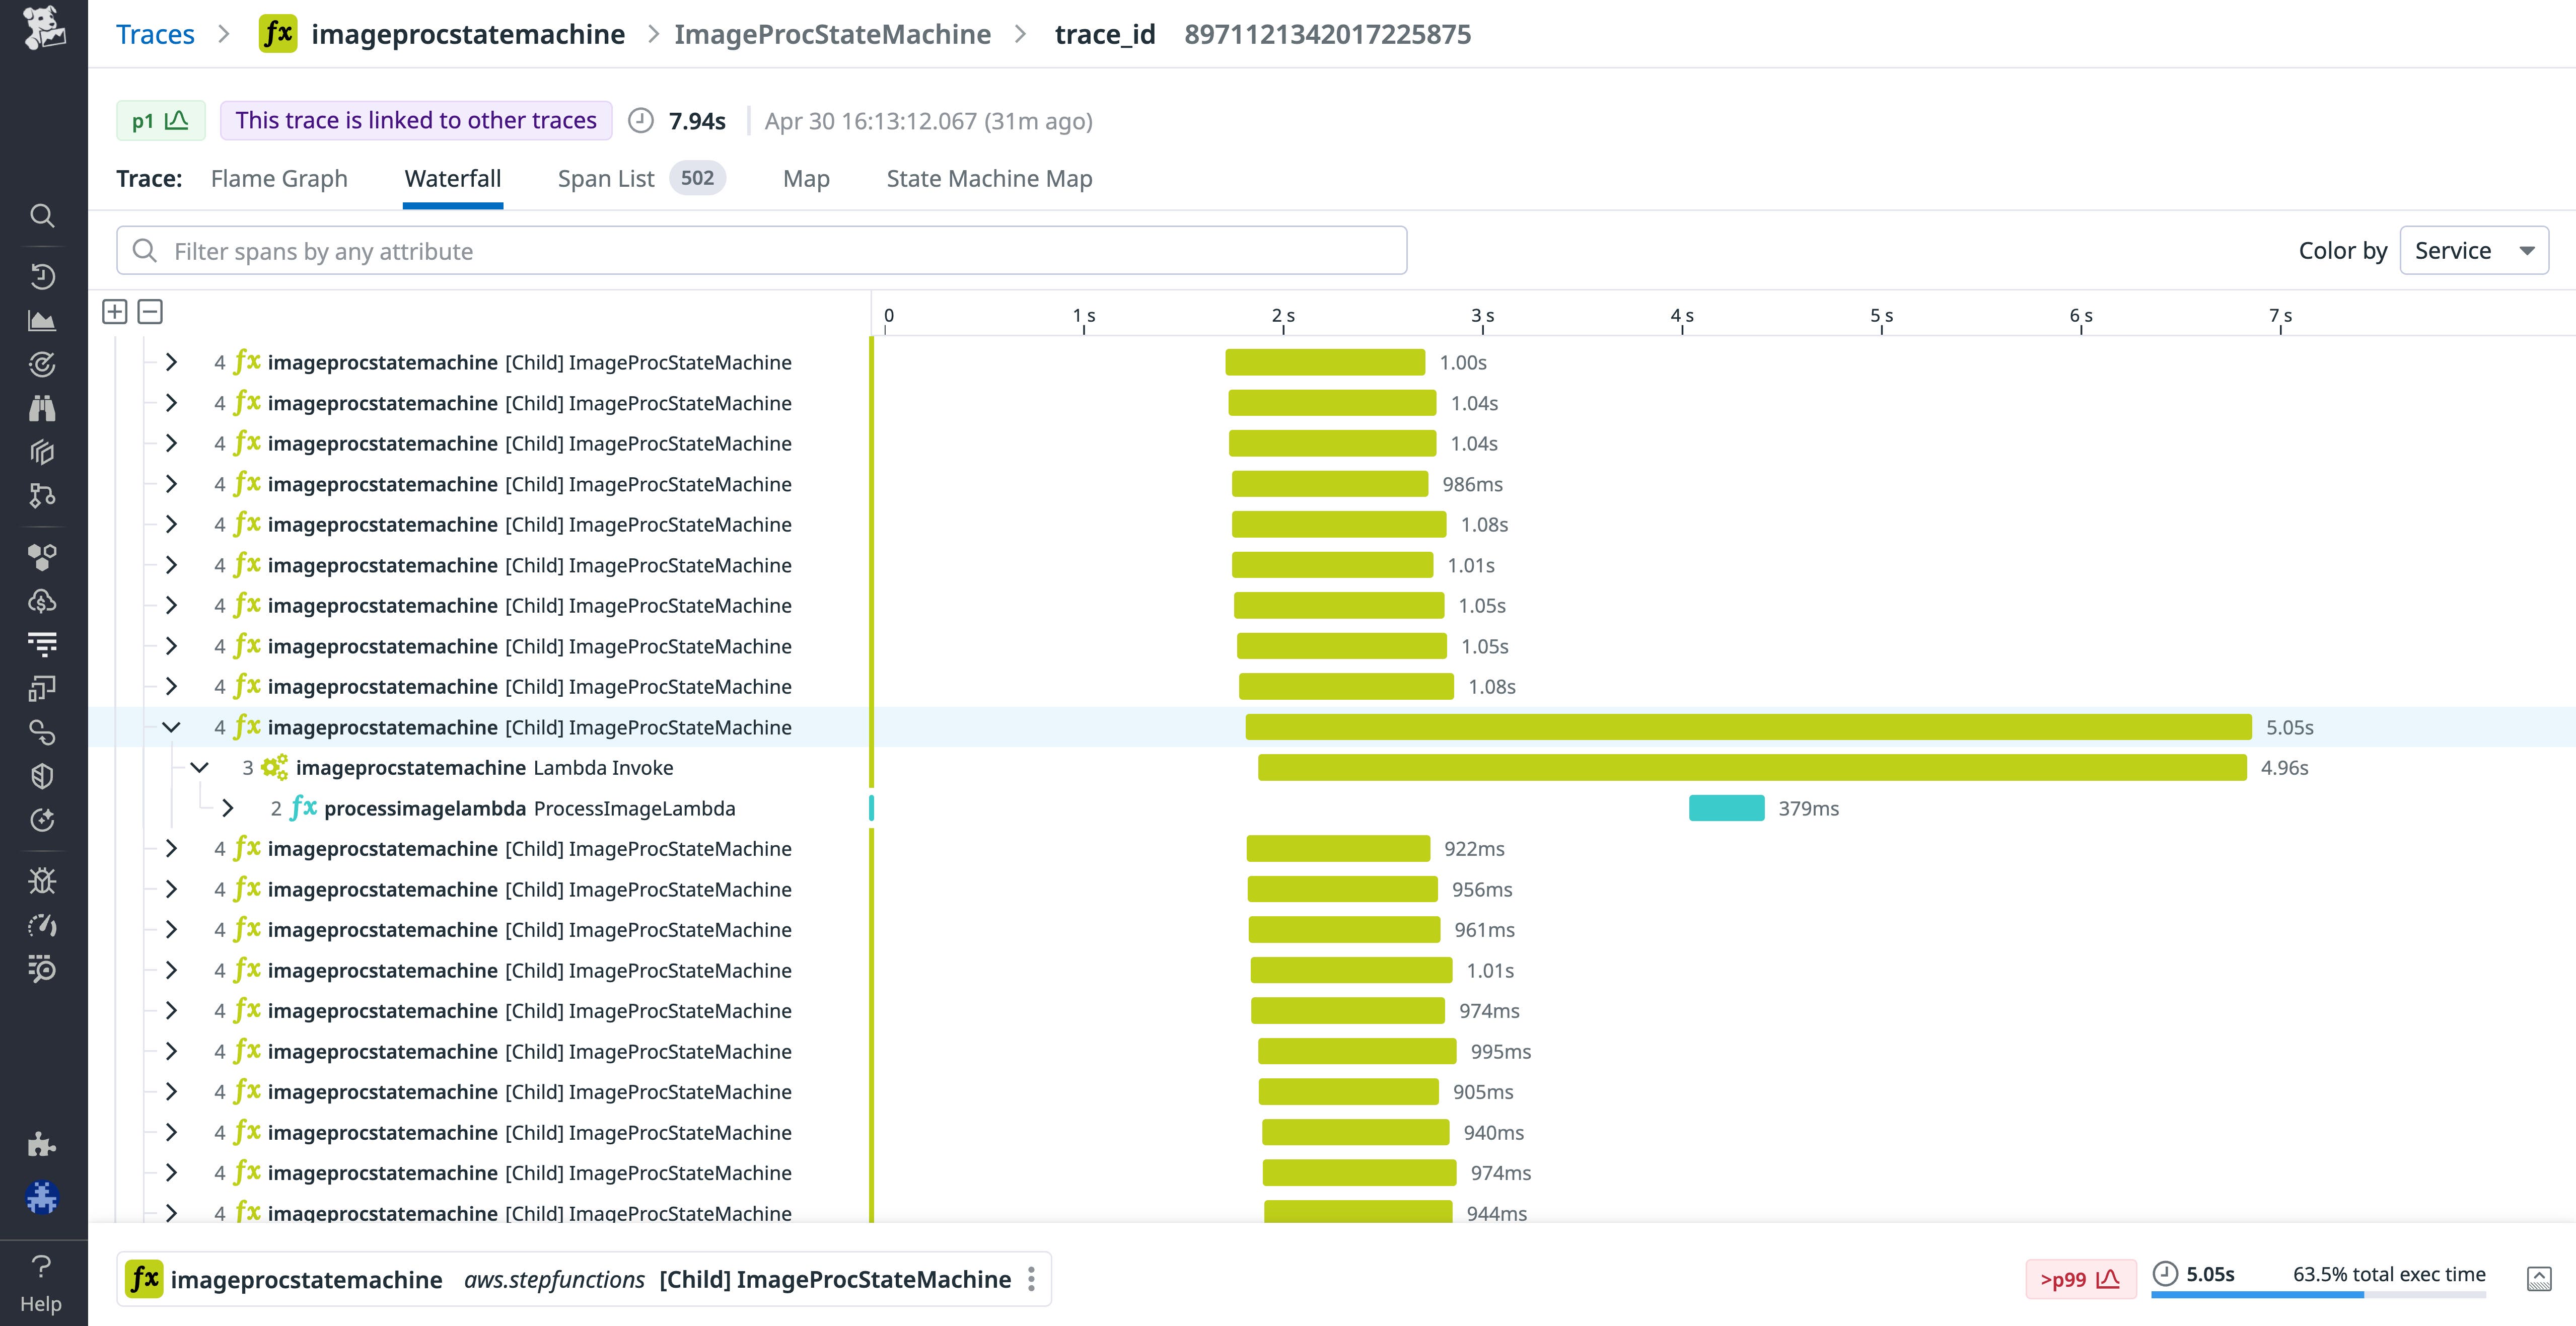
This level of visibility reduces mean time to resolution (MTTR) by helping you understand the execution path of every item processed by the Distributed Map, identify long-tail latencies across child executions, and investigate failures without combing through thousands of Amazon CloudWatch logs.
By surfacing both the high-level summary and the deep execution details in one place, Datadog makes it easy to operate even the most complex Step Functions workloads.
As expected with large fan-outs, this feature can generate a significant number of spans. If you’re interested in an intelligent sampling mechanism, let us know through the feedback form linked at the end of this post.
Troubleshoot Distributed Map executions in Datadog
Distributed Maps enable powerful fan-out behavior by spawning thousands of child executions from a single parent workflow. But this scale can also make it difficult to interpret metrics, especially when parent and child workflows are aggregated together.
For example, if you’re measuring state-level duration (aws.states.enhanced.state.duration), the results may be skewed or misleading due to the volume of child executions.
To help you break down this complexity, Datadog automatically tags Step Functions metrics with is_distributed_map_child, which distinguishes whether a given execution is part of a Distributed Map child workflow or the parent.
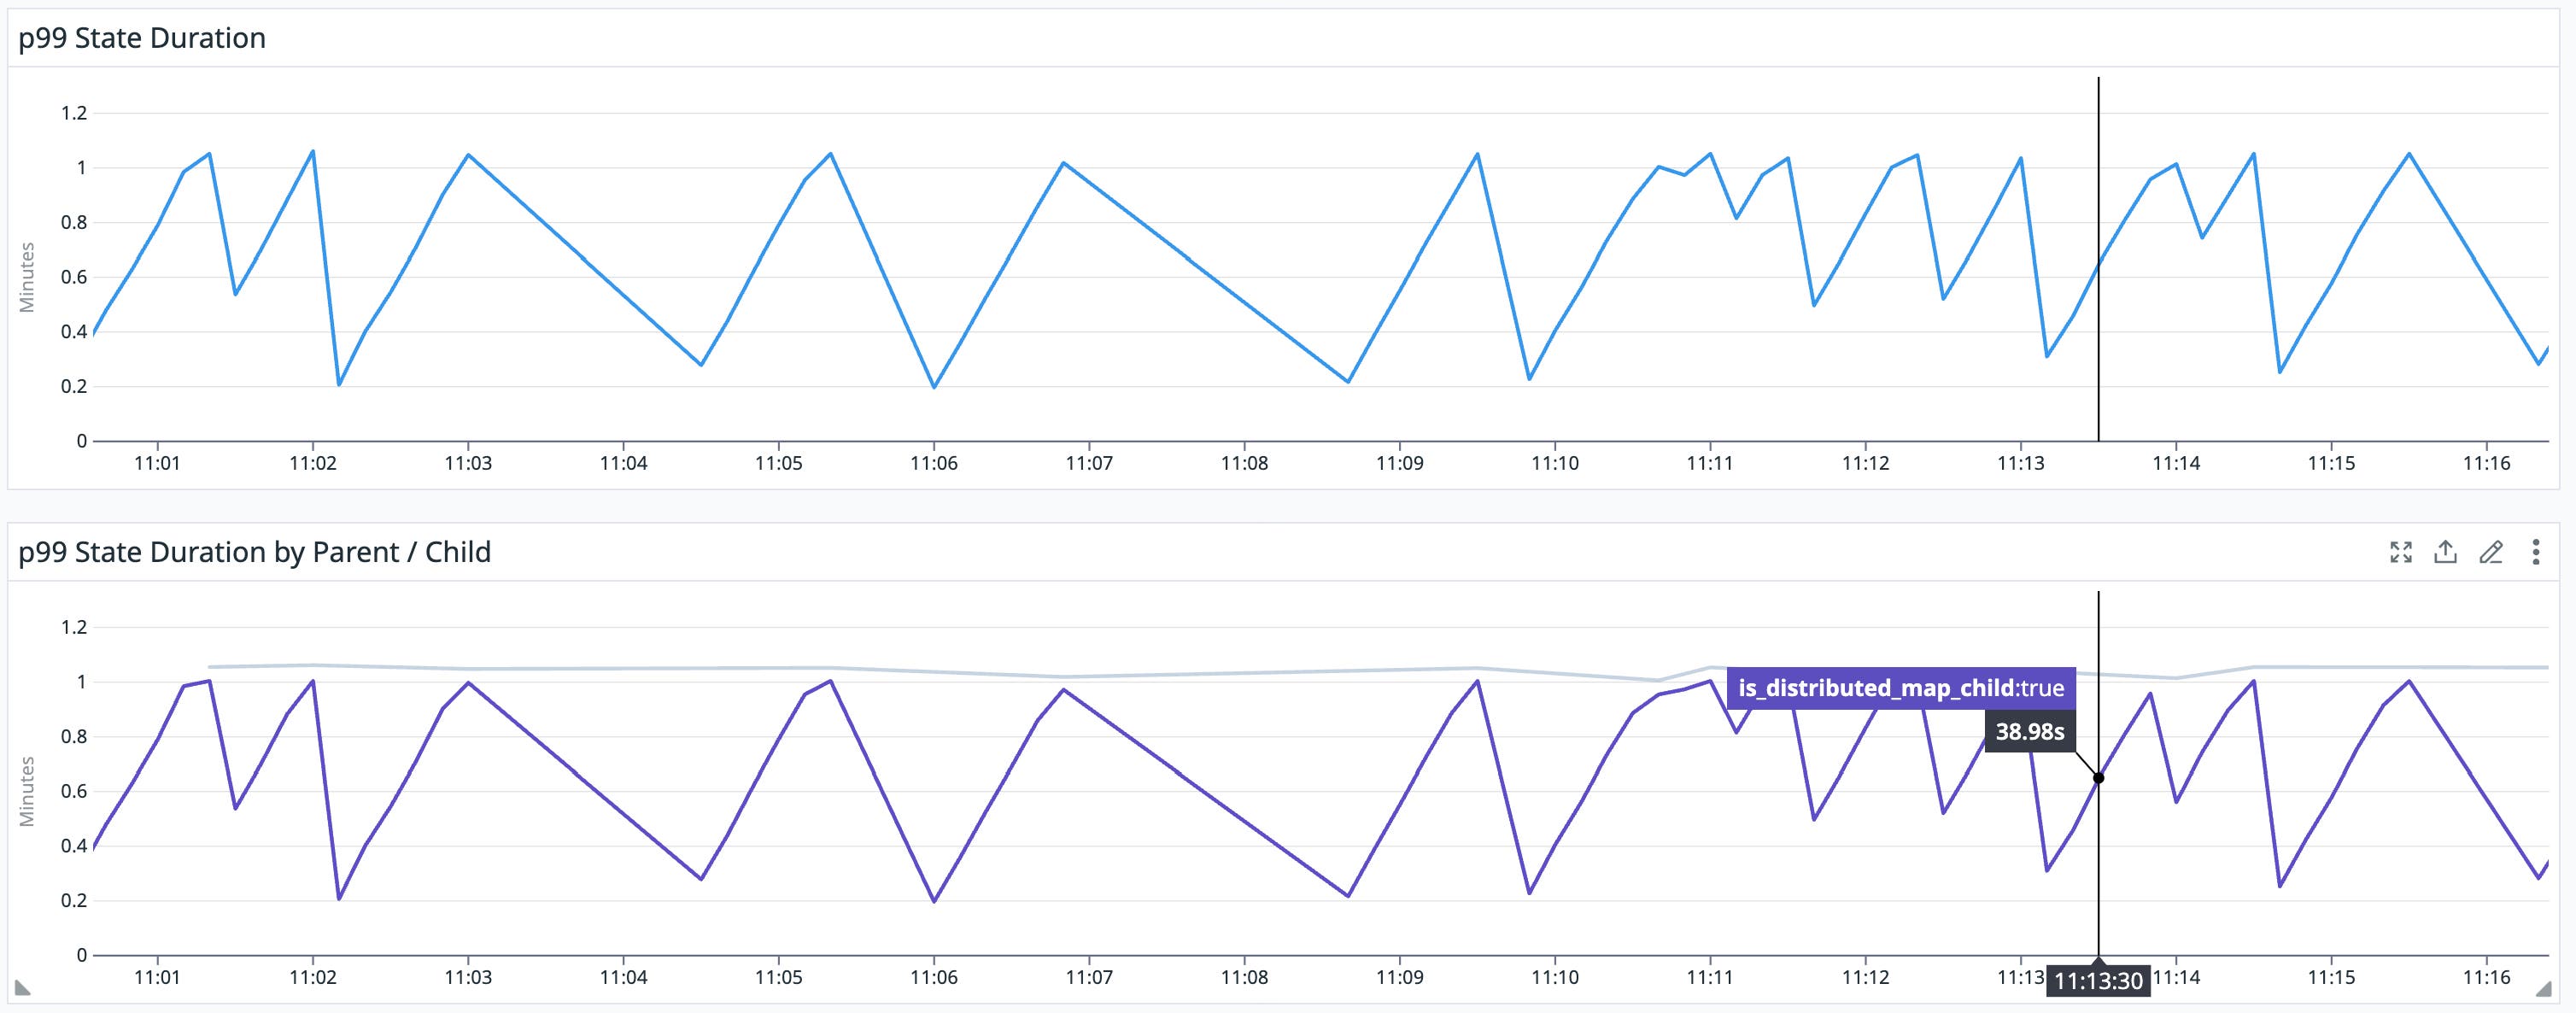
This approach is especially helpful when tracking latency percentiles like p95 or p99, as it allows you to isolate the long tail of child execution times without mixing them with the parent’s orchestration duration. It also gives you clearer signals for alerting and optimization.
Get started today
If you’re working with large-scale workflows that use Distributed Maps with AWS Step Functions, Datadog gives you full visibility into every fan-out. Check out our documentation for our installation guide and more details. As you begin using the feature, we would love for you to provide your feedback.
If you don’t already have a Datadog account, you can sign up for a 14-day free trial.
