
Mallory Mooney
What is Tomcat?
Apache Tomcat is a server for Java-based web applications, developed by the Apache Software Foundation. The Tomcat project’s source was originally created by Sun Microsystems and donated to the foundation in 1999. Tomcat is one of the more popular server implementations for Java web applications and runs in a Java Virtual Machine (JVM). Though it’s primarily used as an application server, it can be configured to work as a basic web server or with the Apache HTTP server. Tomcat works as a Java Servlet Container that provides the runtime environment needed for Java applications and supports the Java Enterprise Edition (EE) Servlet specification. Tomcat can serve dynamic content through the servlet API, including Java Server Pages (JSP) and Java servlets.
Tomcat is a popular option for smaller applications due to the fact that it is a servlet container and doesn’t require the full Java EE platform for serving applications. It has a smaller memory footprint and simpler administration controls. The Tomcat project also has a large, active community and is open source, so you can easily tweak server settings as needed.
In this post, we’ll walk through the Tomcat architecture and take a look at the key performance metrics that can help you monitor its health:
- Request throughput and latency metrics
- Thread pool metrics
- Errors
- JVM memory usage
We’ll focus on Tomcat 9.x (the latest stable release at the time of this writing), which offers support for the Java EE 8 platform and Java 9. However, the core architecture and key performance metrics discussed in this post will remain largely the same for older versions of Tomcat.
The Tomcat architecture
The Tomcat architecture is primarily made up of a Catalina server, connectors, one or more services, and multiple containers nested inside the service. These containers consist of the engine, which processes requests and returns a response based on the engine’s host(s); and multiple contexts, which are the components such as HTML files, Java servlets, and JSP pages that make up the web app.
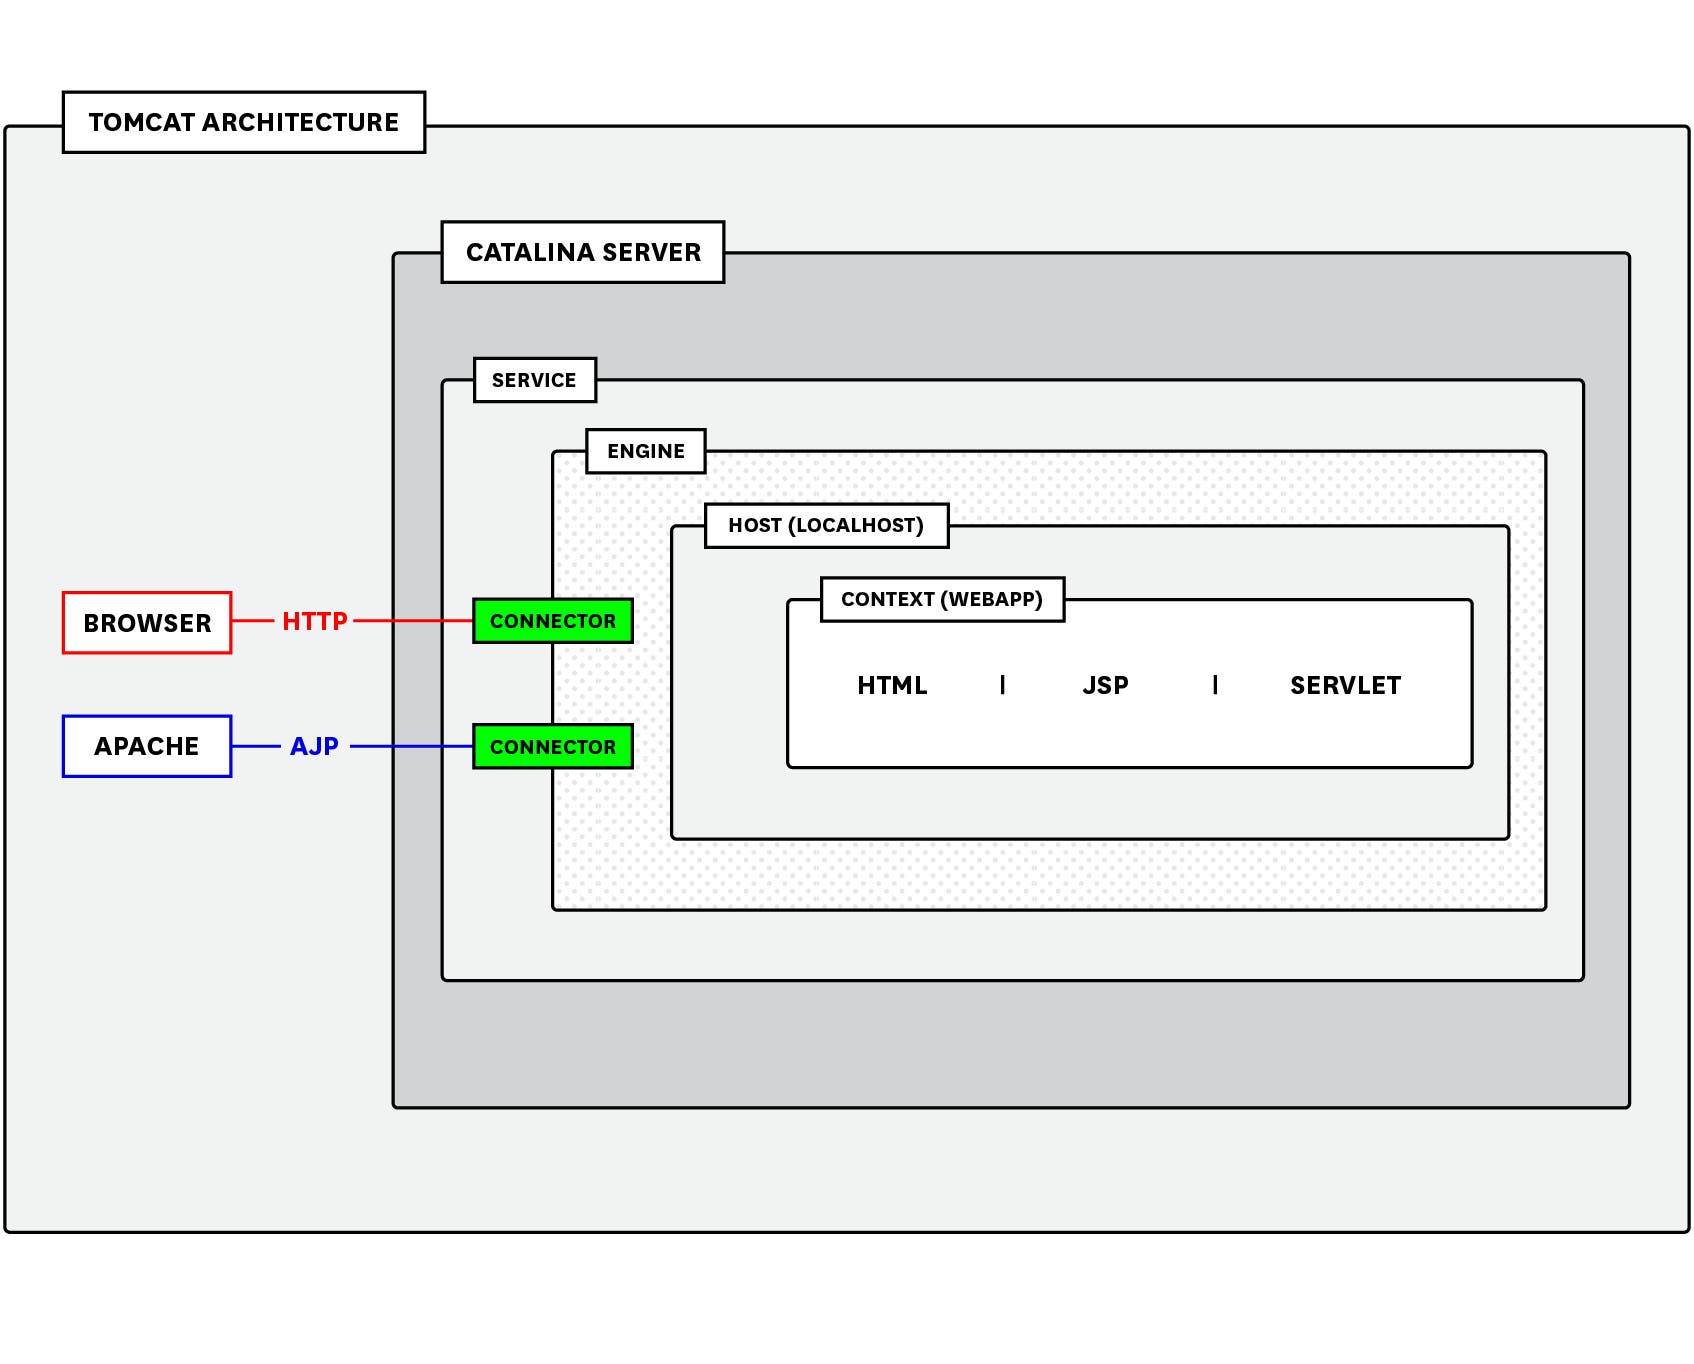
You can view this configuration in Tomcat’s server configuration file (conf/server.xml), which will look similar to the following structure:
<?xml version='1.0' encoding='utf-8'?><Server port="8005" shutdown="SHUTDOWN"> <Listener className="org.apache.catalina.core.AprLifecycleListener" /> <Listener className="org.apache.catalina.core.JasperListener" /> <Listener className="org.apache.catalina.core.JreMemoryLeakPreventionListener" /> <Listener className="org.apache.catalina.mbeans.GlobalResourcesLifecycleListener" /> <Listener className="org.apache.catalina.core.ThreadLocalLeakPreventionListener" />
<Service name="Catalina"> <Connector port="8080" protocol="HTTP/1.1" connectionTimeout="20000" redirectPort="8443" /> <Connector port="8009" protocol="AJP/1.3" redirectPort="8443" /> <Engine name="Catalina" defaultHost="www.testwebapp.com"> <Host name="www.testwebapp.com" appBase="webapps" unpackWARs="true" autoDeploy="true"> </Host> </Engine> </Service></Server>Catalina server, service, and connectors
The two top-level elements of Tomcat are the Catalina server and service (which is nested within the server element). The Catalina server represents the Tomcat architecture in its entirety, and provides an environment for running servlets. Tomcat uses the Jasper engine to convert JSP files into servlets, which are rendered into HTML pages for clients.
The Catalina server contains one or more service elements. Each service element groups one or more connector components together with a single engine. A connector listens for requests on a TCP port and sends them to the service’s engine for processing. For example, a client may send an HTTP request with the following information:
GET http://www.testwebapp.com/sample/
Request Headers:Connection: keep-aliveHost: www.testwebapp.comUser-Agent: Apache-HttpClient/4.5.5 (Java/10.0.1)For this request, Tomcat will extract the host name (www.testwebapp.com) from the request’s header and map it to the matching host element in Tomcat’s configuration. The engine associated with that host will process the request and return a response (e.g., JSP page, servlet) back to the connector. The connector will then send the response back to the client using the appropriate protocol: HTTP/1.1 and Apache JServ (AJP/1.3).
The HTTP protocol is the default connector and allows Tomcat to run as a stand-alone web server and forward requests to the engine. The AJP connector allows Tomcat to integrate with multiple reverse proxy modules (e.g., mod_jk, mod_proxy). You can enable this by setting the APR Lifecycle Listener’s “useAprConnector” attribute to true in Tomcat’s conf/server.xml configuration file:
<Listener className="org.apache.catalina.core.AprLifecycleListener" useAprConnector="true" />This is useful if you want Apache to handle static content while Tomcat handles dynamic content (e.g., JSPs or servlets). You can configure multiple HTTP and/or AJP connectors within a service, and configure each connector to listen for incoming requests on a different TCP port.
As of version 8.5+, Tomcat’s two modes for managing connections for both the AJP and HTTP protocols are the Apache Portable Runtime/Native (APR) and the non-blocking I/O (NIO and NIO2), and can automatically switch between these modes when needed. APR allows Tomcat to use Apache server libraries to further enhance its capabilities as a web server. NIO mode enables Tomcat to simultaneously handle multiple connections per thread by using poller threads to keep connections alive and worker threads to process incoming requests. NIO2 builds upon NIO and includes additional features for handling asynchronous I/O operations.
Tomcat will use APR by default if the Tomcat native library is installed and you’ve enabled the AprLifecycleListener in the conf/server.xml file. Otherwise, Tomcat will use NIO. If you don’t want Tomcat to switch between modes, you can explicitly set a protocol by updating the protocol parameter for each of your HTTP and/or AJP connectors:
<Connector port="8080" protocol="org.apache.coyote.http11.Http11NioProtocol"></Connector>In the example above, we are specifying the NIO connector protocol, but you can use Http11Nio2Protocol if you want to use the NIO2 protocol instead. Check out Tomcat’s connector comparison chart for more information on each mode and connector protocol.
Requests and worker threads
Each Tomcat connector manages its workload with a pool of worker threads and one or more acceptor threads. When a connector receives a request from a client, the acceptor thread assigns the connection to an available worker thread from the pool and then goes back to listening for new connections. The worker thread then sends the request to the engine, which processes the request and creates the appropriate response based on the request headers and the associated virtual host and contexts. A worker thread becomes available again once the engine returns a response for the connector to transmit back to the client.
Tomcat enables you to fine-tune certain parameters in order to ensure that each connector is efficiently managing its workload. The number of threads in the pool depends on the parameters you’ve set for the connector in your conf/server.xml file. By default, Tomcat sets maxThreads to 200, which represents the maximum number of threads allowed to run at any given time. You can also specify values for the following parameters:
minSpareThreads: the minimum number of threads that should be running at all times. This includes idle and active threads. The default value is 10.maxConnections: the total number of concurrent connections that the server will accept and process. Any additional incoming connections will be placed in a queue until a thread becomes available. The default value for NIO/NIO2 mode is 10,000 and 8,192 for APR/native.acceptCount: the maximum number of TCP requests that can wait in a queue at the OS level when there are no worker threads available. The default value is 100.connectionTimeout: the number of milliseconds a connector will wait before closing an idle connection. The default value is 20,000.
Upon startup, Tomcat will create threads based on the value set for minSpareThreads and increase that number based on demand, up to the number of maxThreads. If the maximum number of threads is reached, and all threads are busy, the server will only continue to accept a certain number of concurrent connections (as determined by maxConnections). Once that limit is reached, new connections are placed in a queue (acceptCount) to wait for the next available thread. When the number of connections hits maxConnections and the queue is full, any additional incoming clients will start receiving Connection Refused errors. If your server begins generating these errors, you will need to adjust your connectors’ thread pool capacity to better accommodate the number of incoming requests.
However, note that if you set the values for the maximum number of threads and the maximum queue length (acceptCount) too high, then an increase in server traffic could quickly consume too many server resources as it fills the queue and uses up the available number of threads.
Executor
If you want to have greater control over how the pool manages and distributes threads across connectors, you can use an executor. This is useful for configuring threads for a single pool instead of adjusting values per connector. The executor includes the following parameters:
maxThreads: the maximum number of active threads available in the pool. The default value is 200.minSpareThreads: the minimum number of idle and active threads that should always be available. The default value is 25.maxQueueSize: the number of request processing tasks that can be placed in the executor queue to wait for an available worker thread.maxIdleTime: the number of milliseconds before a thread can remain idle before it is shut down, shrinking the thread pool. The default value is 60,000.connectionTimeout: the number of milliseconds a connector will wait before closing an idle connection. The default value is 20,000.
Tomcat recommends using an executor to share threads across multiple connectors and better accommodate server load. An executor also gives you more control over how Tomcat adjusts the number of threads in the pool based on workload (maxIdleTime). As with thread pools for individual connectors, executors create threads based on request demand, up to the number of maximum threads allotted for the pool. All additional requests are placed in the executor queue (maxQueueSize) to wait for available threads. If this queue is full, the executor will reject new request processing tasks, causing Tomcat to throw a RejectedExecutionException error.
Monitoring server workloads and resource usage can help ensure that Tomcat is serving your application(s) efficiently. Tomcat exposes metrics for the server, JVM, and servlets, so you can actively monitor its performance, and determine if you need to fine-tune your server’s thread and memory usage to handle more traffic efficiently.
Key Tomcat and JVM performance metrics
Without monitoring, you can miss issues from Tomcat and the JVM running your Tomcat instance. For example, a JVM low on memory can significantly slow down the performance of your application. And if your Tomcat server takes too long to process requests, your users’ overall experience suffers.
In order to get an accurate picture of how your server and JVM are operating, you can monitor metrics exposed by both Tomcat and its virtual machine. Tomcat exposes metrics through JMX and access logs. JMX provides a high-level view of your metrics while access logs enable you to monitor individual requests or specific types of requests such as HTTP status codes.
JMX monitors metrics with Managed Beans (MBeans), which are registered with the JMX MBean server and represent applications or services running on a JVM. Each MBean is made up of a domain (e.g., Catalina, Java packages) and a list of properties that include a type and attributes. For Tomcat, the type defines the set of attributes (or metrics) needed for the MBean resource.
As mentioned in the introduction, we’ll focus on key metrics for server- and system-level metrics, though Tomcat also emits metrics for each servlet and JSP running on the server. Tomcat’s server and system metrics fall under one of two domains: Catalina or java.lang. These metrics, represented as MBean types, provide some key insights and can be broken up into four categories:
- Request throughput and latency metrics
- Thread pool metrics
- Errors
- JVM memory usage
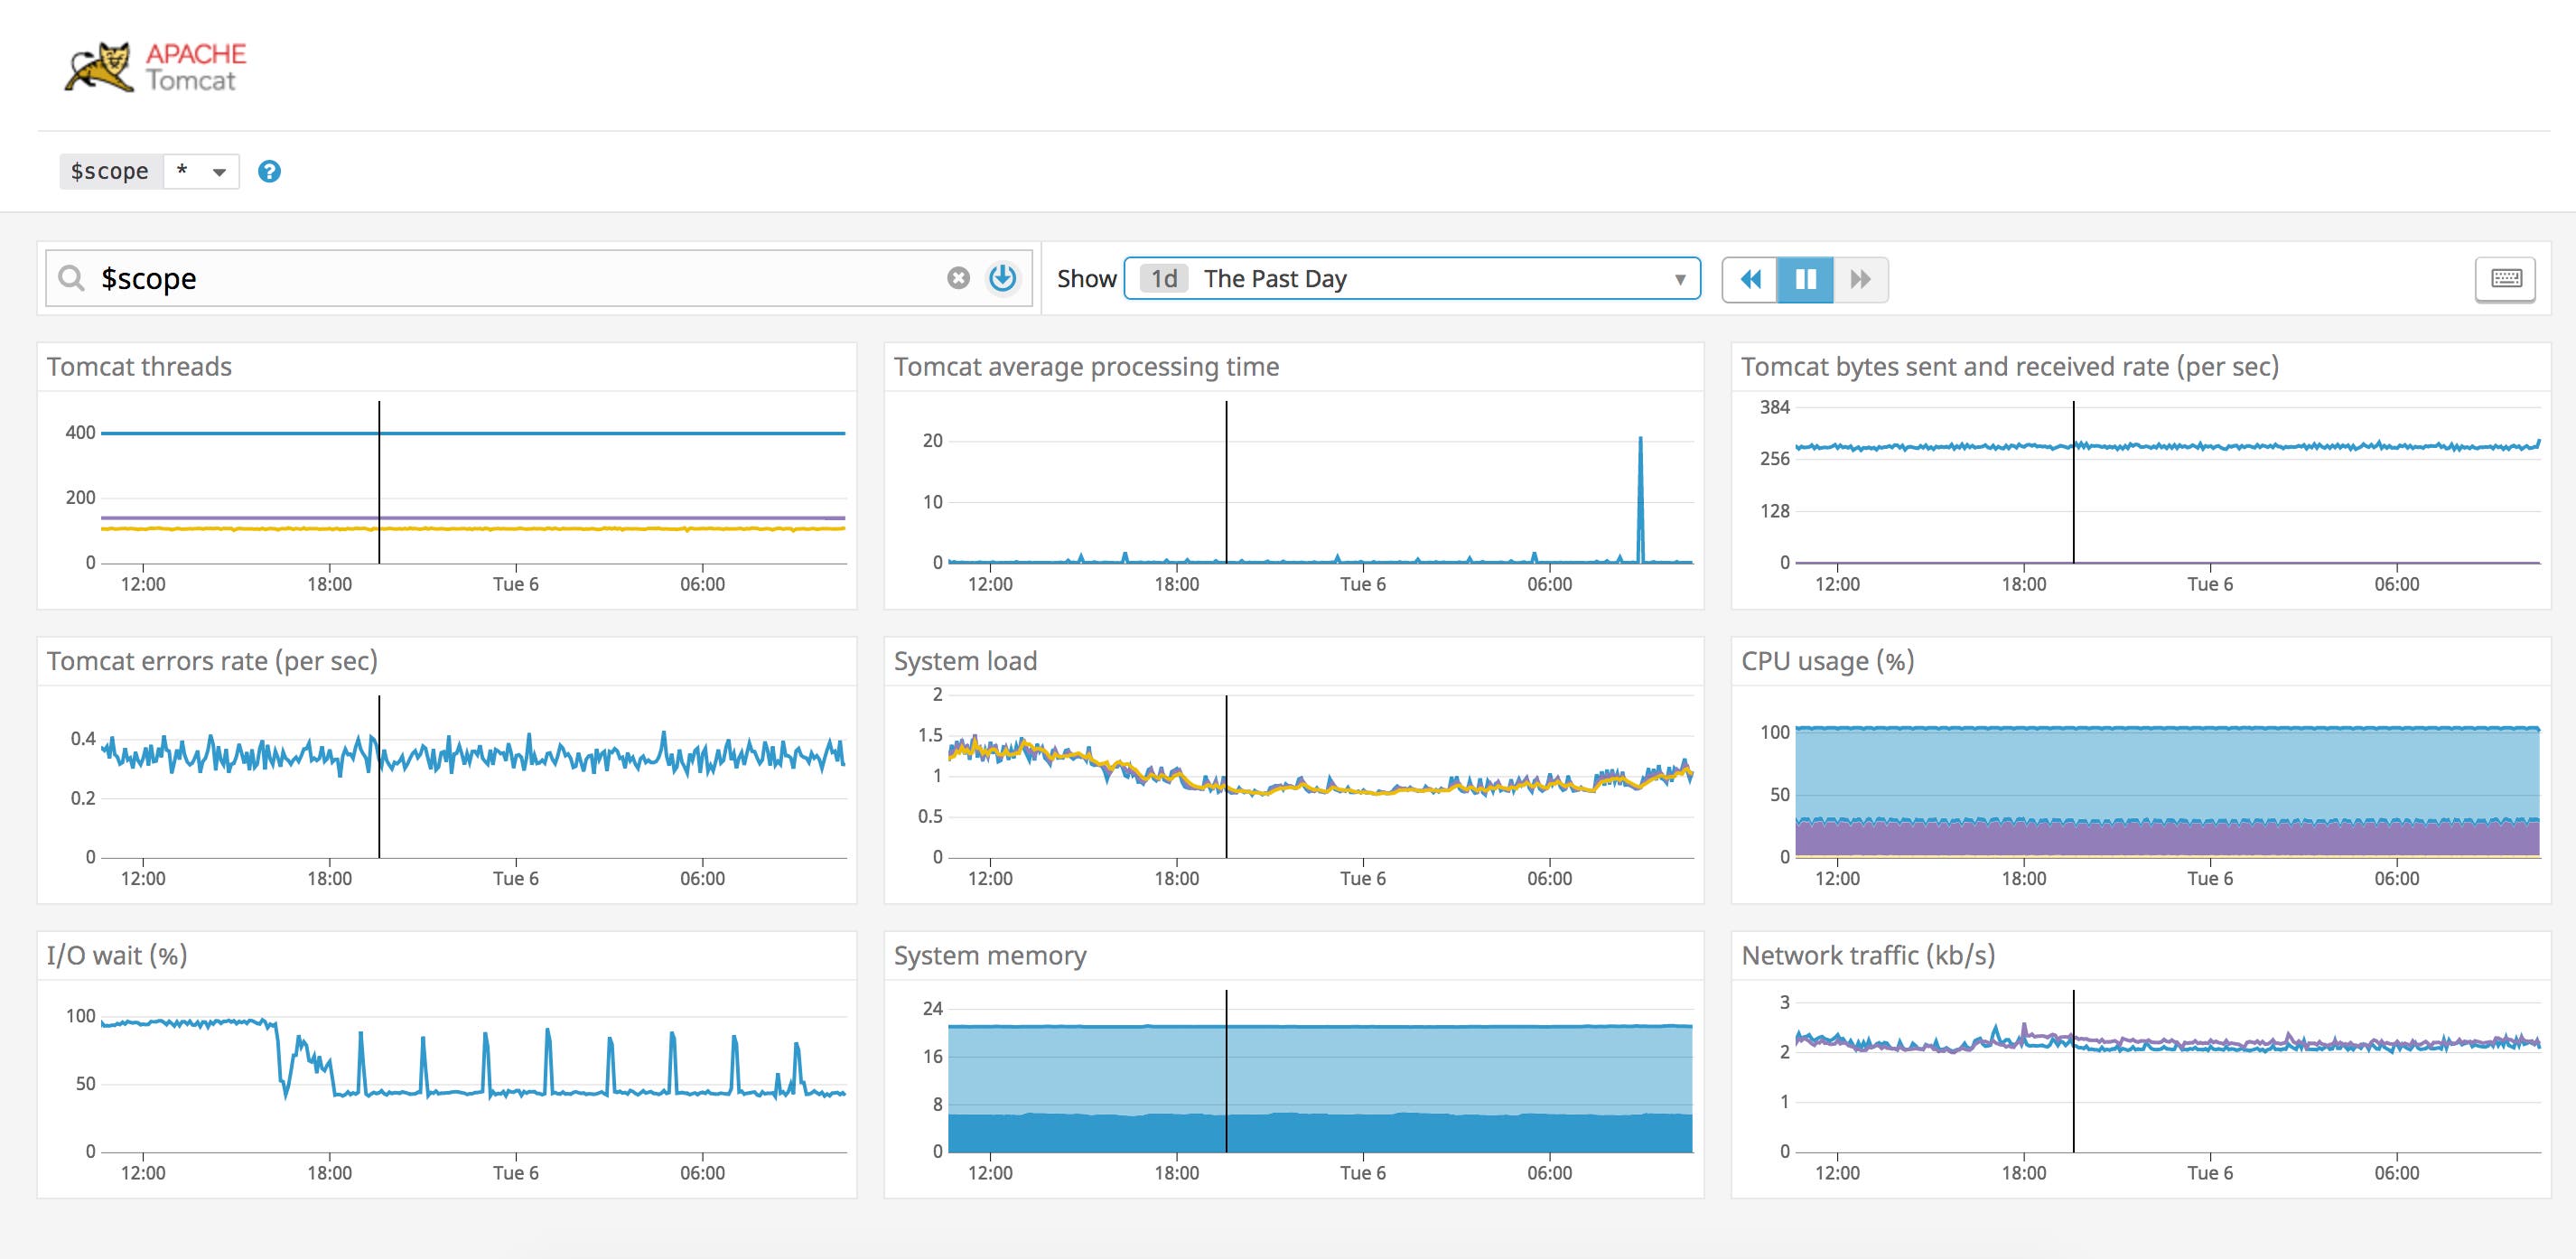
Monitoring these metrics will help you ensure the stability of your deployed applications by giving you a complete picture of how the Tomcat server and your JVM are operating. You can view key metrics through Tomcat’s web management interface and access logs, as well as tools like JConsole and JavaMelody, which we’ll explore in further detail in Part 2.
Throughout this series, we’ll discuss metrics that are available through Java Management Extensions (JMX) and from Tomcat’s access logs. We’ll also reference metric terminology from our Monitoring 101 series, which provides a framework for metric collection and alerting.
Request throughput and latency metrics
To monitor how efficiently your Tomcat server handles request throughput, you can look at the Request Processor MBean type under the Catalina domain and the request processing time for an individual log. Both provide metrics for the HTTP and AJP connectors. We’ll look at throughput for the HTTP connector, but you can also track the same metrics for Tomcat’s AJP connector.
| JMX Attribute/Log Metric | Description | MBean/Log Pattern | Metric Type | Availability |
|---|---|---|---|---|
| requestCount | The number of requests across all connectors | Catalina:type=GlobalRequestProcessor,name=“http-nio-8080” | Work: Throughput | JMX |
| processingTime | The total time to process all incoming requests, in milliseconds | Catalina:type=GlobalRequestProcessor,name=“http-nio-8080” | Work: Performance | JMX |
| Request processing time | The time to process a single request, in milliseconds | %D | Work: Performance | Tomcat access logs |
| maxTime | The longest time it takes to process a single incoming request, in milliseconds | Catalina:type=GlobalRequestProcessor,name=“http-nio-8080” | Work: Performance | JMX |
Like with any other application server, monitoring throughput for your Tomcat server will show how well it handles a certain volume of requests. This is especially important as traffic to your application grows, because you want to ensure that your server can accommodate those requests efficiently.
Metric to alert on: requestCount
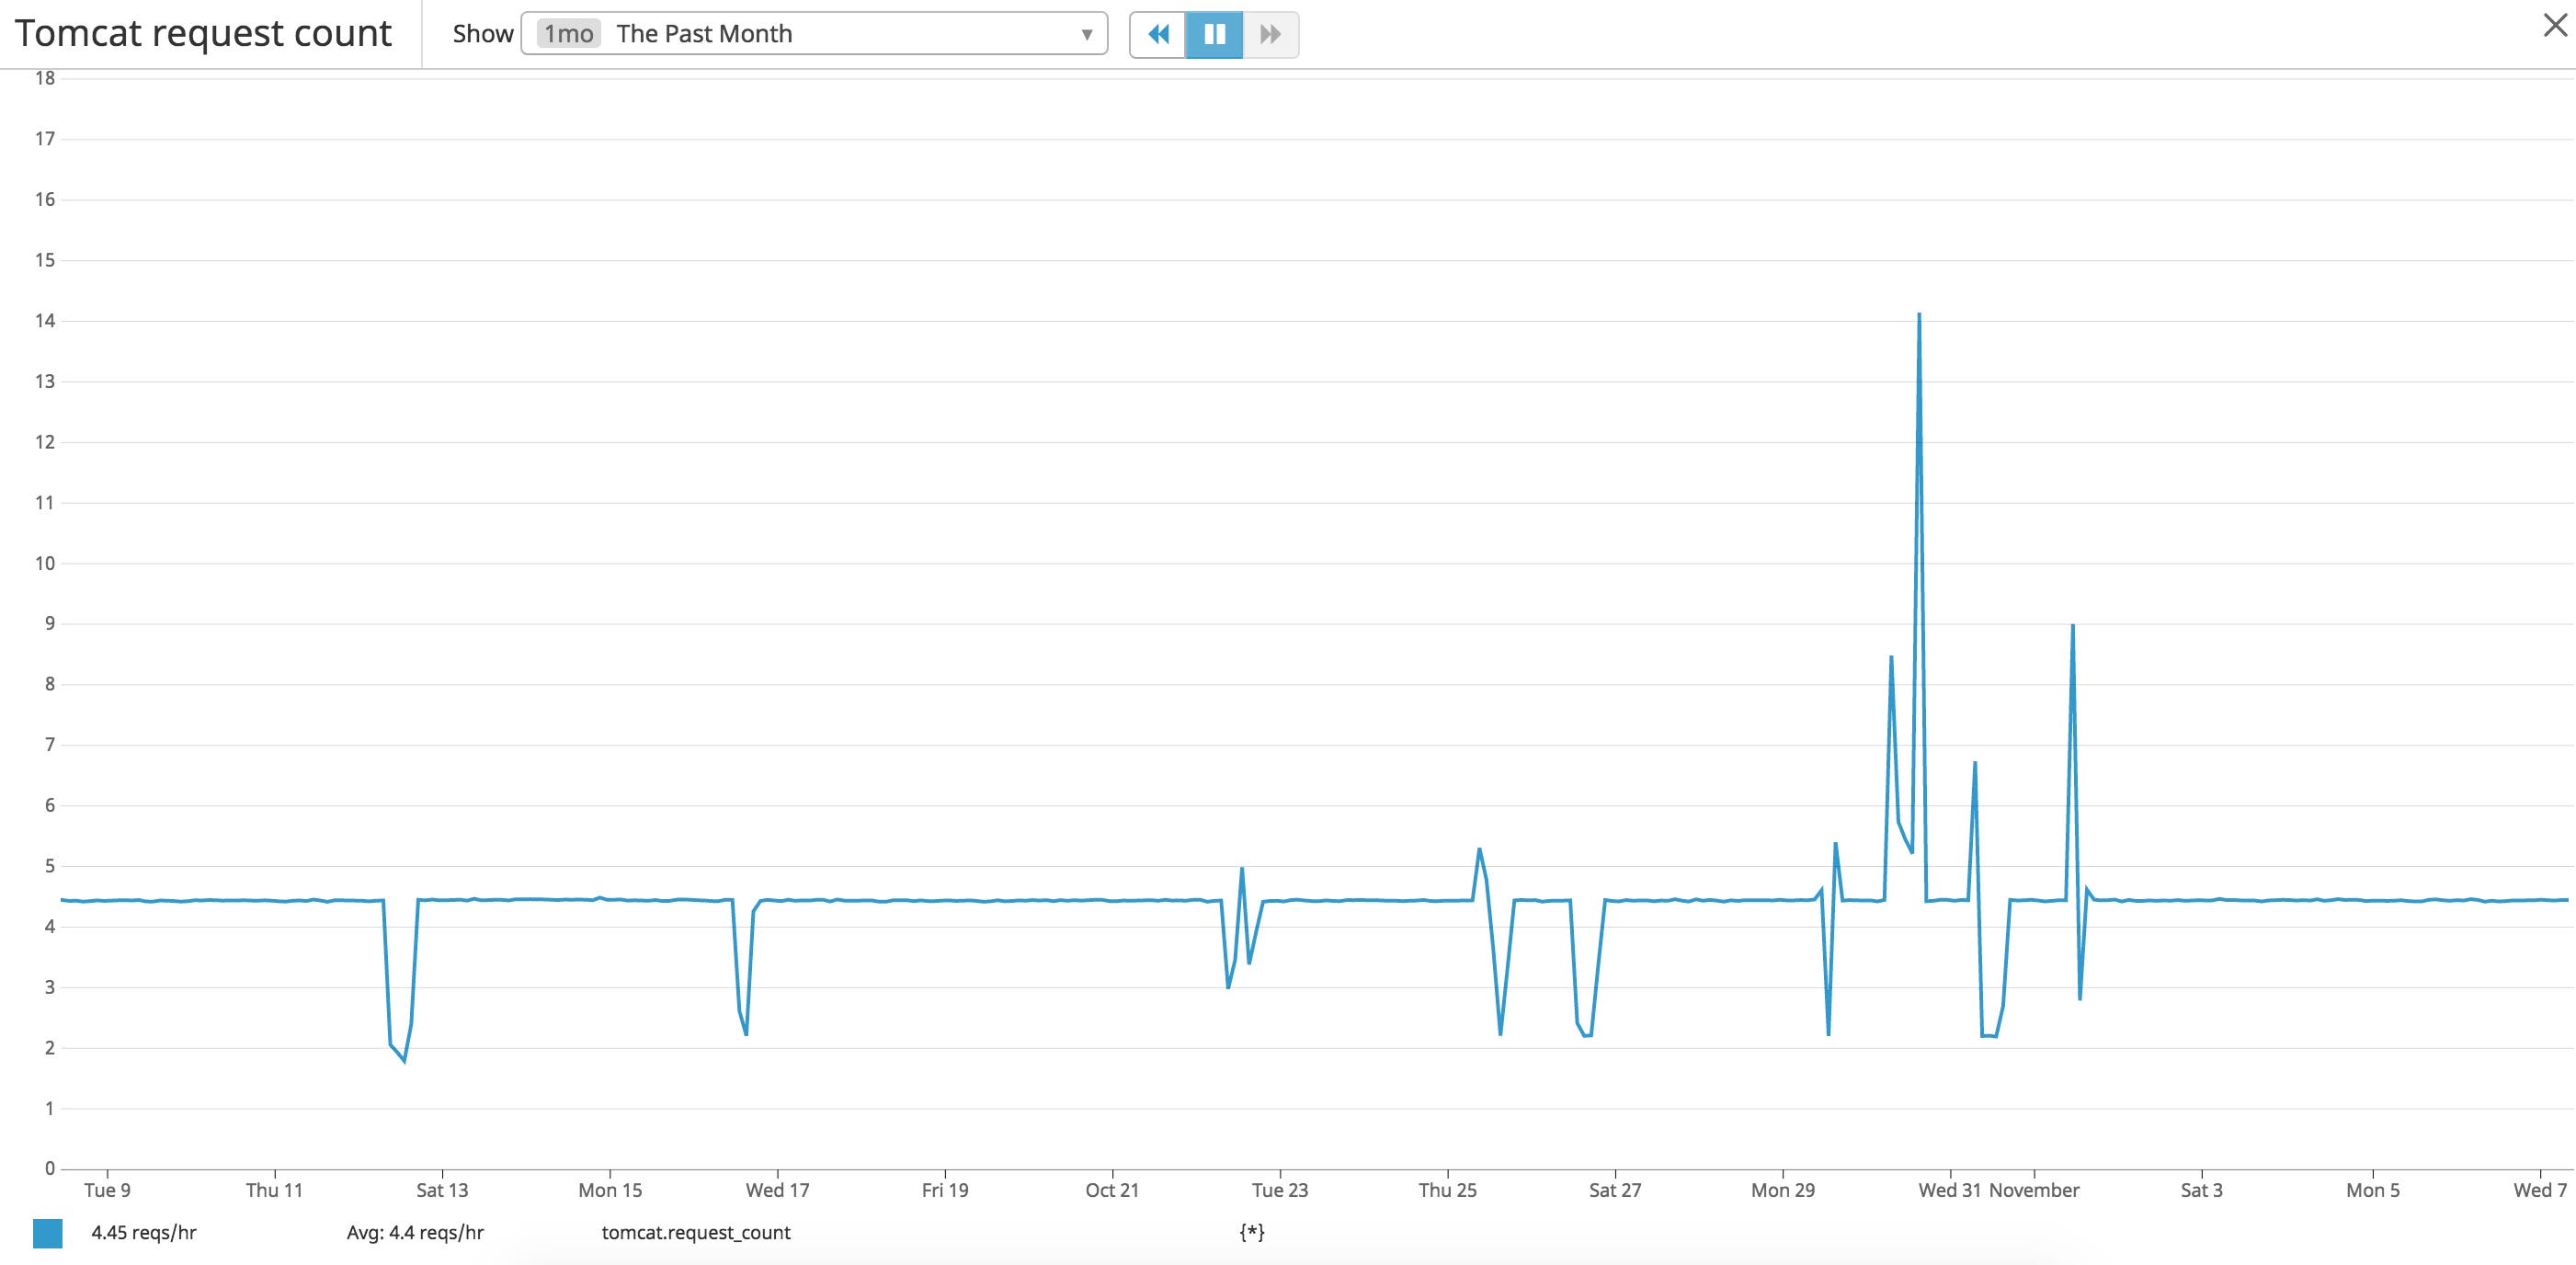
The requestCount metric represents the number of client requests hitting your server. Request counts provide a baseline for understanding the levels of traffic to your server throughout the day, so it’s important to monitor these values to get a better understanding of server activity. If you have established performance benchmarks for your server, you can create an alert that sets a threshold for the number of requests you know your server can handle before it begins to consume too many resources. Since this metric is a cumulative count (increasing until you restart the server or manually reset its counter), it’s beneficial to use a monitoring tool to track and calculate the rate of requests over a shorter time frame (e.g., the past hour, day, week) and alert on any drastic changes. For example, a sudden dip in traffic could indicate that your users are no longer able to access your application.
In order to get a better understanding of how your server handles sudden changes in traffic, you can compare request counts with other metrics such as processing time and thread count. An increase in processing time without a corresponding spike in the number of requests could indicate that your server does not have enough worker threads available to process requests or a complex database query is slowing down the server. You may want to consider increasing the maximum thread count, as described in the fine-tuning section.
Metric to alert on: processingTime
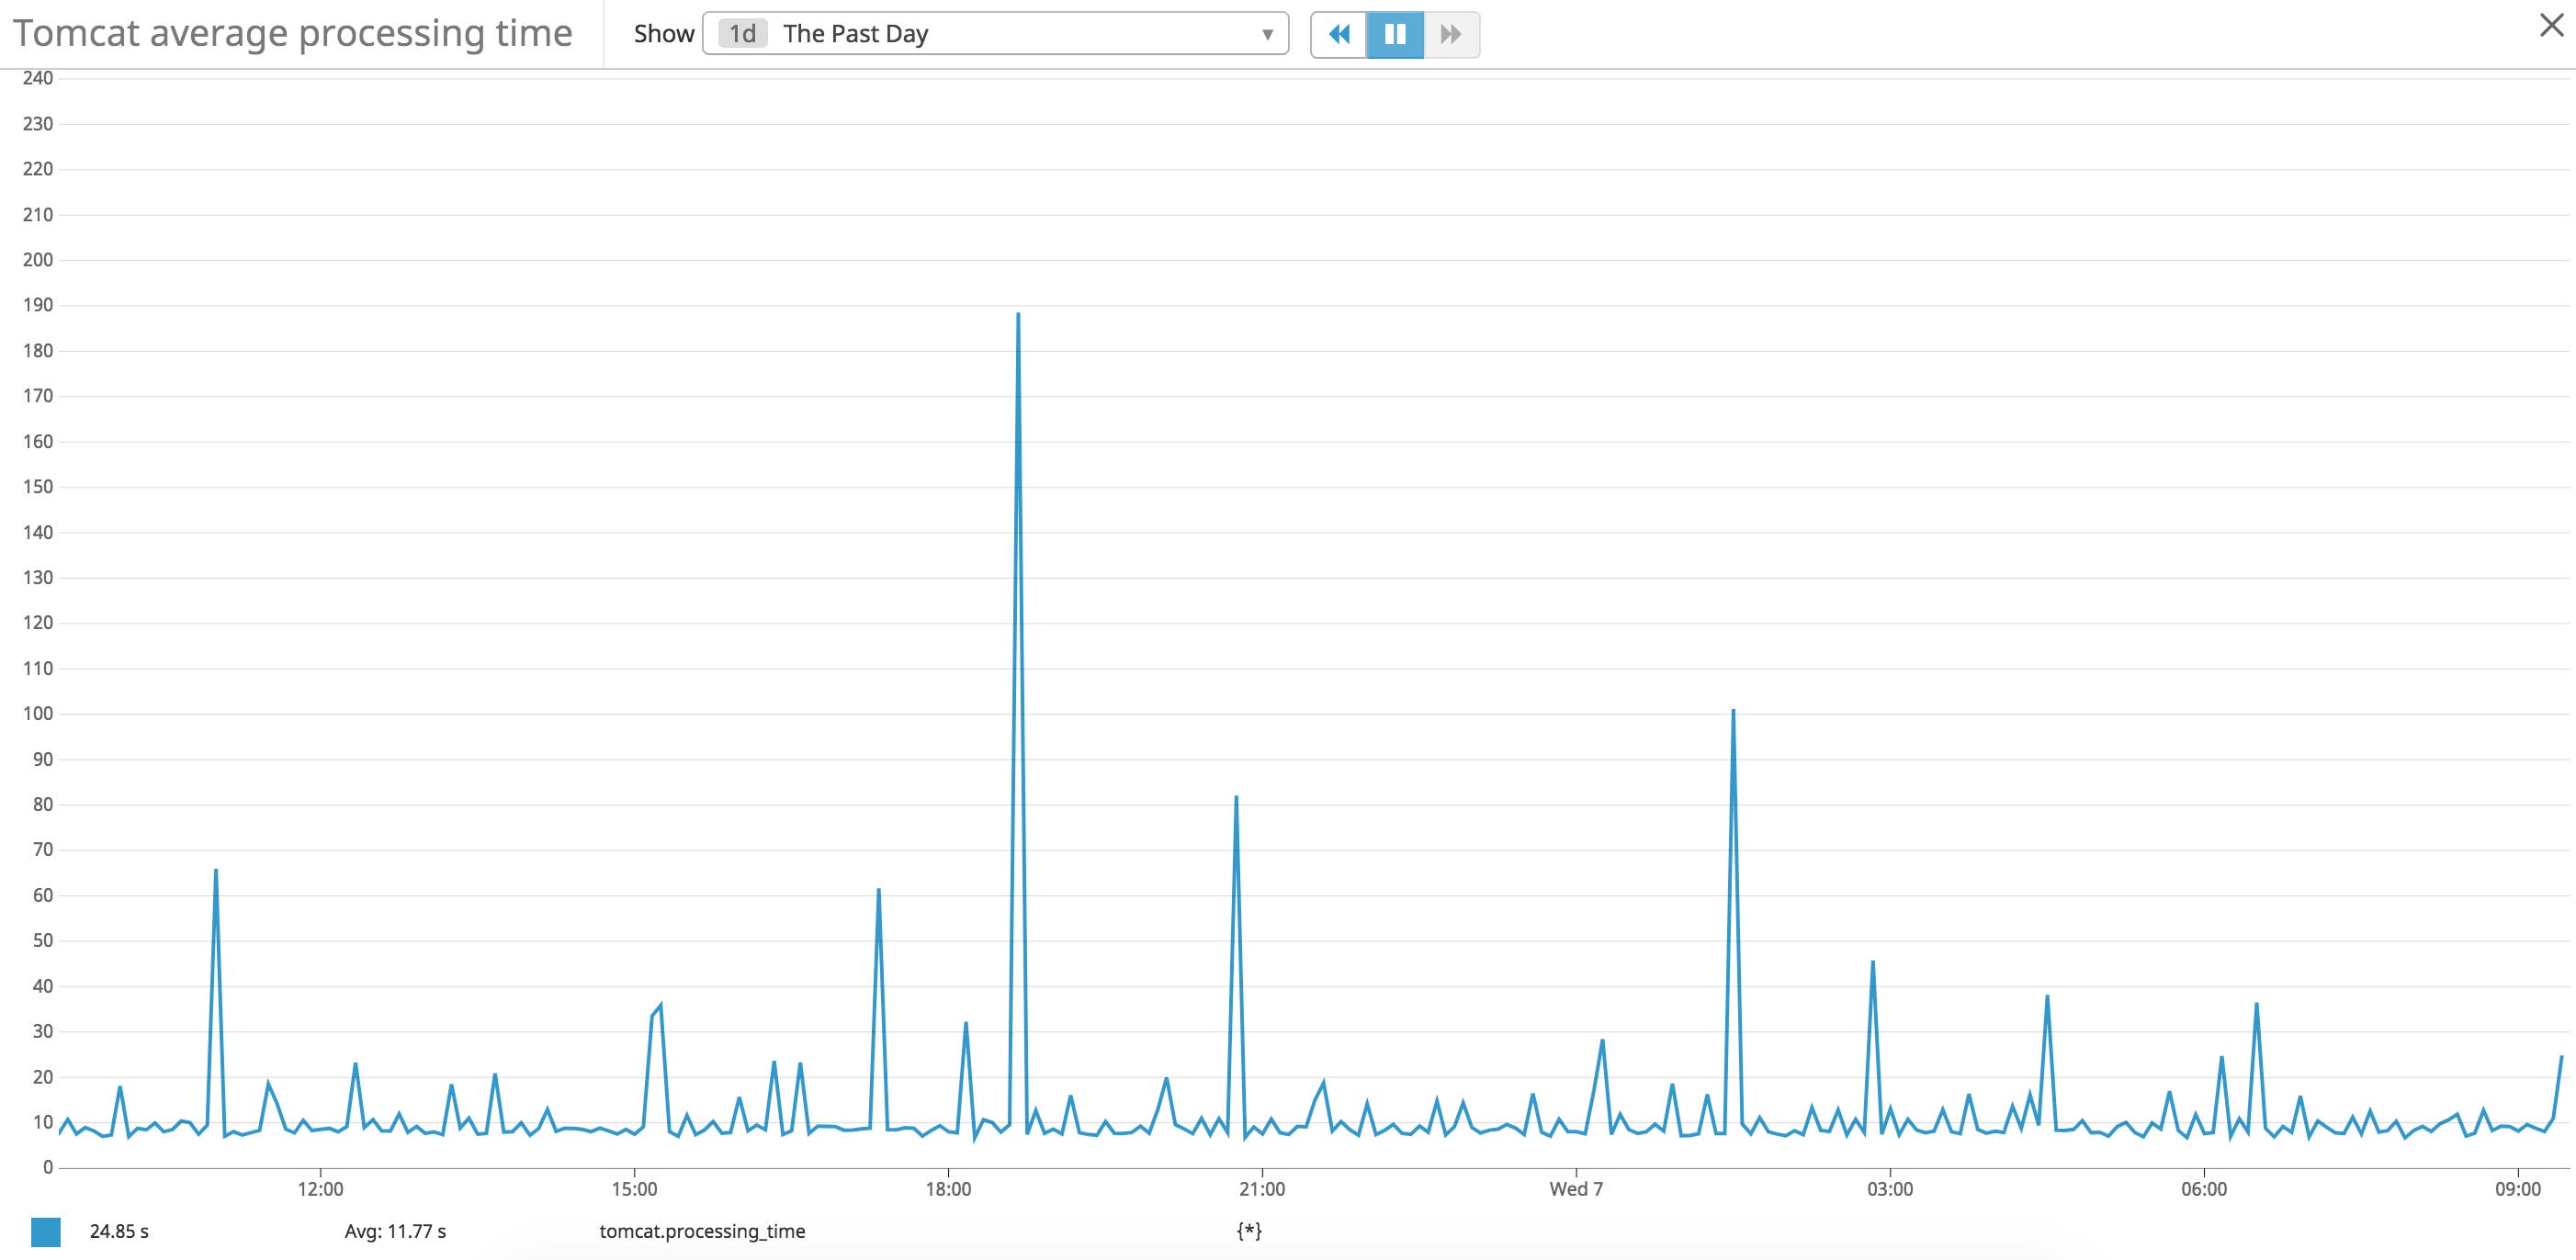
If you query the processingTime metric from JMX, you will see the total time spent processing all incoming requests, calculated over the entire period the server has been running. Since this metric measures time from the start of the server, it’s difficult to understand processing time over shorter periods of time. To do so, you can use a monitoring tool to collect and measure this value as a rate over a period of time (e.g., last hour, day, week).
Tracking your Tomcat server’s request processing time can help you understand how well your server is managing incoming requests, especially during peak traffic times. When compared with the requestCount metric, you can gauge how many requests your server can efficiently handle. If the processing time increases as traffic increases, then you may not have enough worker threads to process the requests, or your server is reaching its threshold and consuming too much memory.
You can also query request processing time for individual requests from your access logs. Tomcat’s access logs include information about HTTP request status, method, and total processing time so you can better troubleshoot issues with various types of requests (e.g., POST requests to a specific endpoint). This is useful if you need to identify the specific requests that took the longest amount of time to process.
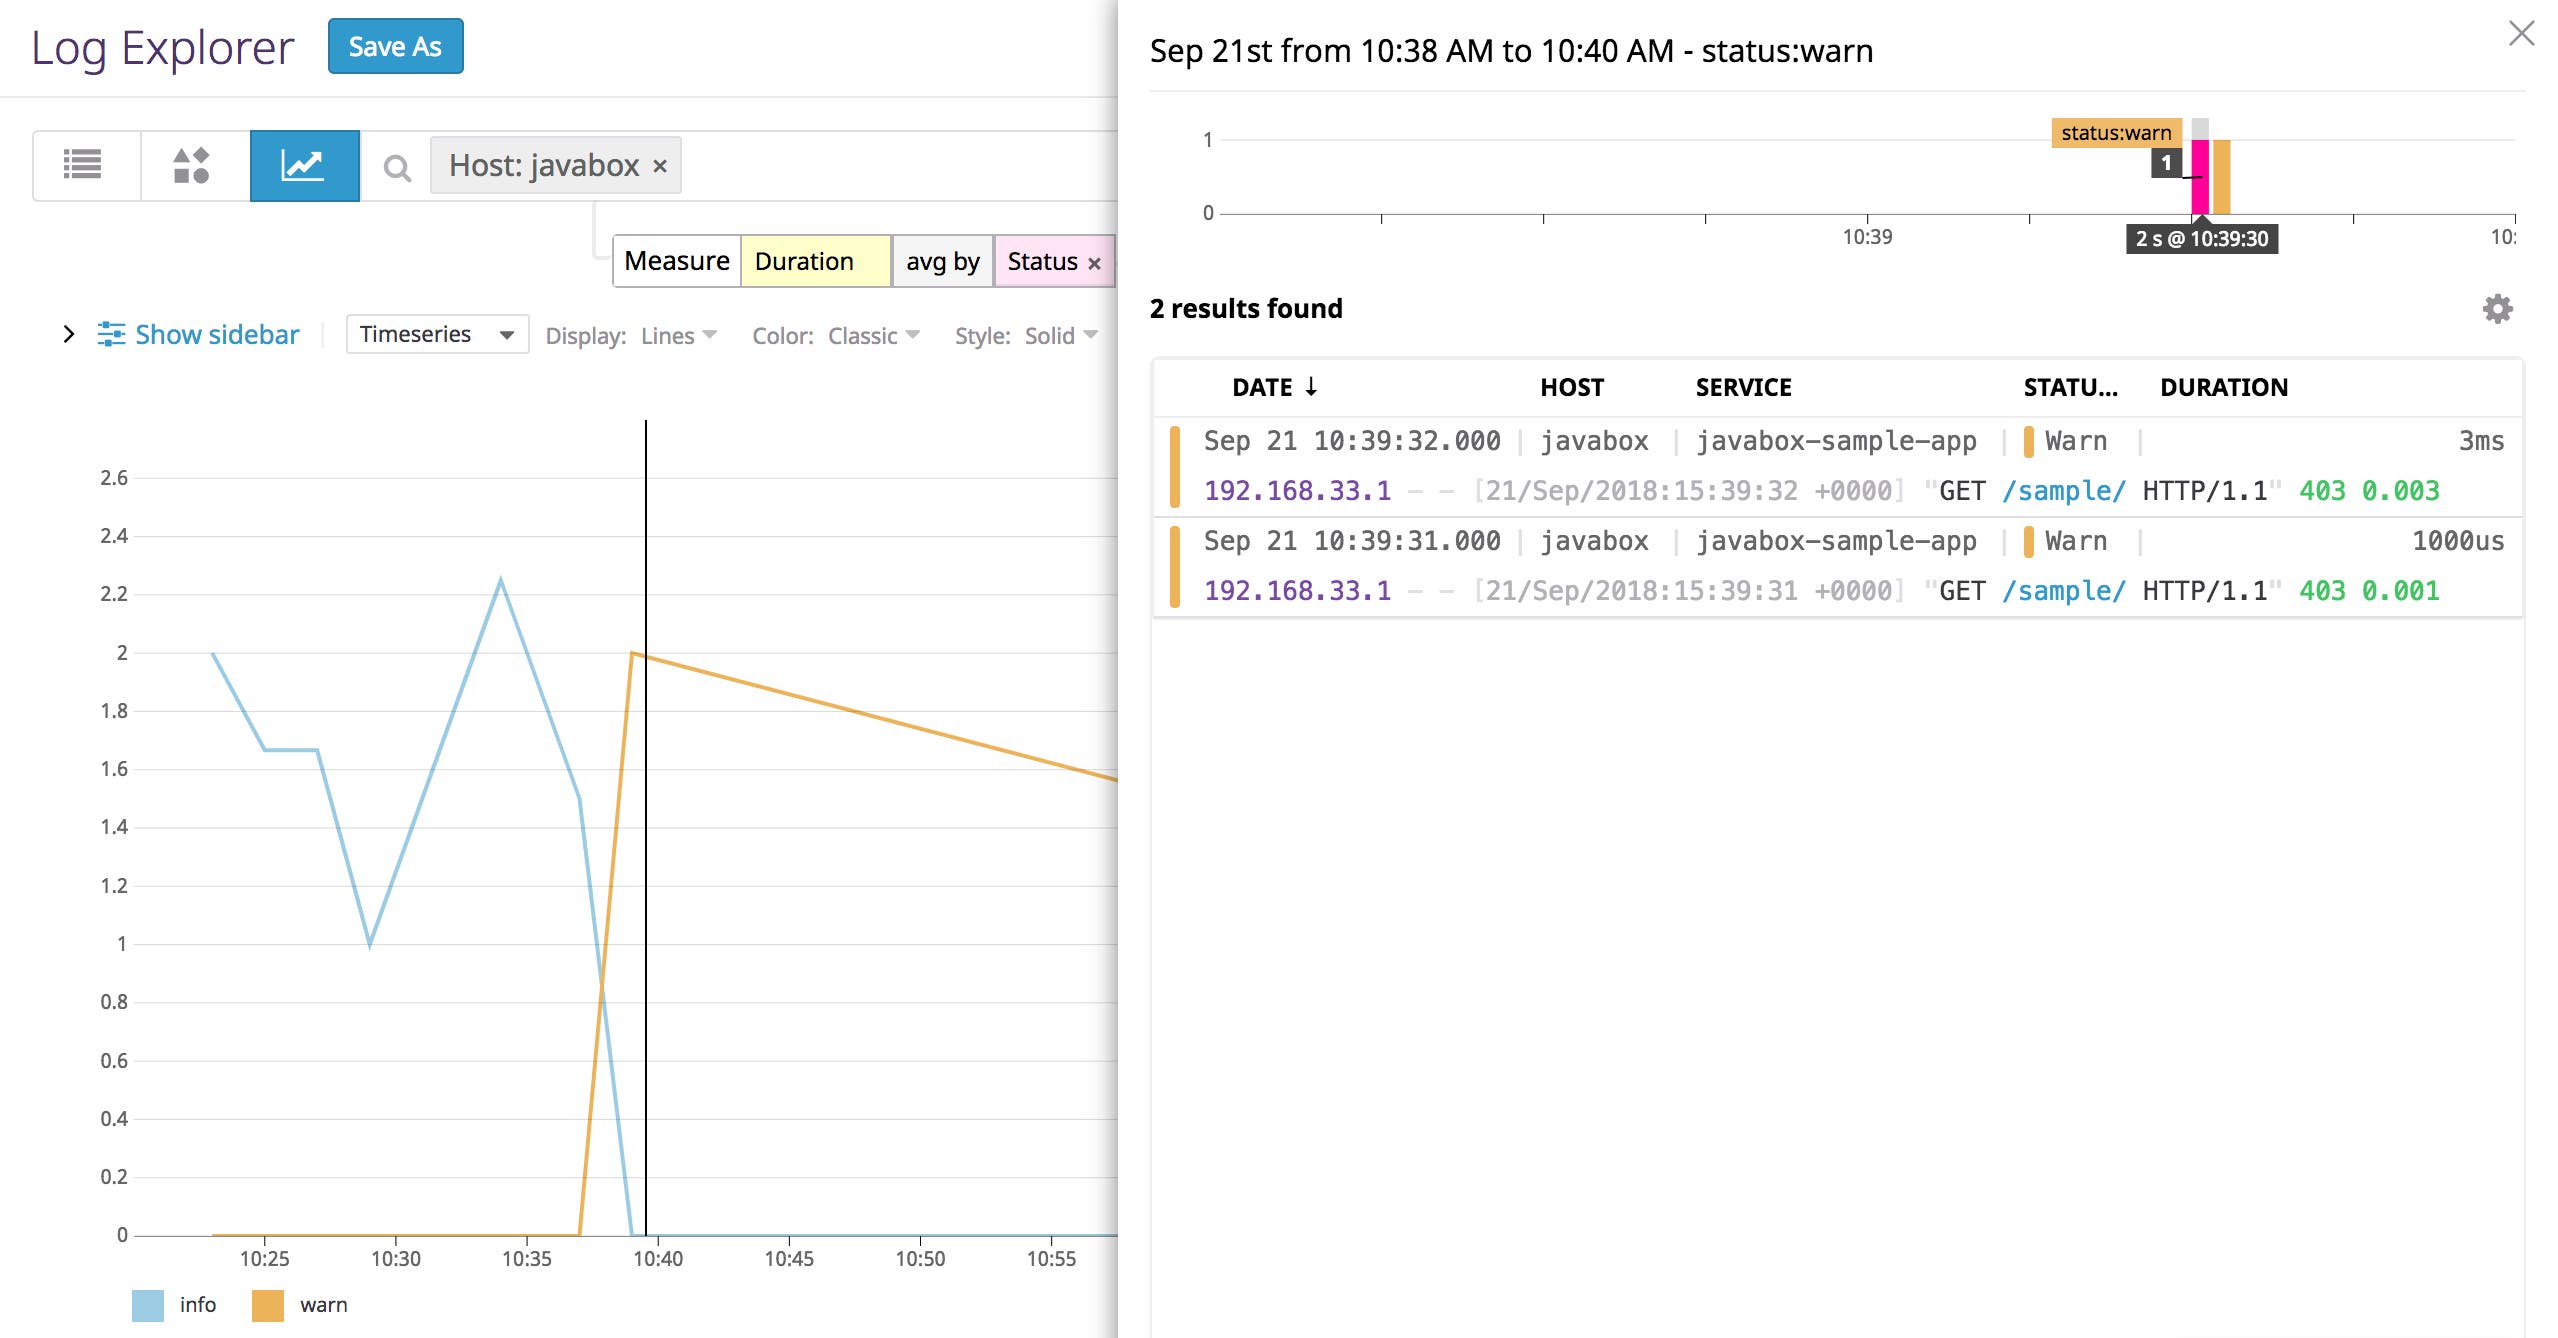
In the example image above, we are graphing response times for each log status, and then viewing the individual logs with a Warn status. In Part 2, we’ll look at how to use a monitoring tool to collect and query this metric data from both JMX and access logs.
Metric to alert on: maxTime
Max processing time indicates the maximum amount of time it takes for the server to process one request (from the time an available thread starts processing the request to the time it returns a response). Its value updates whenever the server detects a longer request processing time than the current maxTime. This metric doesn’t include detailed information about a request, its status, or URL path, so in order to get a better understanding of the max processing time for individual requests and specific types of requests, you will need to analyze your access logs.
A spike in processing time for a single request could indicate that a JSP page isn’t loading or an associated process (such as a database query) is taking too long to complete. Since some of these issues could be caused by operations outside of Tomcat, it’s important to monitor the Tomcat server alongside all of the other services that make up your infrastructure. This helps to ensure you don’t overlook other operations or processes that are also critical for running your application.
Thread pool metrics
Throughput metrics help you gauge how well your server is handling traffic. Because each request relies on a thread for processing, monitoring Tomcat resources is also important. Threads determine the maximum number of requests the Tomcat server can handle simultaneously. Since the number of available threads directly affects how efficiently Tomcat can process requests, monitoring thread usage is important for understanding request throughput and processing times for the server.
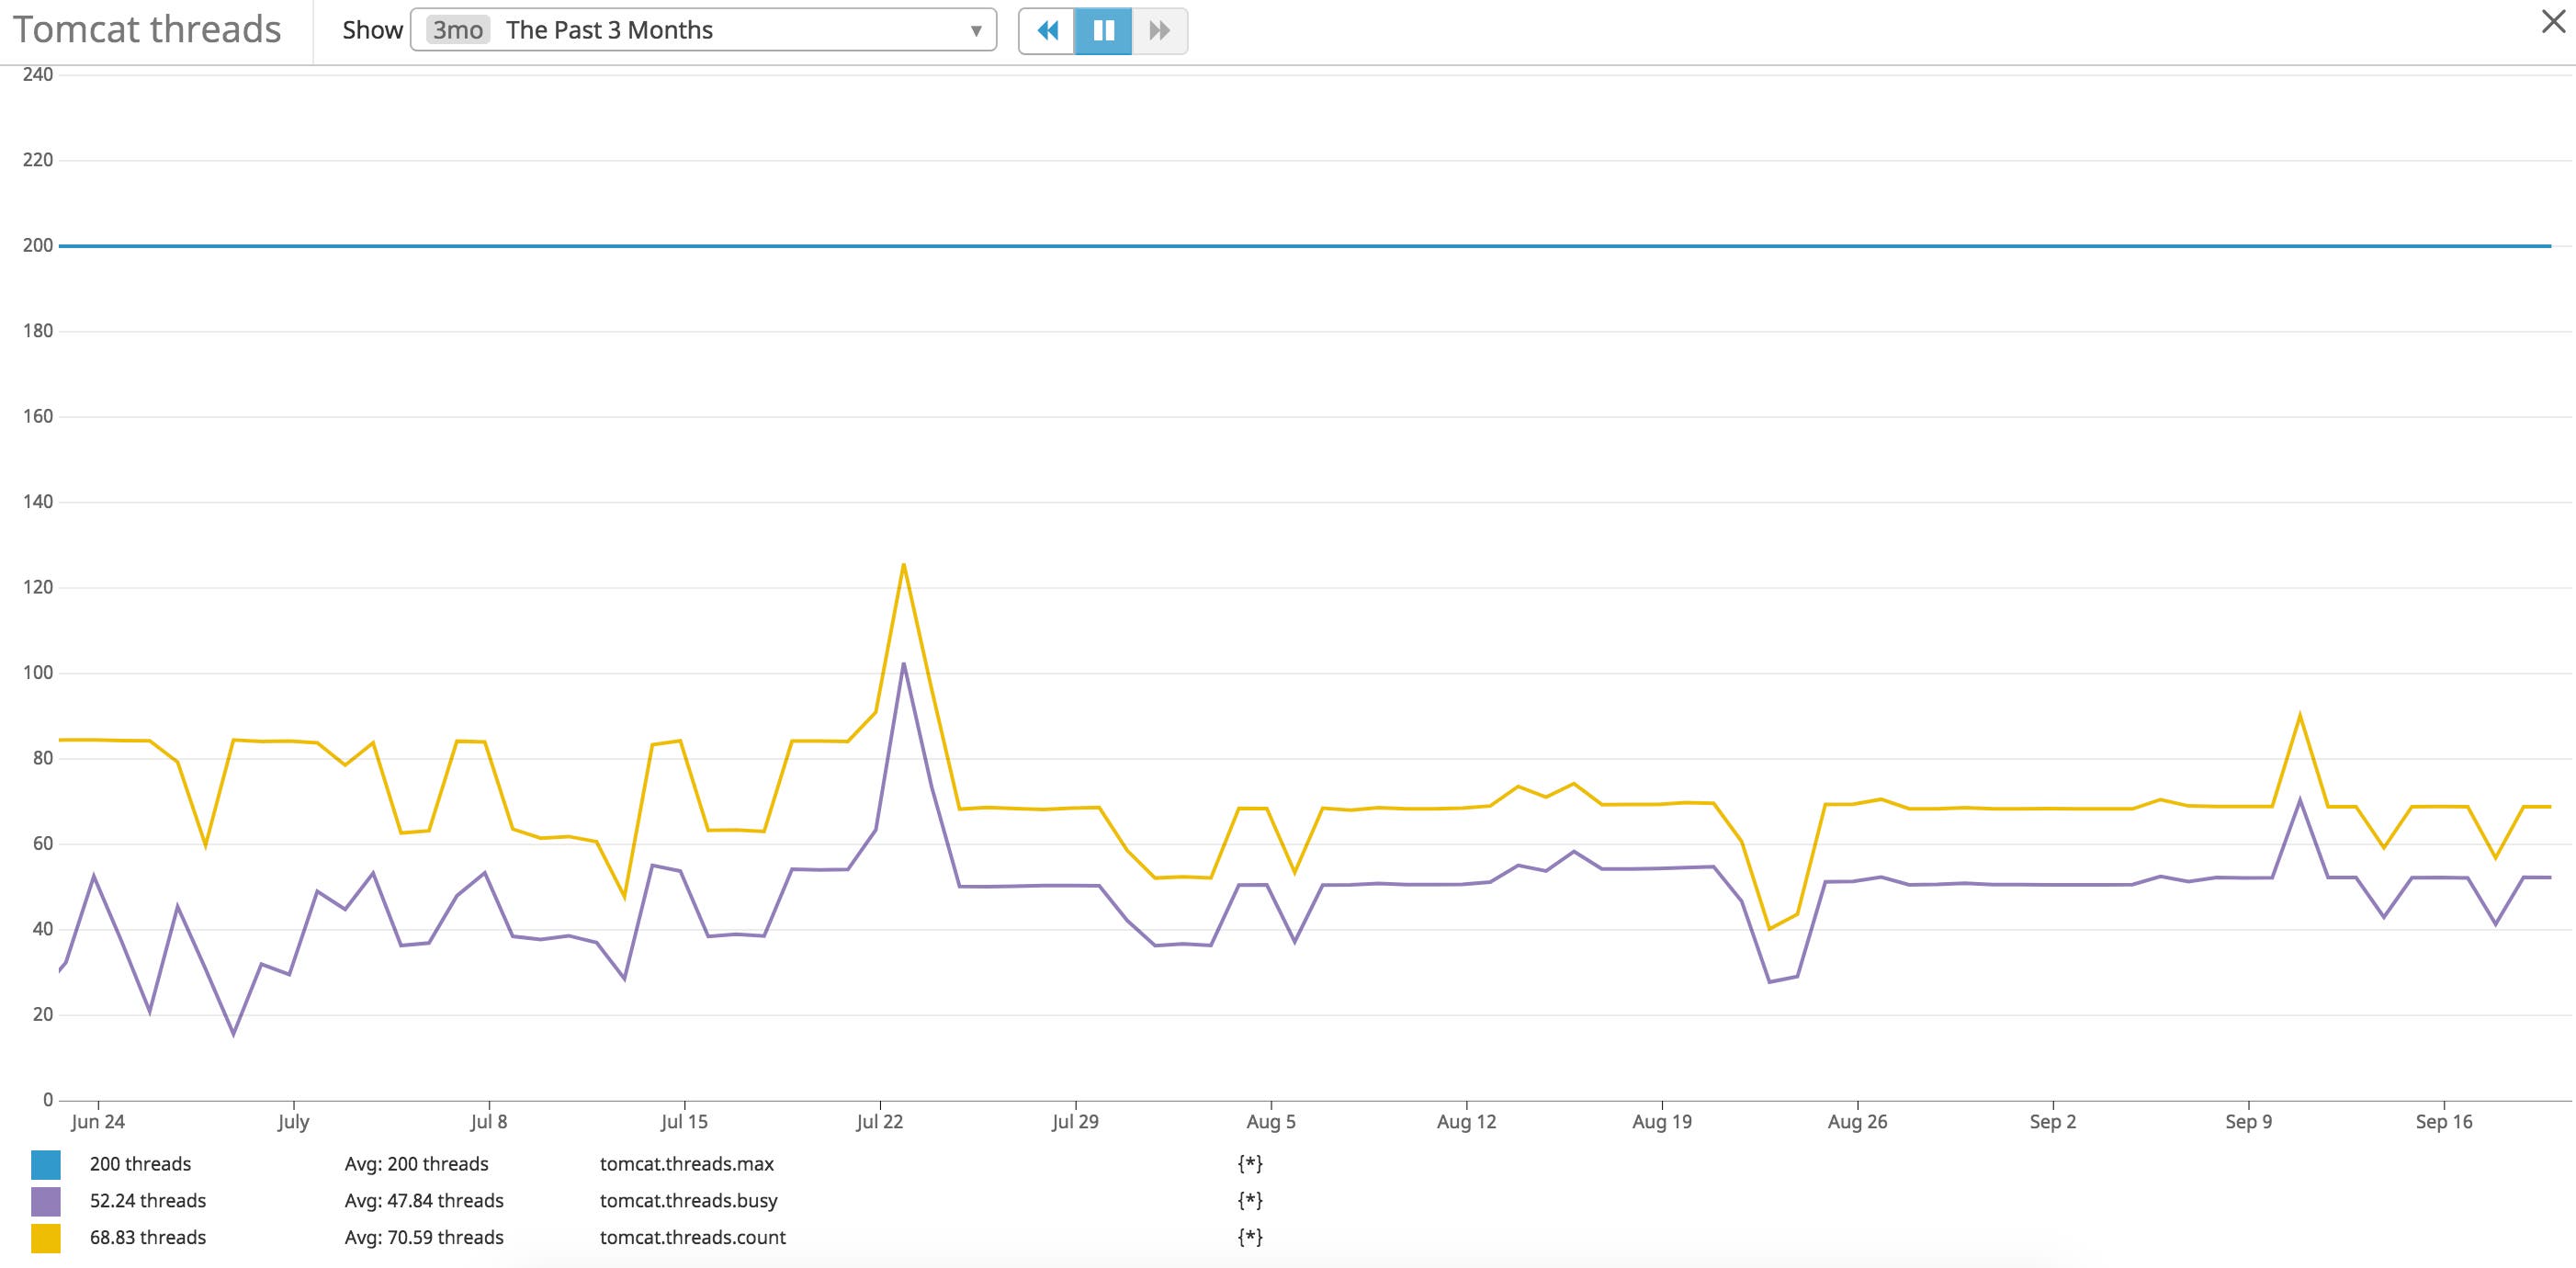
Tomcat manages the workload for processing requests with worker threads and tracks thread usage for each connector under either the ThreadPool MBean type, or the Executor Mbean type if you are using an executor. The Executor MBean type represents the thread pool created for use across multiple connectors. The ThreadPool MBean type shows metrics for each Tomcat connector’s thread pool. Depending on how you are prioritizing server loads for your applications, you may be managing a single connector, multiple connectors, or using an executor thread pool to manage another group of connectors within the same server.
It’s important to note that Tomcat maps ThreadPool’s currentThreadsBusy to the Executor’s activeCount and maxThreads to maximumPoolSize, meaning that the metrics to watch remain the same between the two.
ThreadPool
| JMX Attribute | Description | MBean | Metric Type |
|---|---|---|---|
| currentThreadsBusy | The number of threads currently processing requests | Catalina:type=ThreadPool,name=“http-nio-8080” | Resource: Utilization |
| maxThreads | The maximum number of threads to be created by the connector and made available for requests | Catalina:type=ThreadPool,name=“http-nio-8080” | Resource: Utilization |
Executor
| JMX Attribute | Description | MBean | Metric Type |
|---|---|---|---|
| activeCount | The number of active threads in the thread pool | Catalina:type=Executor,name=“http-nio-8080” | Resource: Utilization |
| maximumPoolSize | The maximum number of threads available in the thread pool | Catalina:type=Executor,name=“http-nio-8080” | Resource: Utilization |
Metric to watch: currentThreadsBusy/activeCount
The currentThreadsBusy (ThreadPool) and activeCount (Executor) metrics tell you how many threads from the connector’s pool are currently processing requests. As your server receives requests, Tomcat will launch more worker threads if there are not enough existing threads to cover the workload, until it reaches the maximum number of threads you set for the pool. This is represented by maxThreads for a connector’s thread pool and maximumPoolSize for an executor. Any subsequent requests are placed in a queue until a thread becomes available.
If the queue becomes full then the server will refuse any new requests until threads become available. It’s important to watch the number of busy threads to ensure it doesn’t reach the value set for maxThreads, because if it consistently hits this cap, then you may need to adjust the maximum number of threads allotted for the connector.
With a monitoring tool, you can calculate the number of idle threads by comparing the current thread count to the number of busy threads. The number of idle vs. busy threads provides a good measure for fine-tuning your server. If your server has too many idle threads, it may not be managing the thread pool efficiently. If this is the case, you can lower the minSpareThreads value for your connector, which sets the minimum number of threads that should always be available in a pool (active or idle). Adjusting this value based on your application’s traffic will ensure there is an appropriate balance between busy and idle threads.
Fine-tuning Tomcat thread usage
Not having the appropriate number of threads for Tomcat is one of the more common causes for server issues, and adjusting thread usage is an easy way to address this problem. You can fine-tune thread usage by adjusting three key parameters for a connector’s thread pool based on anticipated web traffic: maxThreads, minSpareThreads, and acceptCount. Or if you are using an executor, you can adjust values for maxThreads, minSpareThreads, and maxQueueSize.
Below is an example of the server’s configuration for a single connector:
<Connector port="8443" protocol="org.apache.coyote.http11.Http11NioProtocol" maxThreads="<DESIRED_MAX_THREADS>" acceptCount="<DESIRED_ACCEPT_COUNT>" minSpareThreads="<DESIRED_MIN_SPARETHREADS>"></Connector>Or for an executor:
<Executor name="tomcatThreadPool" namePrefix="catalina-exec-" maxThreads="<DESIRED_MAX_THREADS>" minSpareThreads="<DESIRED_MIN_SPARETHREADS>"> maxQueueSize="<DESIRED_QUEUE_SIZE>"/>
<Connector executor="tomcatThreadPool" port="8080" protocol="HTTP/1.1" connectionTimeout="20000"></Connector>
<Connector executor="tomcatThreadPool" port="8091" protocol="HTTP/1.1" connectionTimeout="20000"></Connector>If these parameters are set too low then the server will not have enough threads to manage the number of incoming requests, which could lead to longer queues and increased request latency. If the values are set too high or too low, then your server could receive an influx of requests it can’t adequately process, maxing out the worker threads and the request queue. This could cause requests in the queue to time out if they have to wait longer than the value set for the server’s connectionTimeout. A high value for maxThreads or minSpareThreads also increases your server’s startup time, and running a larger number of threads consumes more server resources.
If processing time increases as the traffic to your server increases, you can start addressing this issue by first increasing the number of maxThreads available for a connector, which will increase the number of worker threads that are available to process requests. If you still notice slow request processing times after you’ve increased the maxThreads parameter, then your server’s hardware may not be equipped to manage the growing number of worker threads processing incoming requests. In this case, you may need to increase server memory or CPU.
While monitoring thread usage, it’s important to also keep track of errors that could indicate that your server is misconfigured or overloaded. For example, Tomcat will throw a RejectedExecutionException error if the executor queue is full and can’t accept another incoming request. You will see an entry in Tomcat’s server log (/logs/Catalina.XXXX-XX-XX.log) similar to the following example:
WARNING: Socket processing request was rejected for: <socket handle>java.util.concurrent.RejectedExecutionException: Work queue full. at org.apache.catalina.core.StandardThreadExecutor.execute at org.apache.tomcat.util.net.(Apr/Nio)Endpoint.processSocketWithOptions at org.apache.tomcat.util.net.(Apr/Nio)Endpoint$Acceptor.run at java.lang.Thread.runErrors
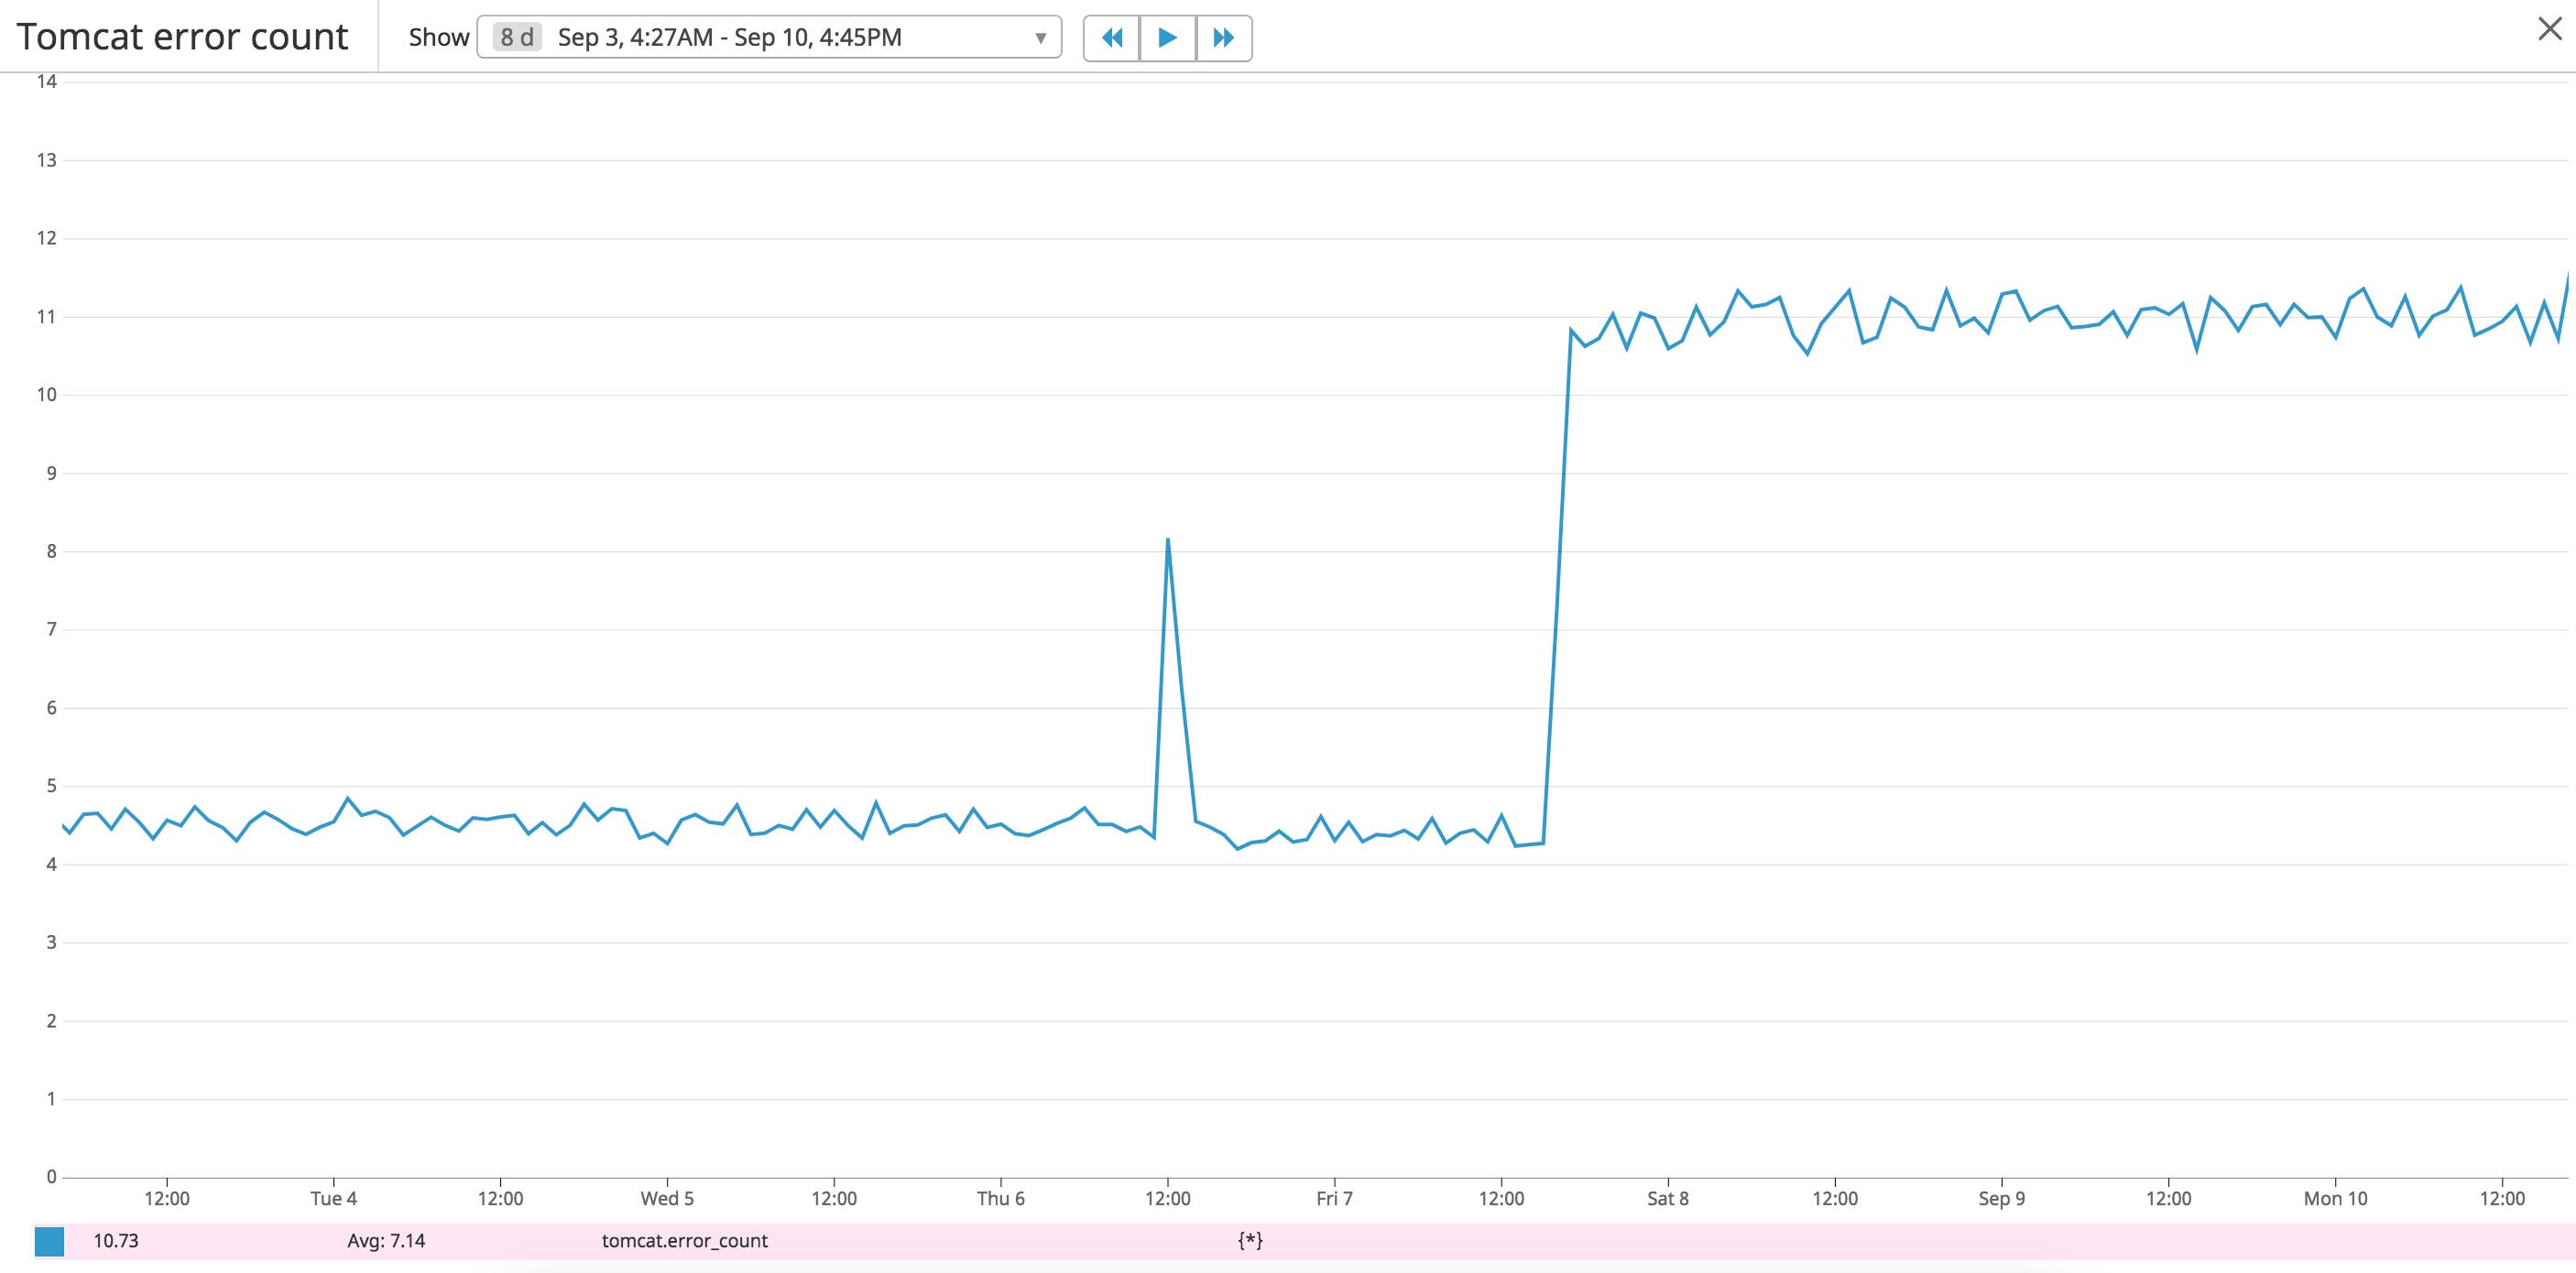
Errors indicate an issue with the Tomcat server itself, a host, a deployed application, or an application servlet. This includes errors generated when the Tomcat server runs out of memory, can’t find a requested file or servlet, or is unable to serve a JSP due to syntax errors in the servlet codebase.
| JMX Attribute/Log Metric | Description | MBean/Log Pattern | Metric Type | Availability |
|---|---|---|---|---|
| errorCount | The number of errors generated by server requests | Catalina:type=GlobalRequestProcessor,name=“http-bio-8888” | Work: Error | JMX |
| OutOfMemoryError | Indicates the JVM has run out of memory | N/A | Work: Error | Tomcat logs |
| Server-side errors (5xx) | Indicates the server is not able to process a request | %s | Work: Error | Access logs |
| Client-side errors (4xx) | Indicates an issue with the client’s request | %s | Work: Error | Access logs |
While the errorCount metric alone doesn’t provide any insight into the types of errors Tomcat is generating, it can provide a high-level view of potential issues that warrant investigation. You’ll need to supplement this metric with additional information from your access logs to get a clearer picture of the types of errors your users are encountering.
Metric to watch: OutOfMemoryError
While there are different types of OOME exceptions, the most common one is java.lang.OutOfMemoryError: Java heap space, which you will see when an application can not add any more data into memory (heap space area). Tomcat will include these errors in its Catalina server logs:
org.apache.catalina.core.StandardWrapperValve invokeSEVERE: Servlet.service() for servlet [jsp] in context with path [/sample] threw exception [javax.servlet.ServletException: java.lang.OutOfMemoryError: Java heap space] with root causejava.lang.OutOfMemoryError: Java heap spaceIf you see this error, then you will need to restart your server to recover. If it continues to happen then you may need to increase the heap space for the JVM. Monitoring and alerting on the HeapMemoryUsage metric can also help you take the steps needed to limit the number of times the server generates these errors.
Metric to alert on: Server-side errors
It’s difficult to investigate the root cause of a sudden drop in request counts and processing time without consulting your error logs. Correlating throughput metrics with the error rate can pinpoint a starting point for investigating critical issues. You should set up alerts to get notified about a spike in your server-side error rate, so you can quickly address problems related to Tomcat or your deployed application. You can also consult Tomcat’s access logs to get more details about each request that generated an error, including the HTTP status code, processing time, and request method:
192.168.33.1 - - [05/Dec/2018:20:54:40 +0000] "GET /examples/jsp/error/err.jsp?name=infiniti&submit=Submit HTTP/1.1" 500 123 53Metric to watch: Client-side errors
Client-side errors (4xx) indicate problems with accessing files or pages such as insufficient permissions or missing content. You can view Tomcat’s access logs to pinpoint the specific page or file related to each error:
192.168.33.1 - - [05/Dec/2018:20:54:26 +0000] "GET /sample HTTP/1.1" 404 - 0Though these errors don’t indicate critical problems with the server itself, they do impact how clients interact with your application(s).
JVM memory usage
Your server’s throughput, thread usage, and error rates only provide part of the data you’ll need to implement a comprehensive monitoring strategy. Tomcat (and your servlets) rely on having enough available memory to operate efficiently, so it’s important to also keep track of the memory usage of your JVM. You can monitor your virtual machine using the JVM’s built-in tools like JConsole to view its registered MBeans on the JMX MBean server. We’ll cover how to view these metrics in Part 2.
| JMX Attribute | Description | MBean | Metric Type | | ----------- | ---------- | --------------- | -------------- | ------- | | HeapMemoryUsage | The amount of heap memory used by Tomcat | java.lang:type=memory | Resource: Utilization | | CollectionCount | The cumulative number of invoked garbage collections since the start of the server | java.lang:type=GarbageCollector,name=(PS MarkSweep|PS Scavenge) | Other |
The JVM uses two garbage collectors for managing memory: PS MarkSweep for old generation and PS Scavenge for young generation. Old and young generation memory each represent smaller spaces or generations of a JVM’s heap memory. All new objects are allocated in young generation memory, where they are either picked up by the PS Scavenge collector or aged in preparation for moving to old generation memory. The old generation space holds objects that are in use for longer periods of time; once they are no longer in use, they are picked up by the PS MarkSweep garbage collector. You can review metrics for either type by querying based on the name of the collector.
Metric to alert on: HeapMemoryUsage
You can query the HeapMemoryUsage attribute for committed, init, max, and used memory:
- Max: the total amount of memory you allocate to the JVM for memory management.
- Committed: the amount of memory guaranteed to be available for the JVM. This amount changes based on memory usage, and increases up to the max value set for the JVM.
- Used: the amount of memory currently used by the JVM (e.g., applications, garbage collection).
- Init: the initial amount of memory requested by the JVM from the OS at startup.
The used and committed values are particularly beneficial to monitor, since they reflect how much memory is currently in use, as well as the amount of memory available on the JVM. You can compare these values against the maximum amount of memory set for the JVM. As the JVM uses more memory, it will increase the amount of committed memory, up to the max value.
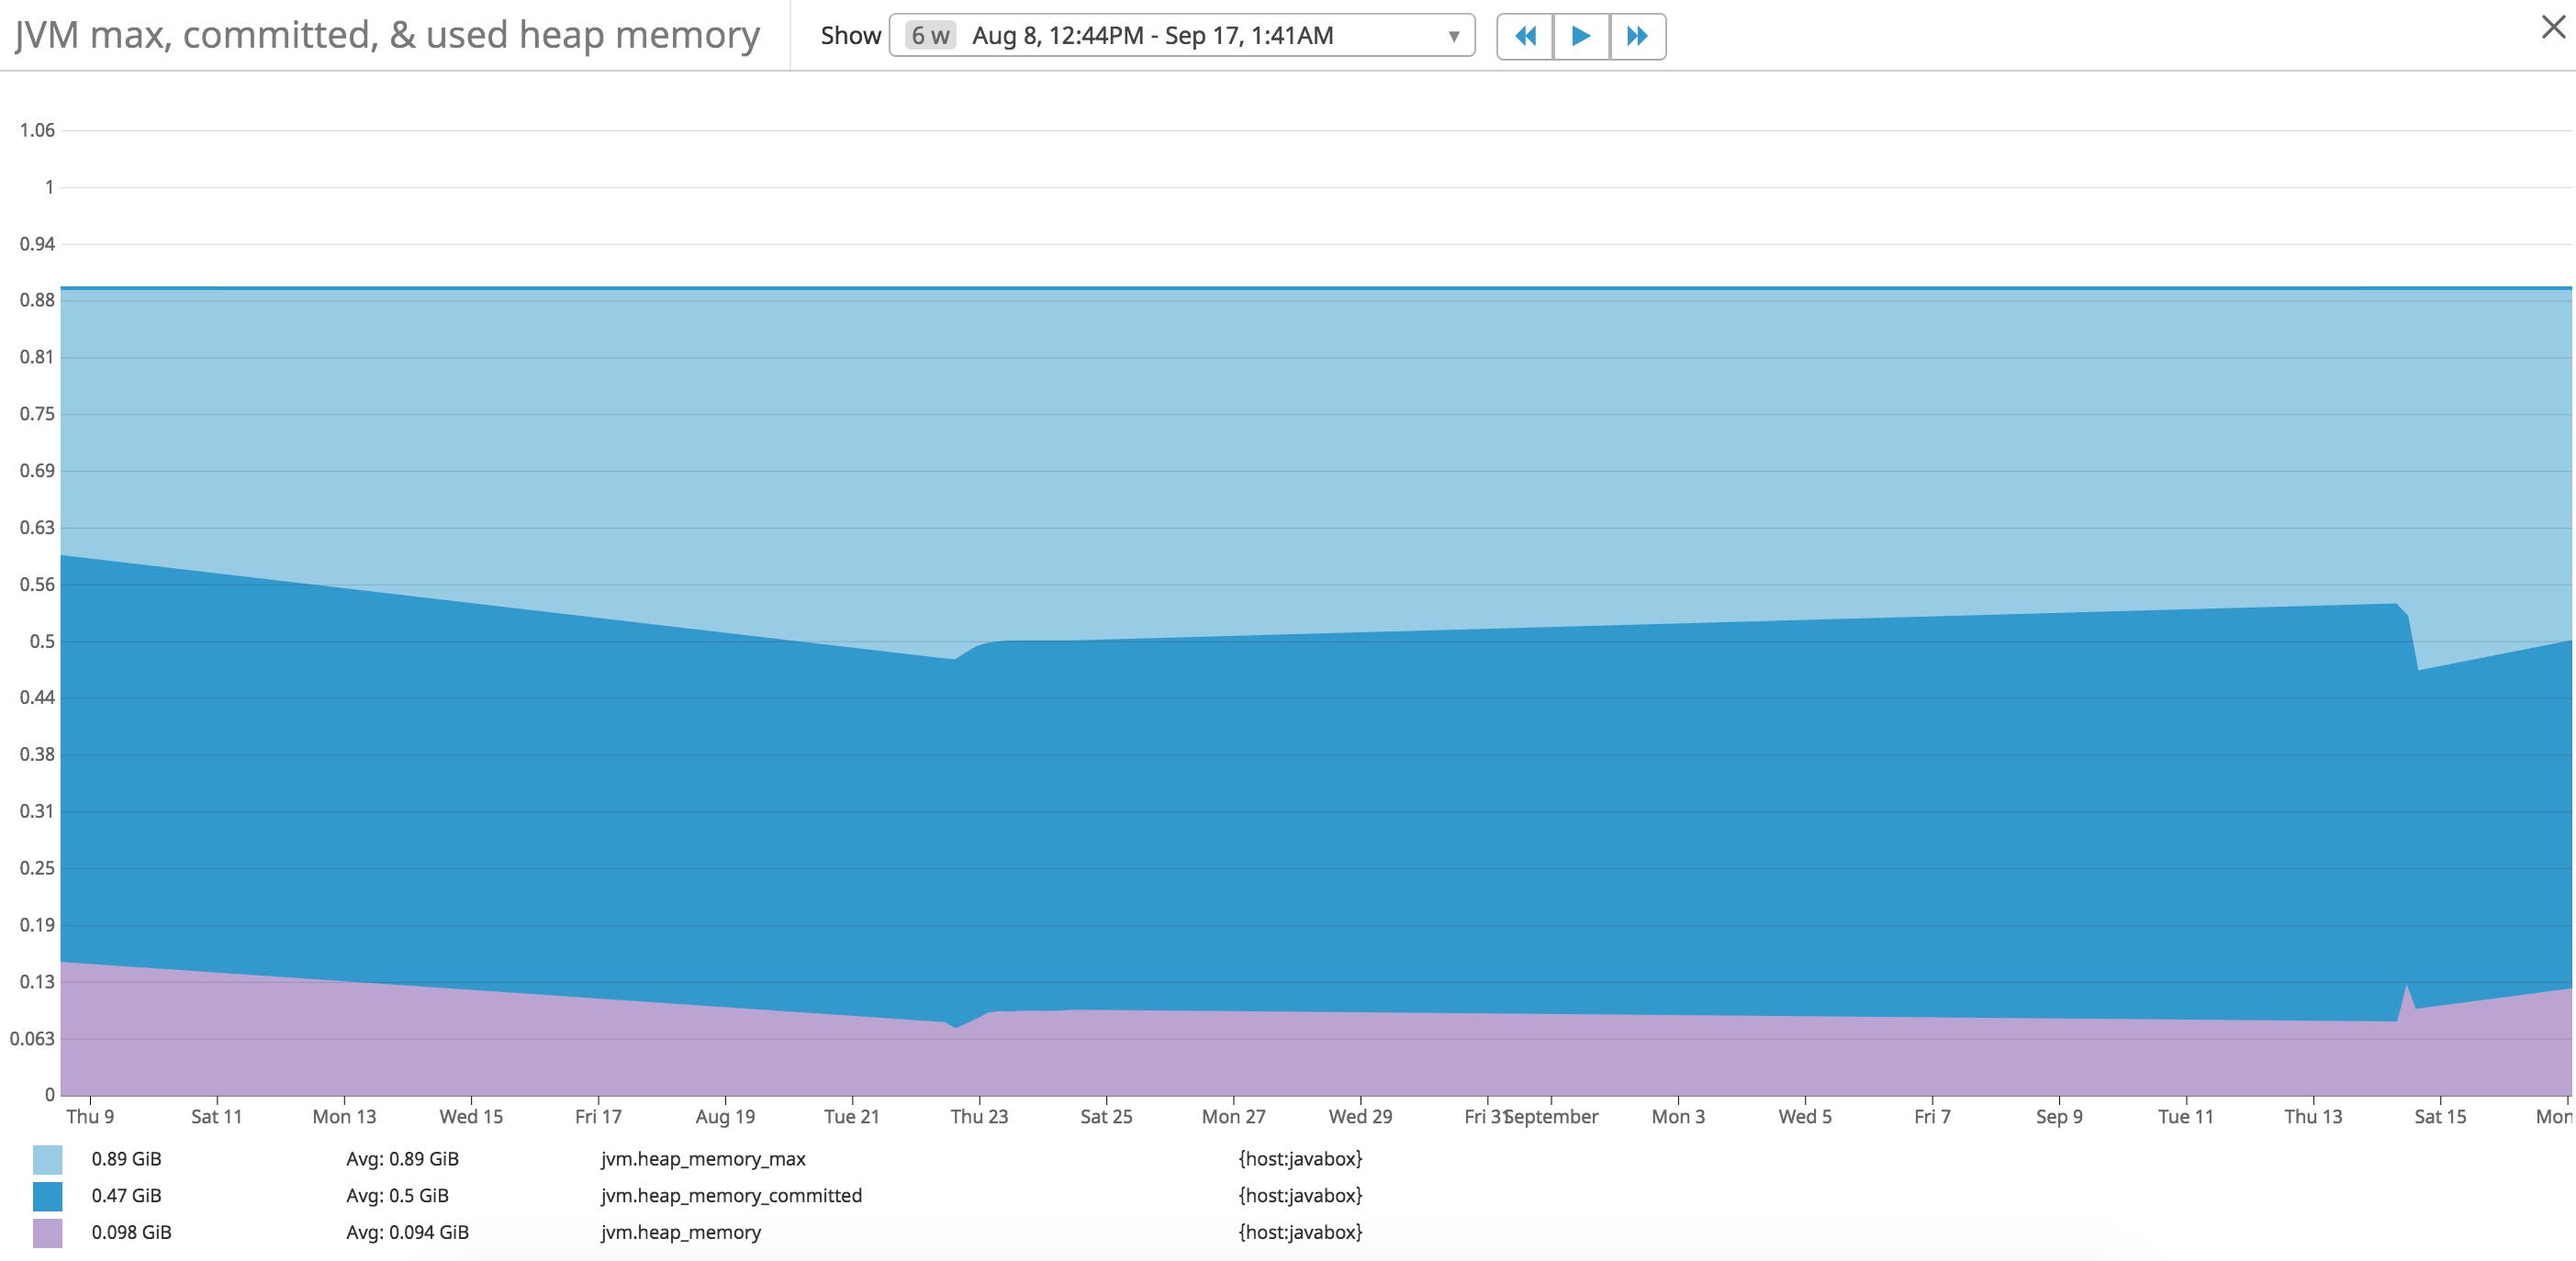
If there isn’t enough memory to create new objects needed by application servlets, and garbage collection can’t free up enough memory, then the JVM will throw an OutOfMemoryError (OOME) exception.
Running out of memory is one of the more common issues with Tomcat’s JVM so monitoring heap memory usage enables you to be proactive and ensure this doesn’t occur. You can create an alert to notify you when the JVM is currently using a high percentage of its maximum (allocated) memory.
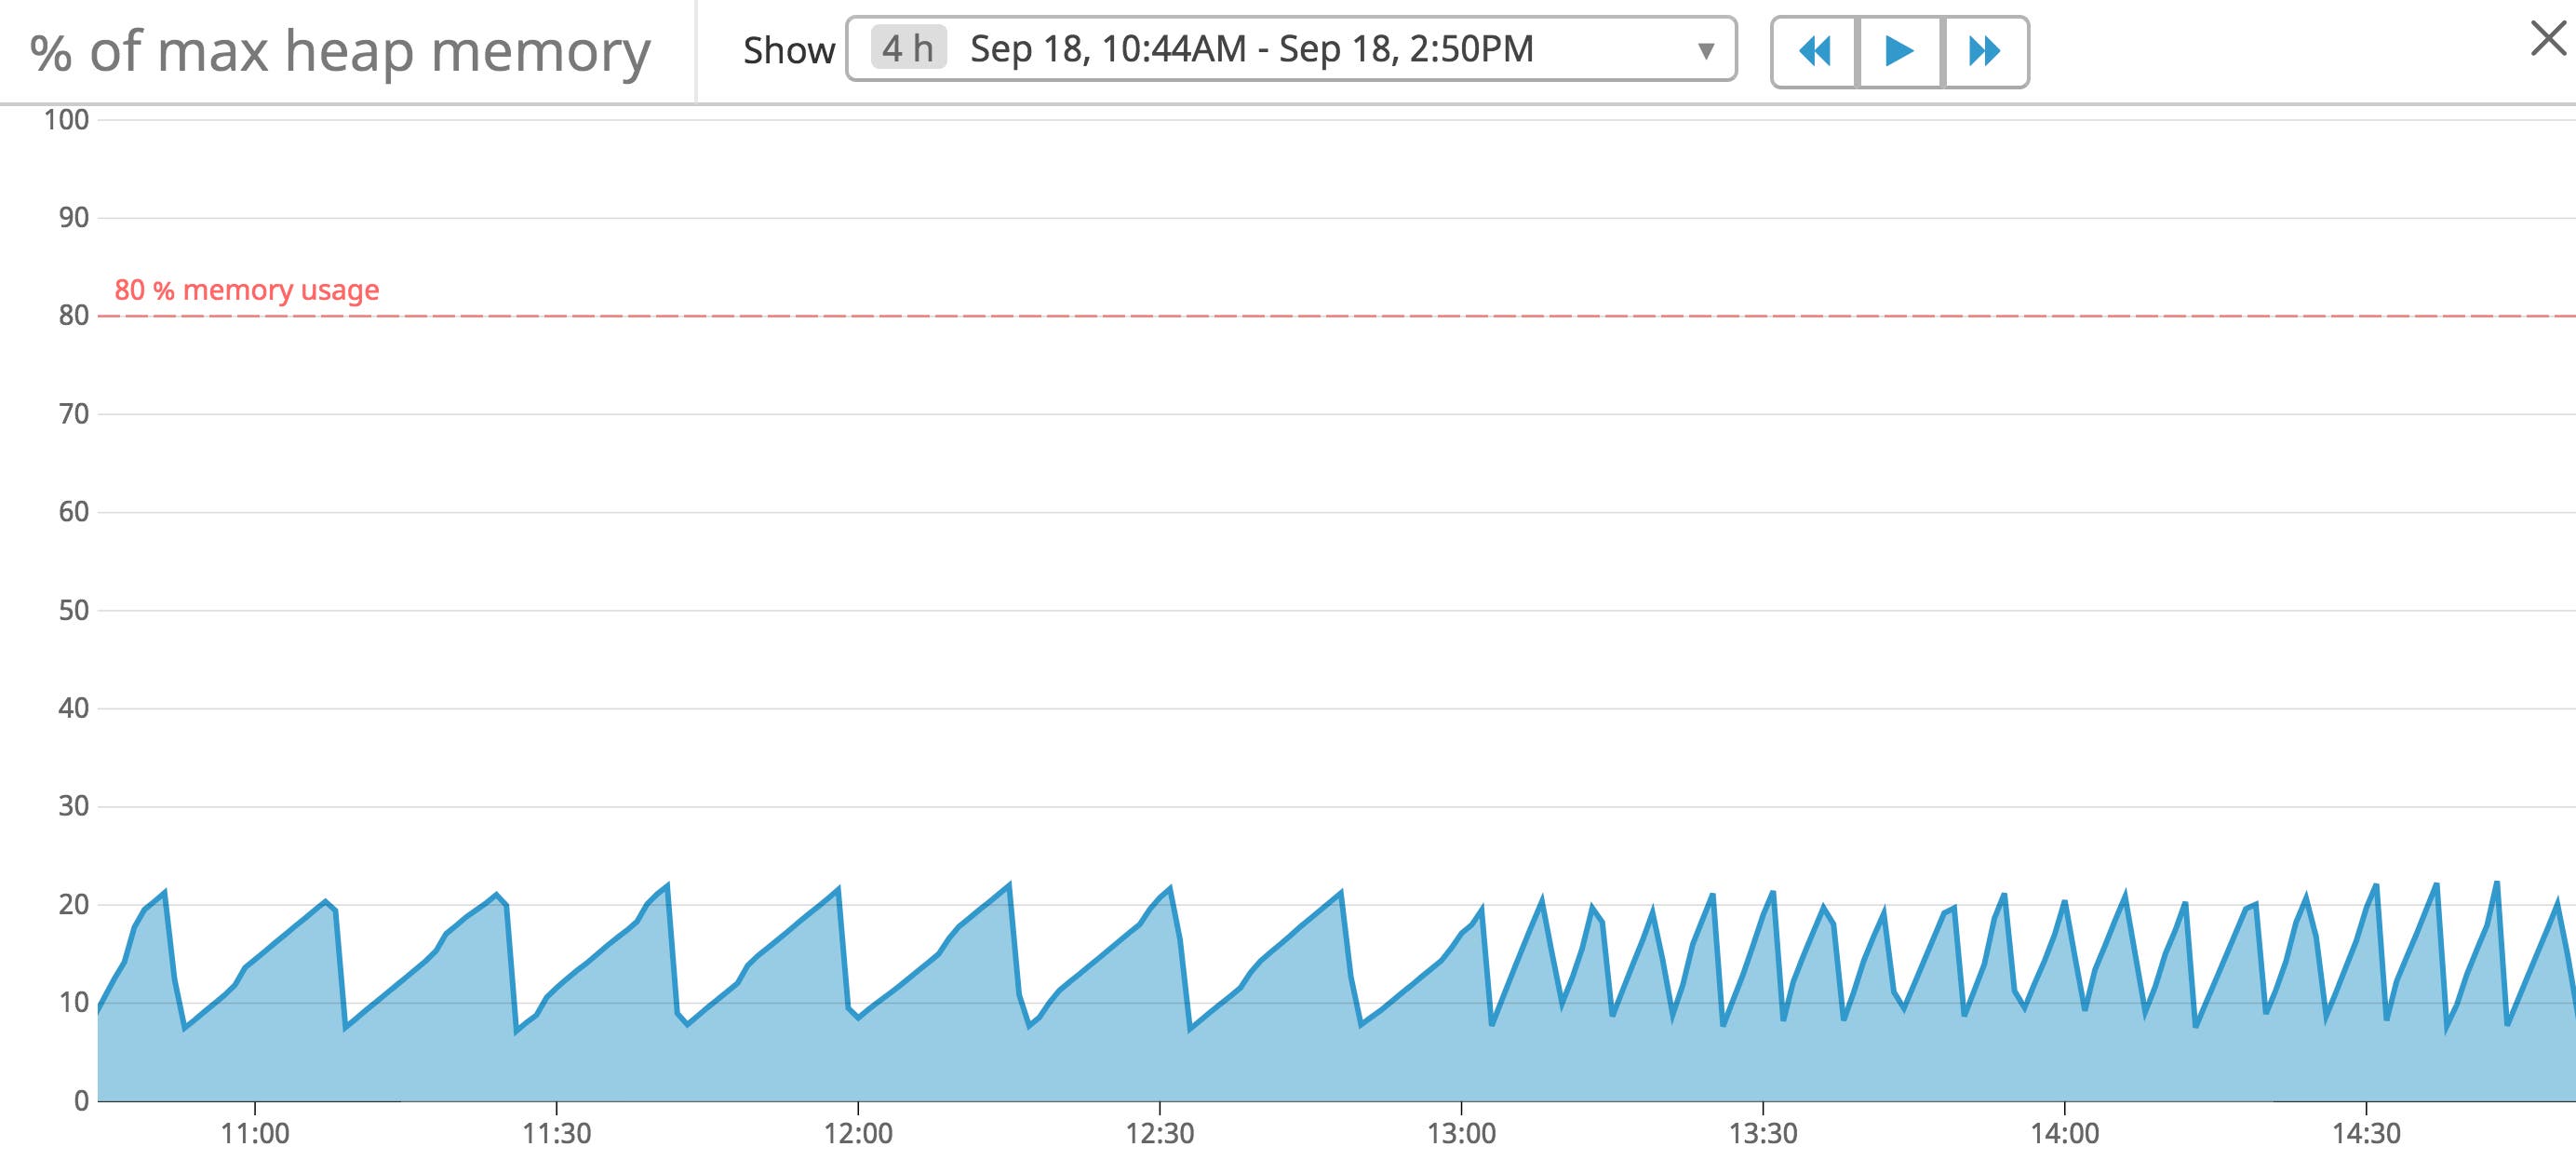
In the example image above, you can see a sawtooth pattern that reflects typical memory usage. It shows the JVM consuming memory and garbage collection freeing up memory at regular intervals. There are a few scenarios that cause the JVM to run out of memory, including memory leaks, insufficient server hardware, and excessive garbage collections. Garbage collection metrics are another component of comprehensive monitoring for Tomcat. If garbage collections are occurring too frequently and not freeing up enough memory, then the JVM will eventually run out of resources that Tomcat needs in order to continue serving your applications.
Metric to watch: CollectionCount
Garbage collection reclaims used memory but also consumes a lot of memory when invoked. JMX includes metrics for monitoring garbage collections, which can help locate the source of memory leaks. The JMX MBean server includes a CollectionCount metric that shows the number of collections that have occurred since the server started. This value will gradually increase under normal conditions, but you can use a monitoring tool to calculate how many collections occur over a certain period of time.

A sudden spike or increase in garbage collection frequency, as seen in the image above, could indicate a memory leak or inefficient application code. In the next part of this series, we’ll show you how to use Tomcat’s application manager to troubleshoot memory leaks. For a little more context around the state of your JVM before and after a garbage collection, you can look at the LastGcInfo MBean in monitoring tools such as JConsole or JavaMelody.
As a part of the GcInfo class, this attribute provides information about the start time, end time, duration, and memory usage before and after the last garbage collection. This will help you determine if garbage collections are freeing up memory as expected by showing usage values before and after a collection. If these values don’t differ much then it could mean the collector isn’t freeing up enough memory. Garbage collectors also pause all other JVM activity, temporarily halting Tomcat as a result.
Monitoring garbage collection count is important since a high frequency of garbage collections can quickly consume JVM memory, and disrupt service for clients accessing your applications. These metrics provide a more complete picture of the performance of Tomcat. If you find that the server isn’t running efficiently, there are a few steps you can take to better optimize performance.
Fine-tuning JVM memory usage and garbage collections
If you need to change your JVM’s heap memory usage, you should consider how much physical memory is available on the machine running the JVM. Apache recommends increasing the JVM’s maximum heap size to give Tomcat more memory. Allocating more memory to the JVM heap helps limit the number of times the JVM needs to free up memory by running garbage collection (which is a memory-heavy process in and of itself). If Tomcat has more memory, it can also process requests more quickly, which helps speed up processing times for your applications.
On startup, the JVM reserves a certain amount of memory for use. This amount can be set with the initial and minimum (-Xms) and maximum (-Xmx) heap size parameters. At each garbage collection, the JVM will try to keep the minimum and maximum amount of available memory within that range. This gives you a little more control over the JVM’s memory usage. You can set these values for the JVM by including the following variables in Tomcat’s bin/setenv.sh environment script:
export CATALINA_OPTS="-Xms1024M -Xmx1024M"Oracle recommends setting initial and maximum heap size parameters with the same value to minimize the number of times garbage collection is invoked. You can check out the official Oracle documentation for more information on tuning the JVM.
Working with Tomcat metrics
There are many moving pieces for running applications on Tomcat, so it’s crucial to incorporate monitoring for each Tomcat element. This not only includes metrics for the servlets and JSP pages that make up an application, but the metrics for the Tomcat server and JVM. Now that you know which metrics are most important for Tomcat monitoring, you can use tools such as Tomcat’s built-in web management interface and JConsole to easily view metric data. In the next part of this series, we’ll show you how to configure Tomcat and enable JMX remote for metric collection. In Part 3 of this series, we’ll walk through how you can use Datadog to monitor Tomcat application performance, metrics, and logs.
Source Markdown for this post is available on GitHub. Questions, corrections, additions, etc.? Please let us know.
Acknowledgments
We’d like to thank Christopher Schultz and Mark Thomas from the Apache Tomcat project for their technical reviews of Part 1 of this series.


