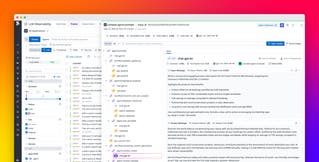
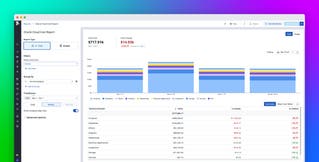
In October’s episode of This Month in Datadog, Jeremy shows how you can use AI to query with natural language in DDSQL Editor, ensure teams stay continually updated during outages, mitigate the impact of flaky tests, and ingest OpenTelemetry Protocol (OTLP) metrics from serverless and third-party SaaS environments.
Later in the episode, Kayla spotlights how to easily compare instance costs and performance with Instance Explorer and monitor Oracle Cloud Infrastructure (OCI) spend with Cloud Cost Management’s (CCM) new integration.
We also look at how Datadog’s ecosystem is evolving to support whatever you’re building next, and a blog series about how Datadog combined its SRE and security teams.
New features
Optimize your spend with new CCM releases
Take the guesswork out of choosing instances with Datadog’s Instance Explorer, which lets you compare the cost and performance of instances across AWS, Azure, and Google Cloud.
You can also track your OCI spend with CCM using our new integration, which enables you to monitor, visualize, and optimize your OCI costs in one place.
Query with natural language in DDSQL Editor
Imagine asking a question in natural language and getting a ready-to-run SQL query. With DDSQL Editor’s new feature, you can automatically generate and edit queries by using AI, with no SQL expertise required. This makes it easier to explore Datadog telemetry data and accelerate workflows, such as ad hoc operational analysis.
Keep teams aligned during outages
It’s never been easier to keep teams informed during outages. With External Provider Status, you get near real-time visibility into the health of more than 40 providers, including SaaS APIs, like GitHub and OpenAI, as well as AWS services across regions.
With Datadog Status Pages, you can keep stakeholders aligned and informed during outages and service disruptions. Create and update notices directly in Datadog showing which services are impacted, the current status of each component, and a full timeline of updates.
We’ve also released Updog.ai, a public-facing web page that shows the live health status of more than 30 SaaS providers. Built on anonymized observability data and AI at internet scale, Updog.ai is a comprehensive public resource for real-time service transparency.
Mitigate the impact of problematic tests with Flaky Test Management
Re—running flaky tests can take hours, but ignoring them erodes developer confidence in CI pipelines. Flaky Test Management offers a centralized view to track and manage problematic tests. Monitor metrics like pipelines failed, time lost, and failure rate. You can also quarantine tests, or disable them entirely.
Ingest OpenTelemetry Protocol metrics with the Datadog OTLP Metrics API
Our new OTLP API lets you ingest metrics from serverless and third-party SaaS environments where collectors can’t be deployed. Now you can gather metrics from managed OTel collectors, and send OTLP metrics to our platform from serverless applications–all without deploying a collector or our Agent.
Additional updates
Other features and updates released this month include:
- Test out new prompts and models with Datadog LLM Observability’s Experiments feature
- Easily investigate failed mobile tests with Video Replay
- Forward runtime security alerts using our Falco integration
- Join Reference Tables with more sources and preview data directly in the graph editor
See you next month
This Month in Datadog is a monthly roundup of our latest features, product announcements, and more. Subscribe to the Datadog YouTube channel to get notified when future episodes are live.
In the meantime, check out our release notes for a full list of new features and updates. Or see them in action by logging in to the Datadog platform or signing up for a 14-day free trial. See you next month!


