Candace Shamieh

Alex Guo
Steadybit is a software reliability platform that uses chaos engineering and fault injection to help organizations improve the stability and performance of their applications. By allowing customers to simulate turbulent scenarios in a controlled environment, Steadybit enables you to identify and mitigate potential system issues to reduce downtime and improve resilience.
We’re pleased to announce that Datadog is partnering with Steadybit to help you monitor and correlate the impact of your chaos engineering experiments. You can use Datadog’s preconfigured dashboards with your existing system metrics to optimize your application’s performance and refine your incident response process. Our partnership includes an integration that brings your Steadybit data into Datadog and a software license offering in the Datadog Marketplace.
In this post, we’ll cover how you can:
- Monitor chaos engineering experiments to optimize application performance
- Verify monitor configurations to refine your incident response process
Monitor chaos engineering experiments to optimize application performance
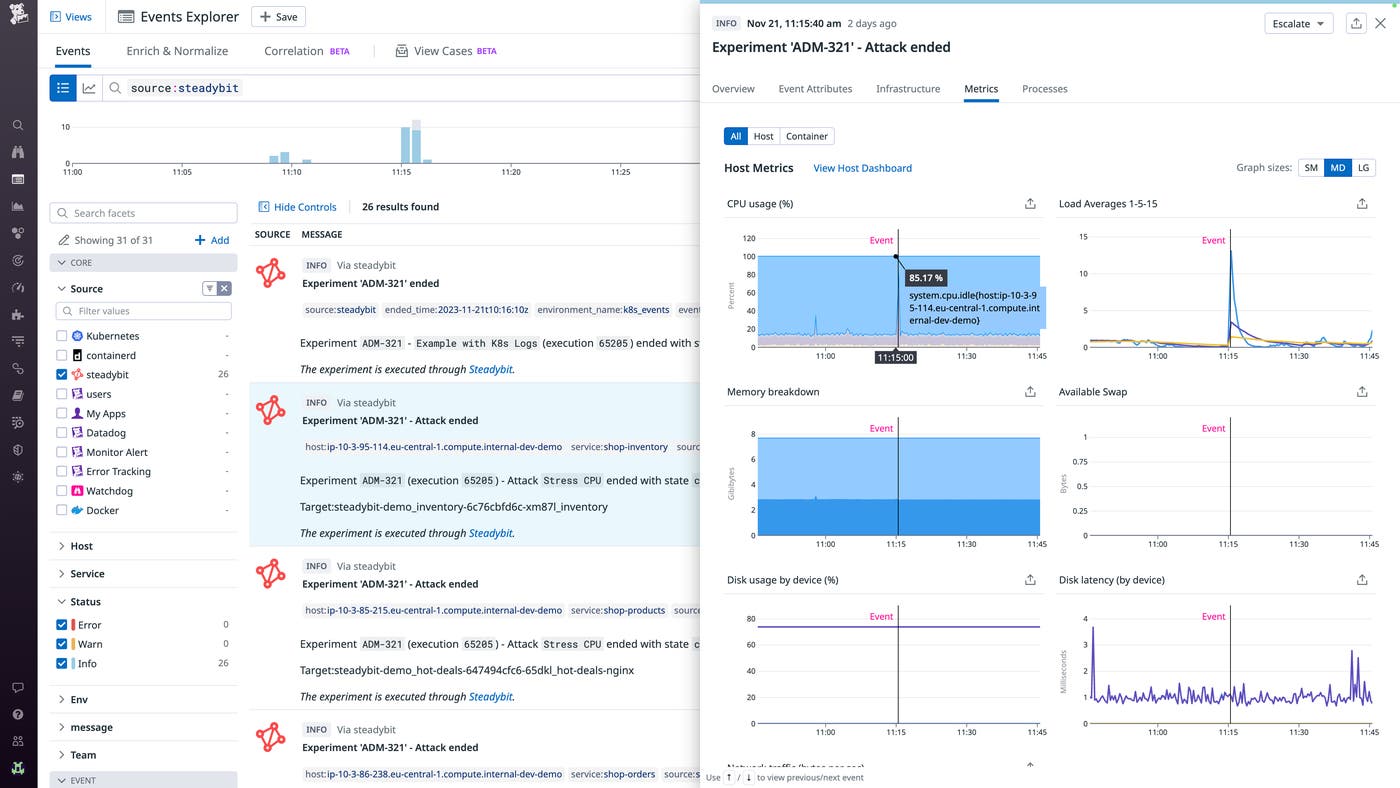
Once you install the Steadybit integration, all your chaos engineering activity—like experiment description and start time—will report into Datadog as events and be viewable in the Datadog Events Explorer. Steadybit events also include event overlays, allowing you to correlate metrics between events and targets. Targets describe the resources that you’re testing or attacking, such as your applications, containers, and hosts. You can use this event information to validate crucial infrastructure and application capabilities, such as auto-scaling functionality, and determine how your targets performed under the turbulent conditions simulated by the chaos engineering experiments. This validation ensures that your resources can provide a reliable service for your end users even under pressure.

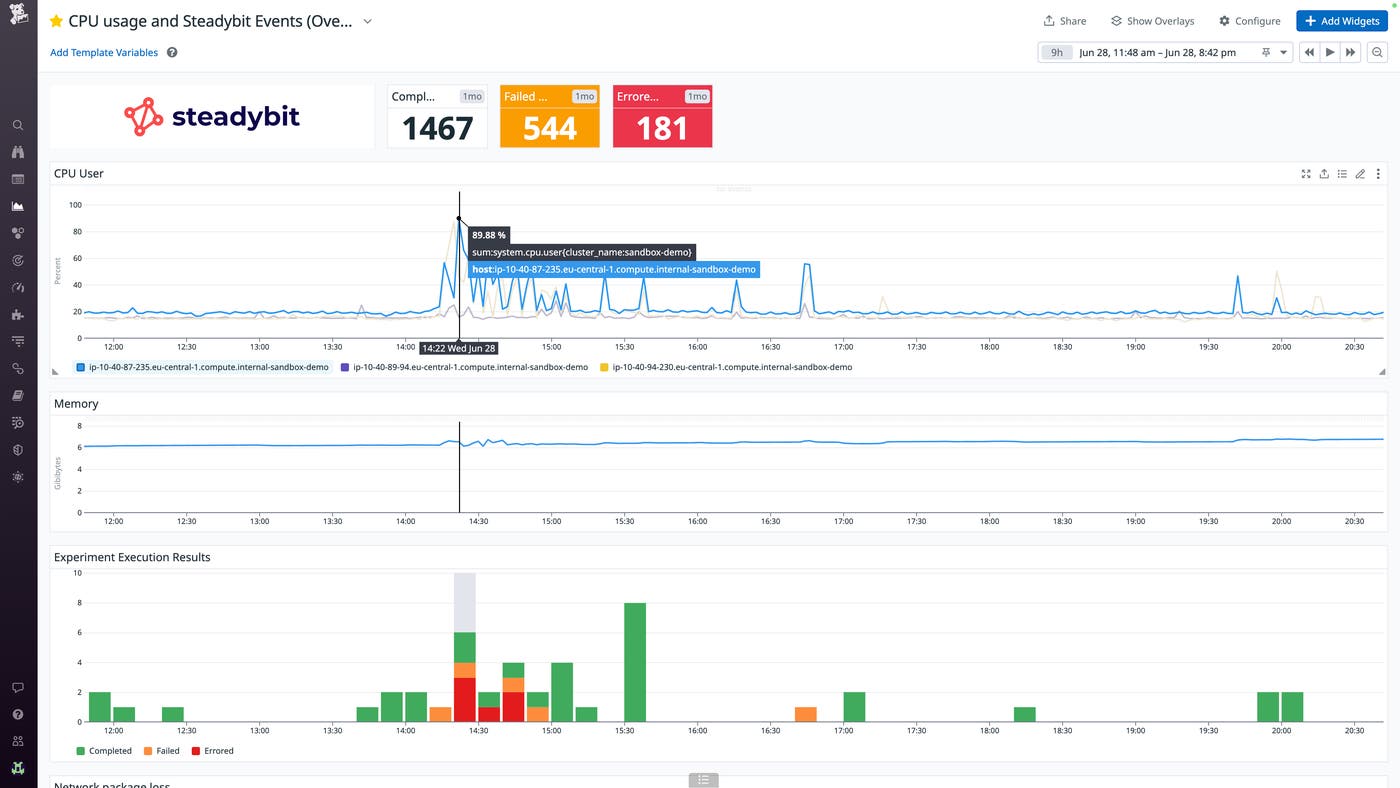
You can use the preconfigured Steadybit dashboard in the Datadog app to review your experiment execution results and add custom widgets, such as CPU usage and memory, that provide further insight into how your targets were impacted.

For example, let’s say you have an application that relies on external services or APIs and want to evaluate how it will react to increased network latency. From the Steadybit platform, you inject a 500-millisecond delay into the communication between your application and the API calls to the external service. As the tests run, you pivot to the Datadog Events Explorer to observe and track the impact on your application’s performance, looking out for issues like increased response times, timeouts, or error rates. Datadog’s Steadybit dashboard shows that the experiment ran successfully, so you quickly pivot back to Steadybit to review their risk assessment on your application’s reliability. After discussing the findings with your team, you decide to implement caching mechanisms that will store frequently accessed data locally. This will help reduce the number of repeated requests to external services and minimize the impact of increased network latency on your application.
Verify monitor configuration to refine incident response
In addition to optimizing performance, running regular experiments will help you identify potential vulnerabilities in your system and fine-tune your incident response process. While conducting experiments with Steadybit, you can verify that your Datadog monitors are detecting issues and sending effective alert notifications at appropriate times. Using Steadybit experiments to update monitor configurations helps you catch issues early and reduce system downtime.
Because all Steadybit injections appear in the Events Explorer, you can quickly see if an alert was triggered due to a Steadybit experiment. You can also avoid false alarms by muting your Datadog monitors and scheduling downtimes. When you create real-world incident scenarios and mute false alarms for tests, you’re also preparing an ideal environment to onboard DevOps, chaos, or site reliability engineers as they become an integral part of your incident response team.
Get more out of chaos engineering with Steadybit and Datadog
Steadybit and Datadog’s partnership enables you to be proactive in identifying how turbulent scenarios affect your infrastructure and applications, so you can take calculated steps to address monitoring challenges and create a more resilient system.
You can get started by purchasing the Steadybit integration in the Datadog Marketplace. If you don’t already have a Datadog account, you can sign up for a 14-day free trial today.
The ability to promote branded marketing tools is a membership benefit offered through the Datadog Partner Network. If you’re interested in developing an integration or application that you’d like to promote, you can contact us at marketplace@datadog.com.


