Alson Chan
In modern multi-cloud environments, even a small configuration change can ripple across dozens of services and make it hard to answer the key question during incidents: What changed? Although infrastructure as code (IaC) offers a structured view into planned updates, it often misses manual or unplanned changes that can lead to unexpected outages or degraded performance. As a result, teams are forced to piece together information to identify the root cause after an incident occurs. They must dig through logs, check various deployment tools, or even ask other teams what changed and when.
Datadog Snapshot Changes, available in Preview, helps address these visibility gaps by surfacing all relevant changes—regardless of their source—directly within the context of your existing observability workflows. Responders no longer need to pivot between multiple tools to correlate telemetry data with configuration events. Instead, they can inspect changes such as configuration updates, resource provisioning, and deployment activity directly from Monitor Status pages.
In this post, we’ll show you how to use Snapshot Changes within the Resource Changes feature to:
- Monitor changes across your multi-cloud infrastructure
- View infrastructure changes to your services and dependencies in context
- Search by changed fields and broaden your search to resolve similar issues
Monitor changes across your multi-cloud infrastructure
When developers or shared infrastructure teams are paged for an active incident, their immediate instinct is to identify recent changes. However, uncovering infrastructure configuration updates during the incident window can be difficult. This challenge increases in modern microservice architectures, where responsibility is distributed across teams and changes can originate from IaC deployments or manual interventions.
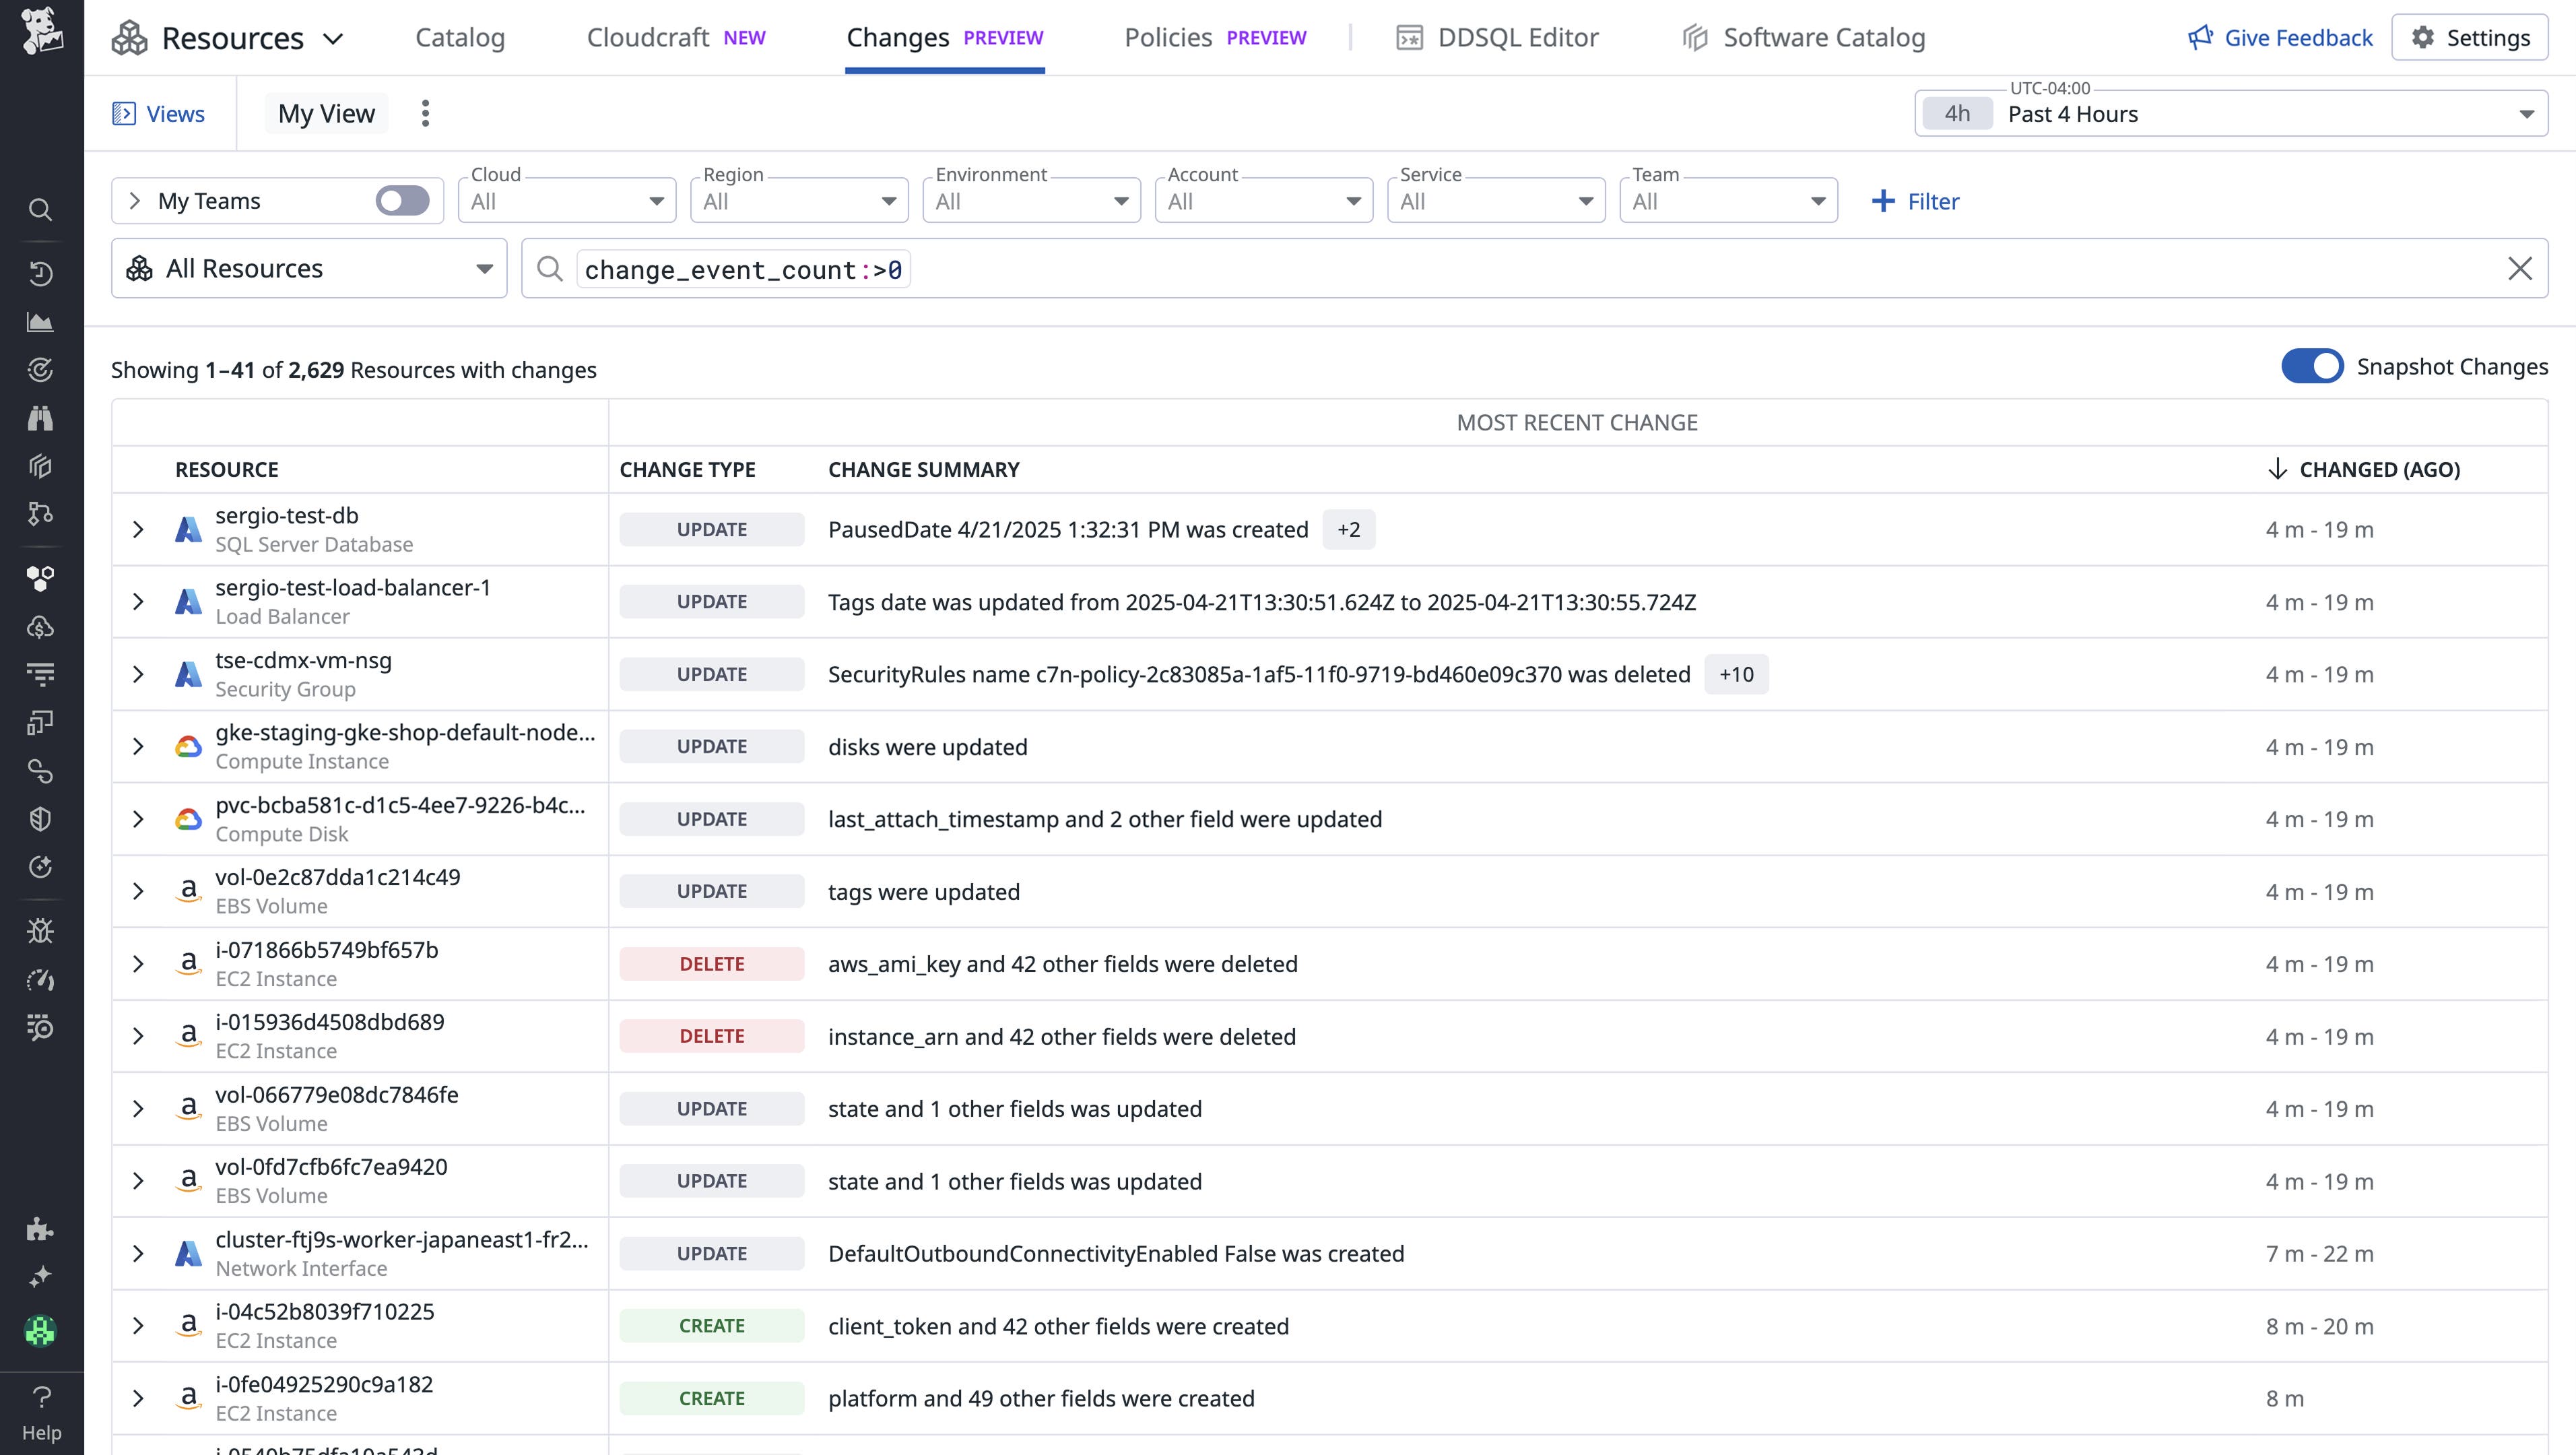
Snapshot Changes gives you a unified view of recent resource changes across AWS, Google Cloud, and Microsoft Azure. It also tracks changes such as deleted resources, which are sometimes missed by change-tracking tools that cloud providers offer. After you enable resource collection, Datadog automatically detects changes in your infrastructure configurations across all your environments.
View infrastructure changes to your services and dependencies in context
Let’s say that your company has an ecommerce platform that operates on AWS and serves millions of customers. You’re responsible for uptime of the shopist-web-ui service, and you’re paged for an incident because of an increased number of errors for the service. You have eliminated any code changes, feature flag flips, or dependency outages as possible causes of the failures, and you’re investigating possible infrastructure-related root causes.
To begin your investigation, you open the Monitor Status page. You then click on the monitor event and head to the Suggested Resources section, where you choose Infrastructure Changes.
This action brings you to Resource Changes, which is automatically scoped to the monitor’s alert time frame and pre-filtered with tags for the impacted service, environment, and team. Additionally, this view shows changes to shared resources that might not possess these tags.
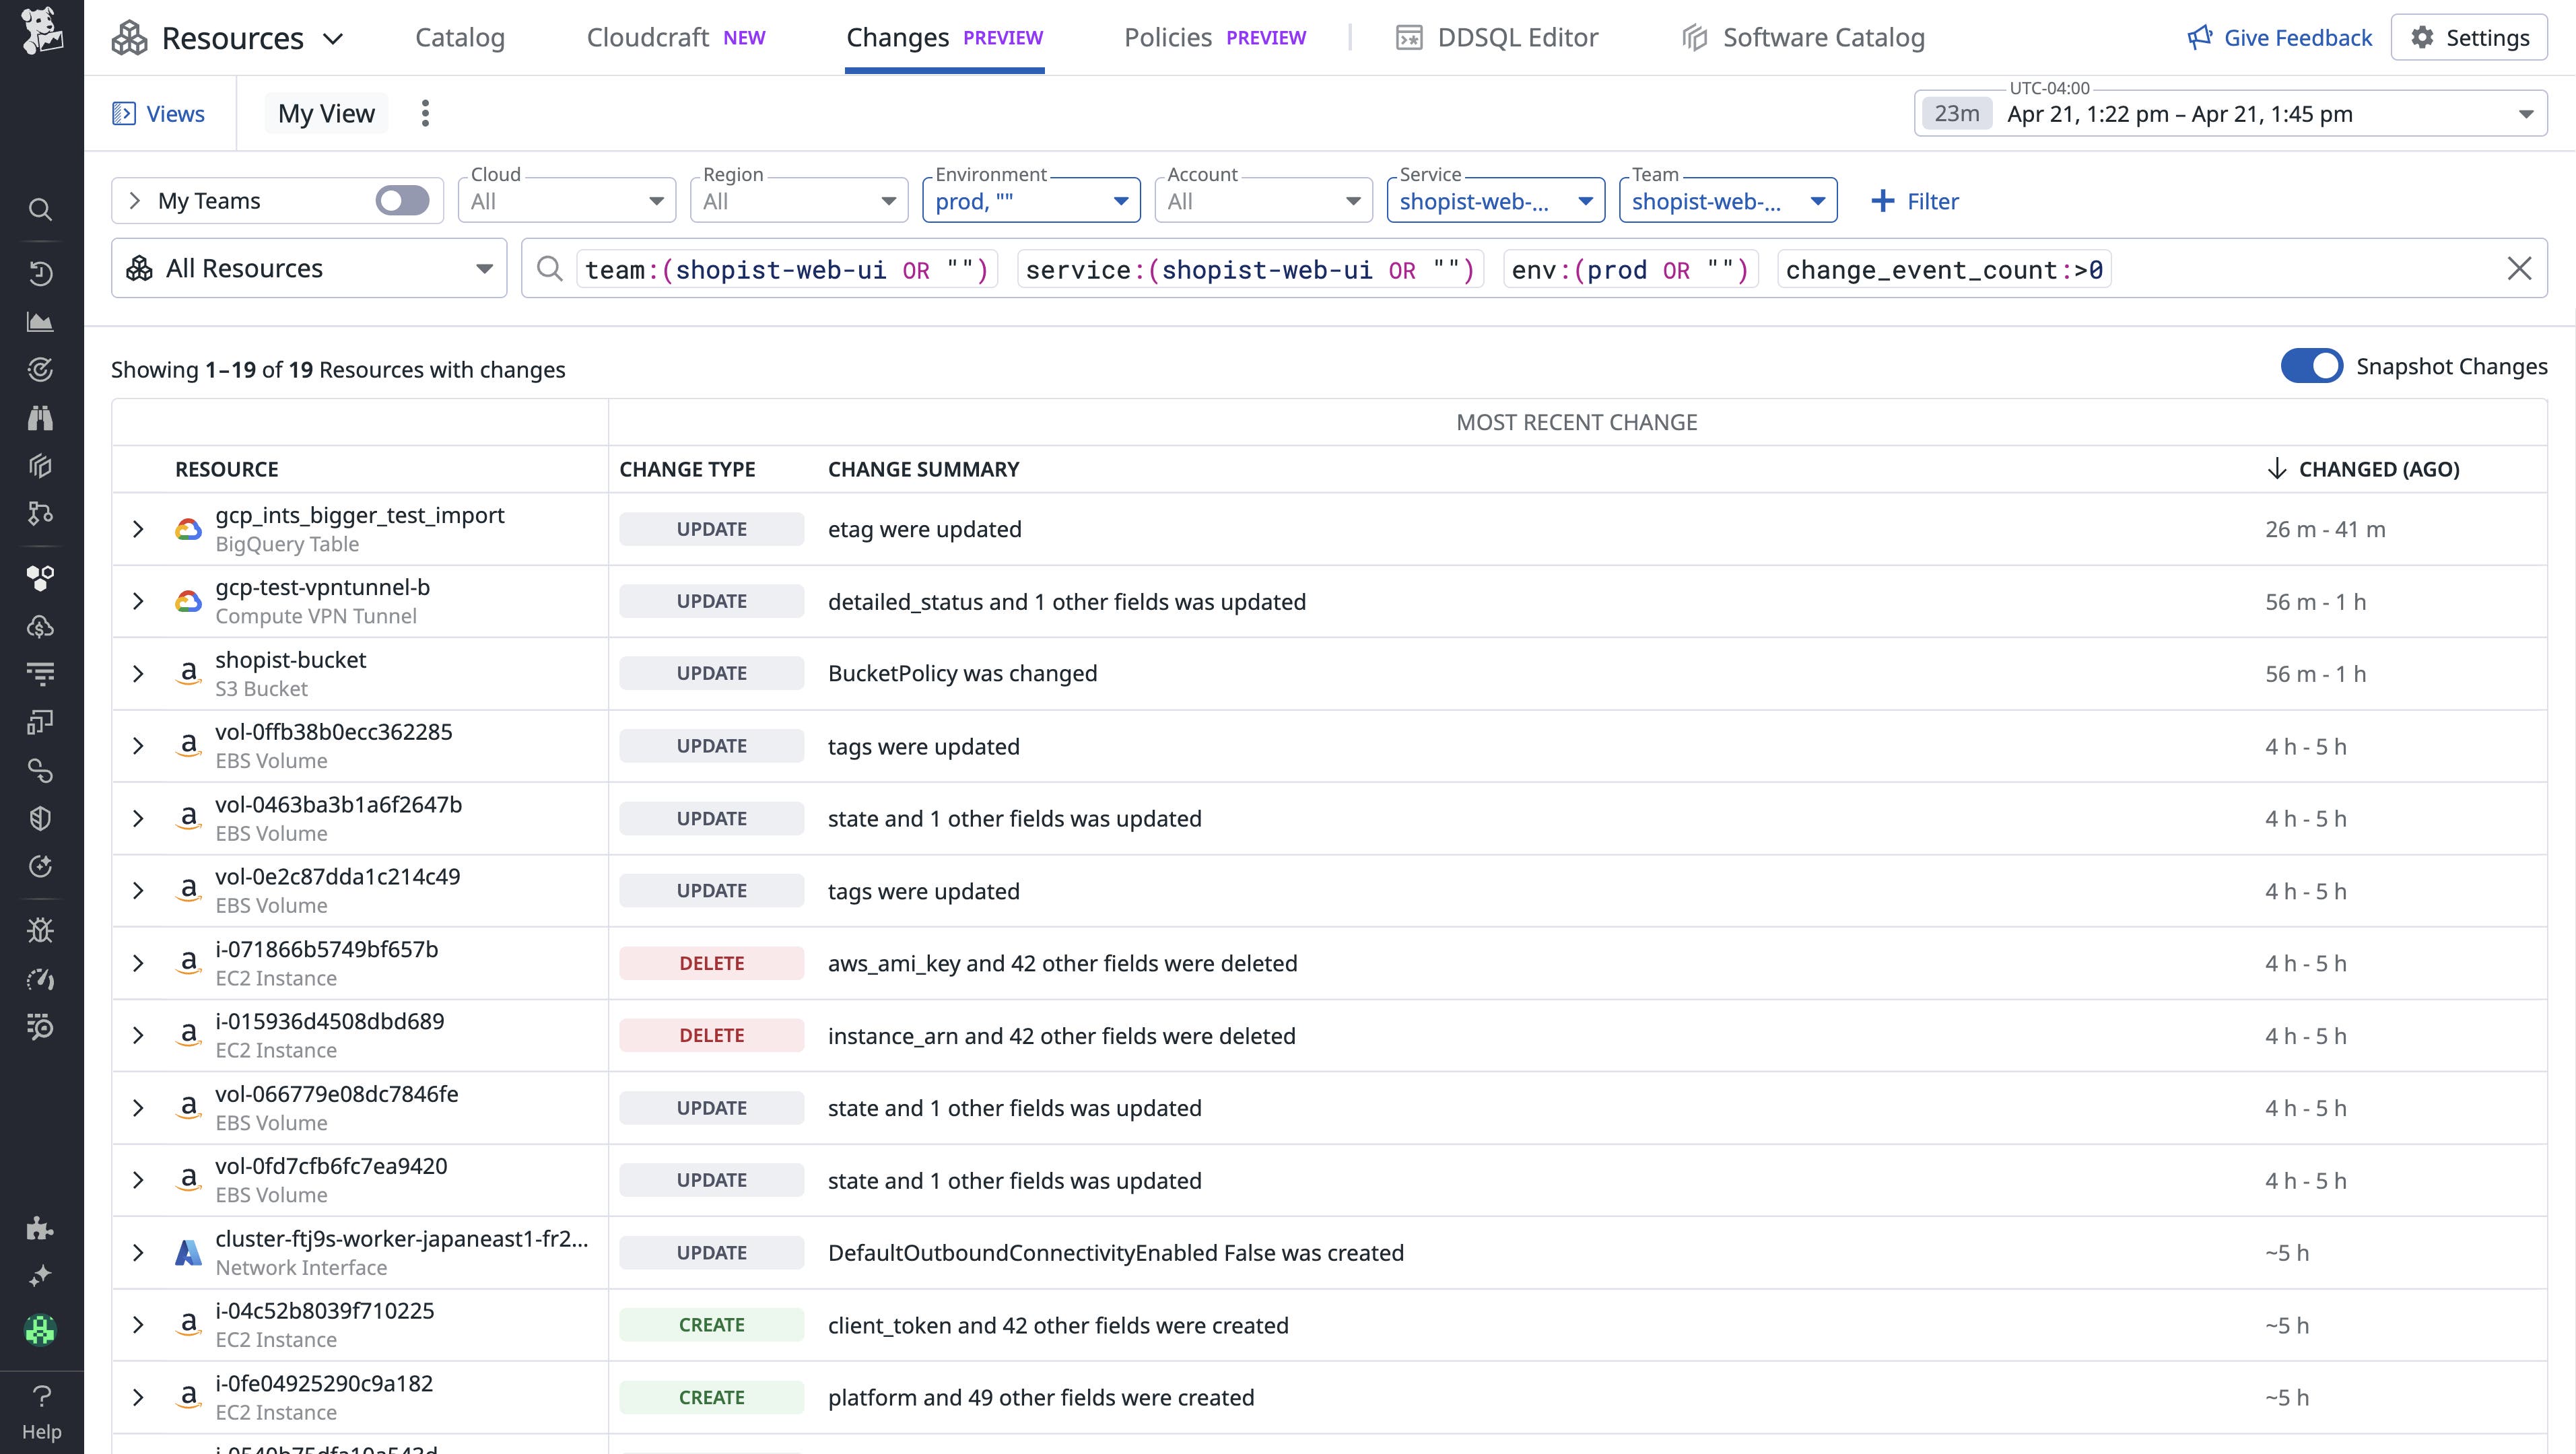
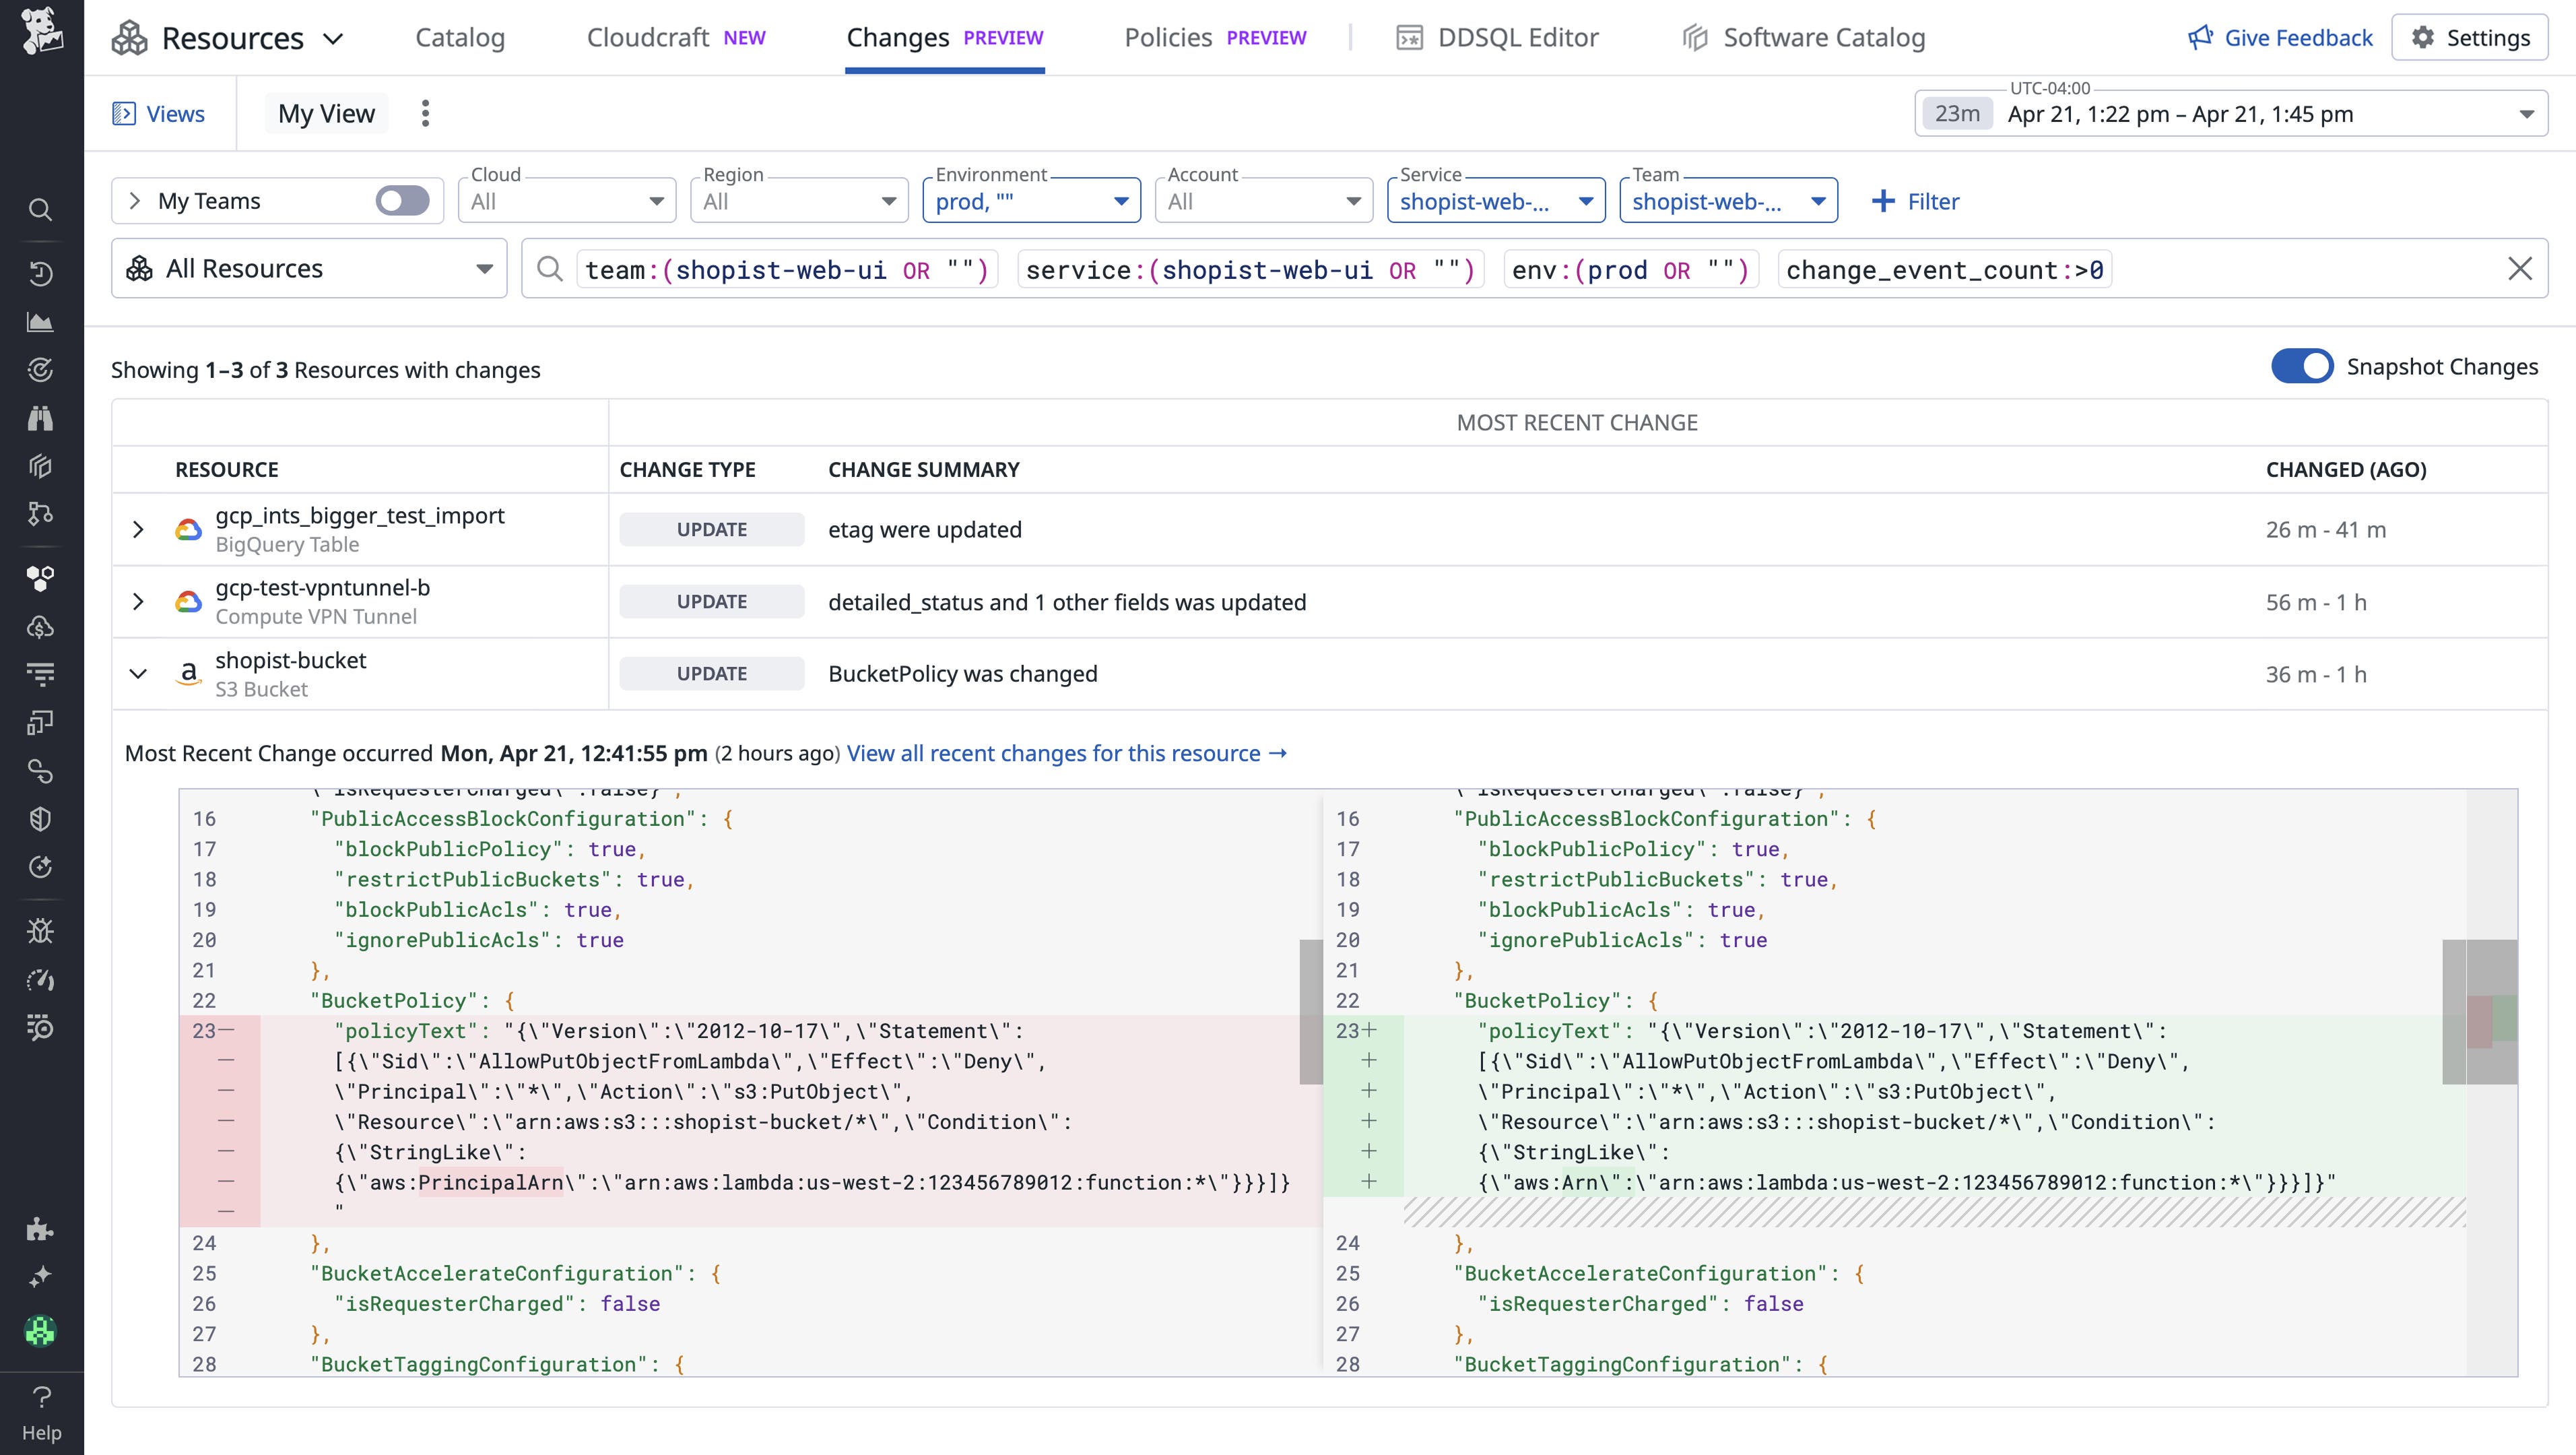
As you scan the list of resources, you notice a change to the IAM policy of an Amazon S3 bucket named shopist-bucket. After you click into the change, the side-by-side difference reveals the issue: The policy was updated with a misconfigured rule that inadvertently blocked user access to the bucket.
In the resource side panel, the Logs section shows an error log for the bucket.
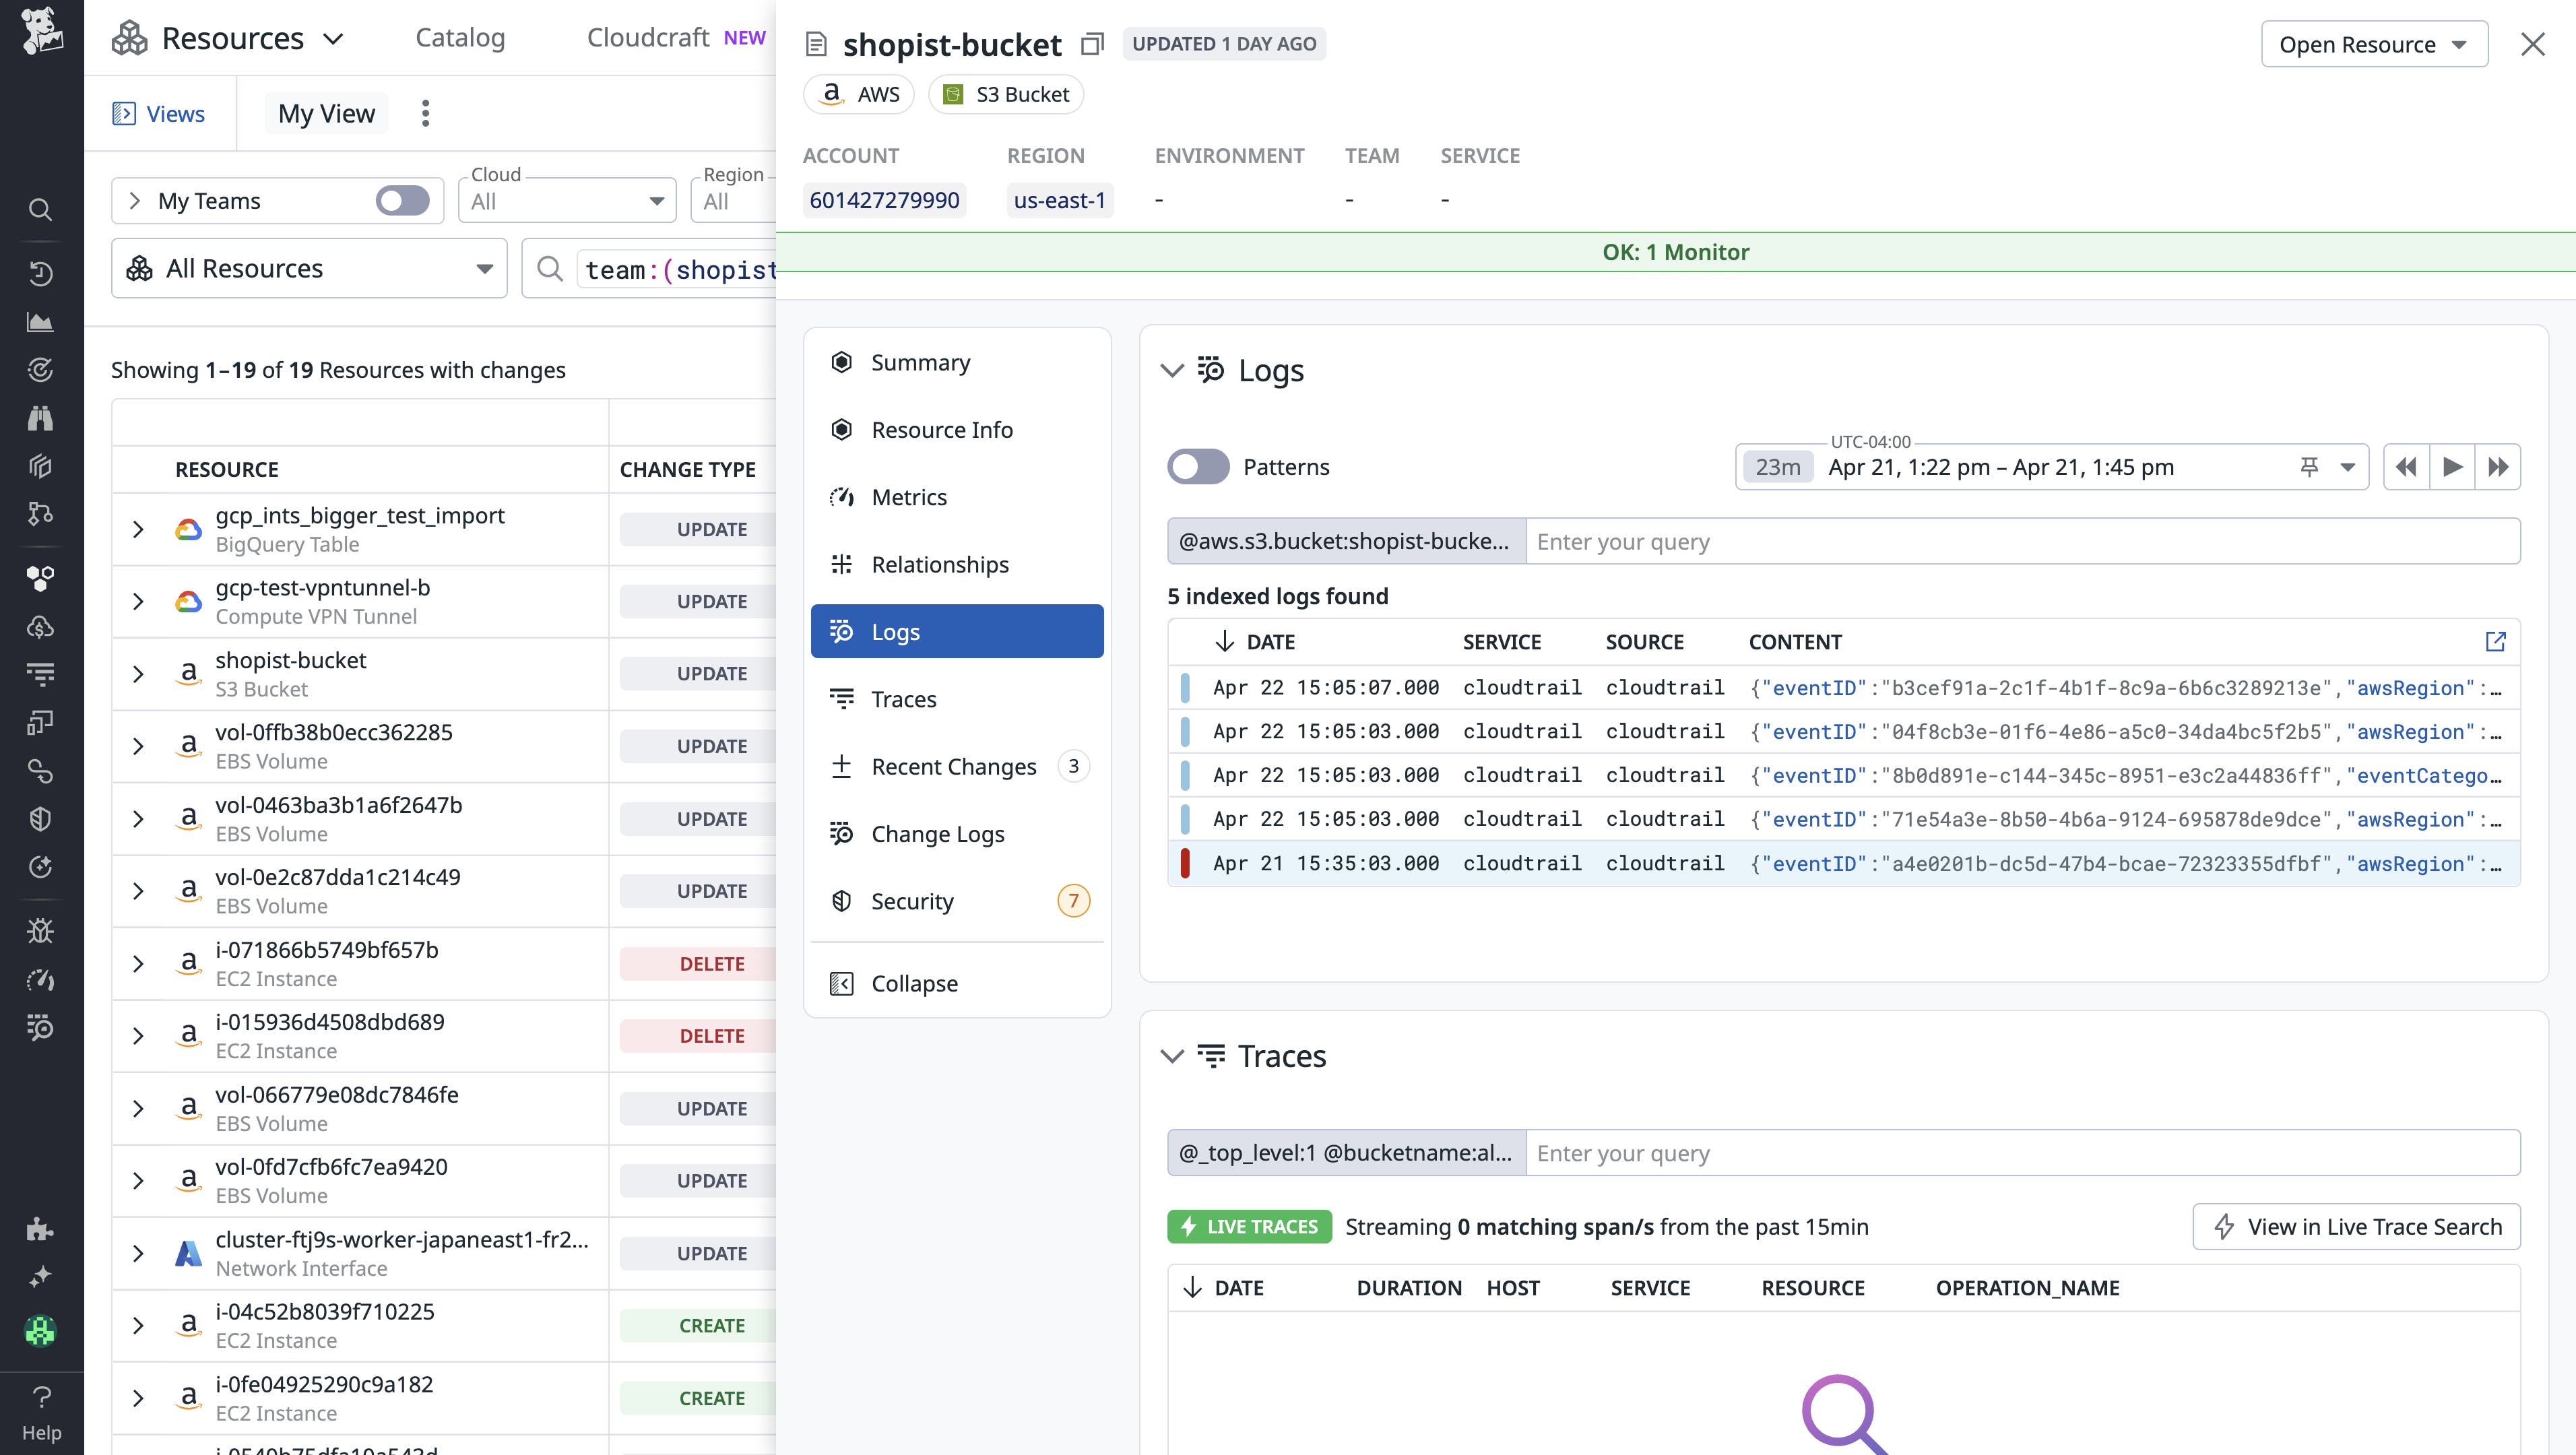
You can further investigate this log by using the Log Explorer in Datadog Log Management.
Additionally, the Change Logs section shows AWS CloudTrail logs for the bucket. In this case, these logs indicate the email address of the user who made the changes.
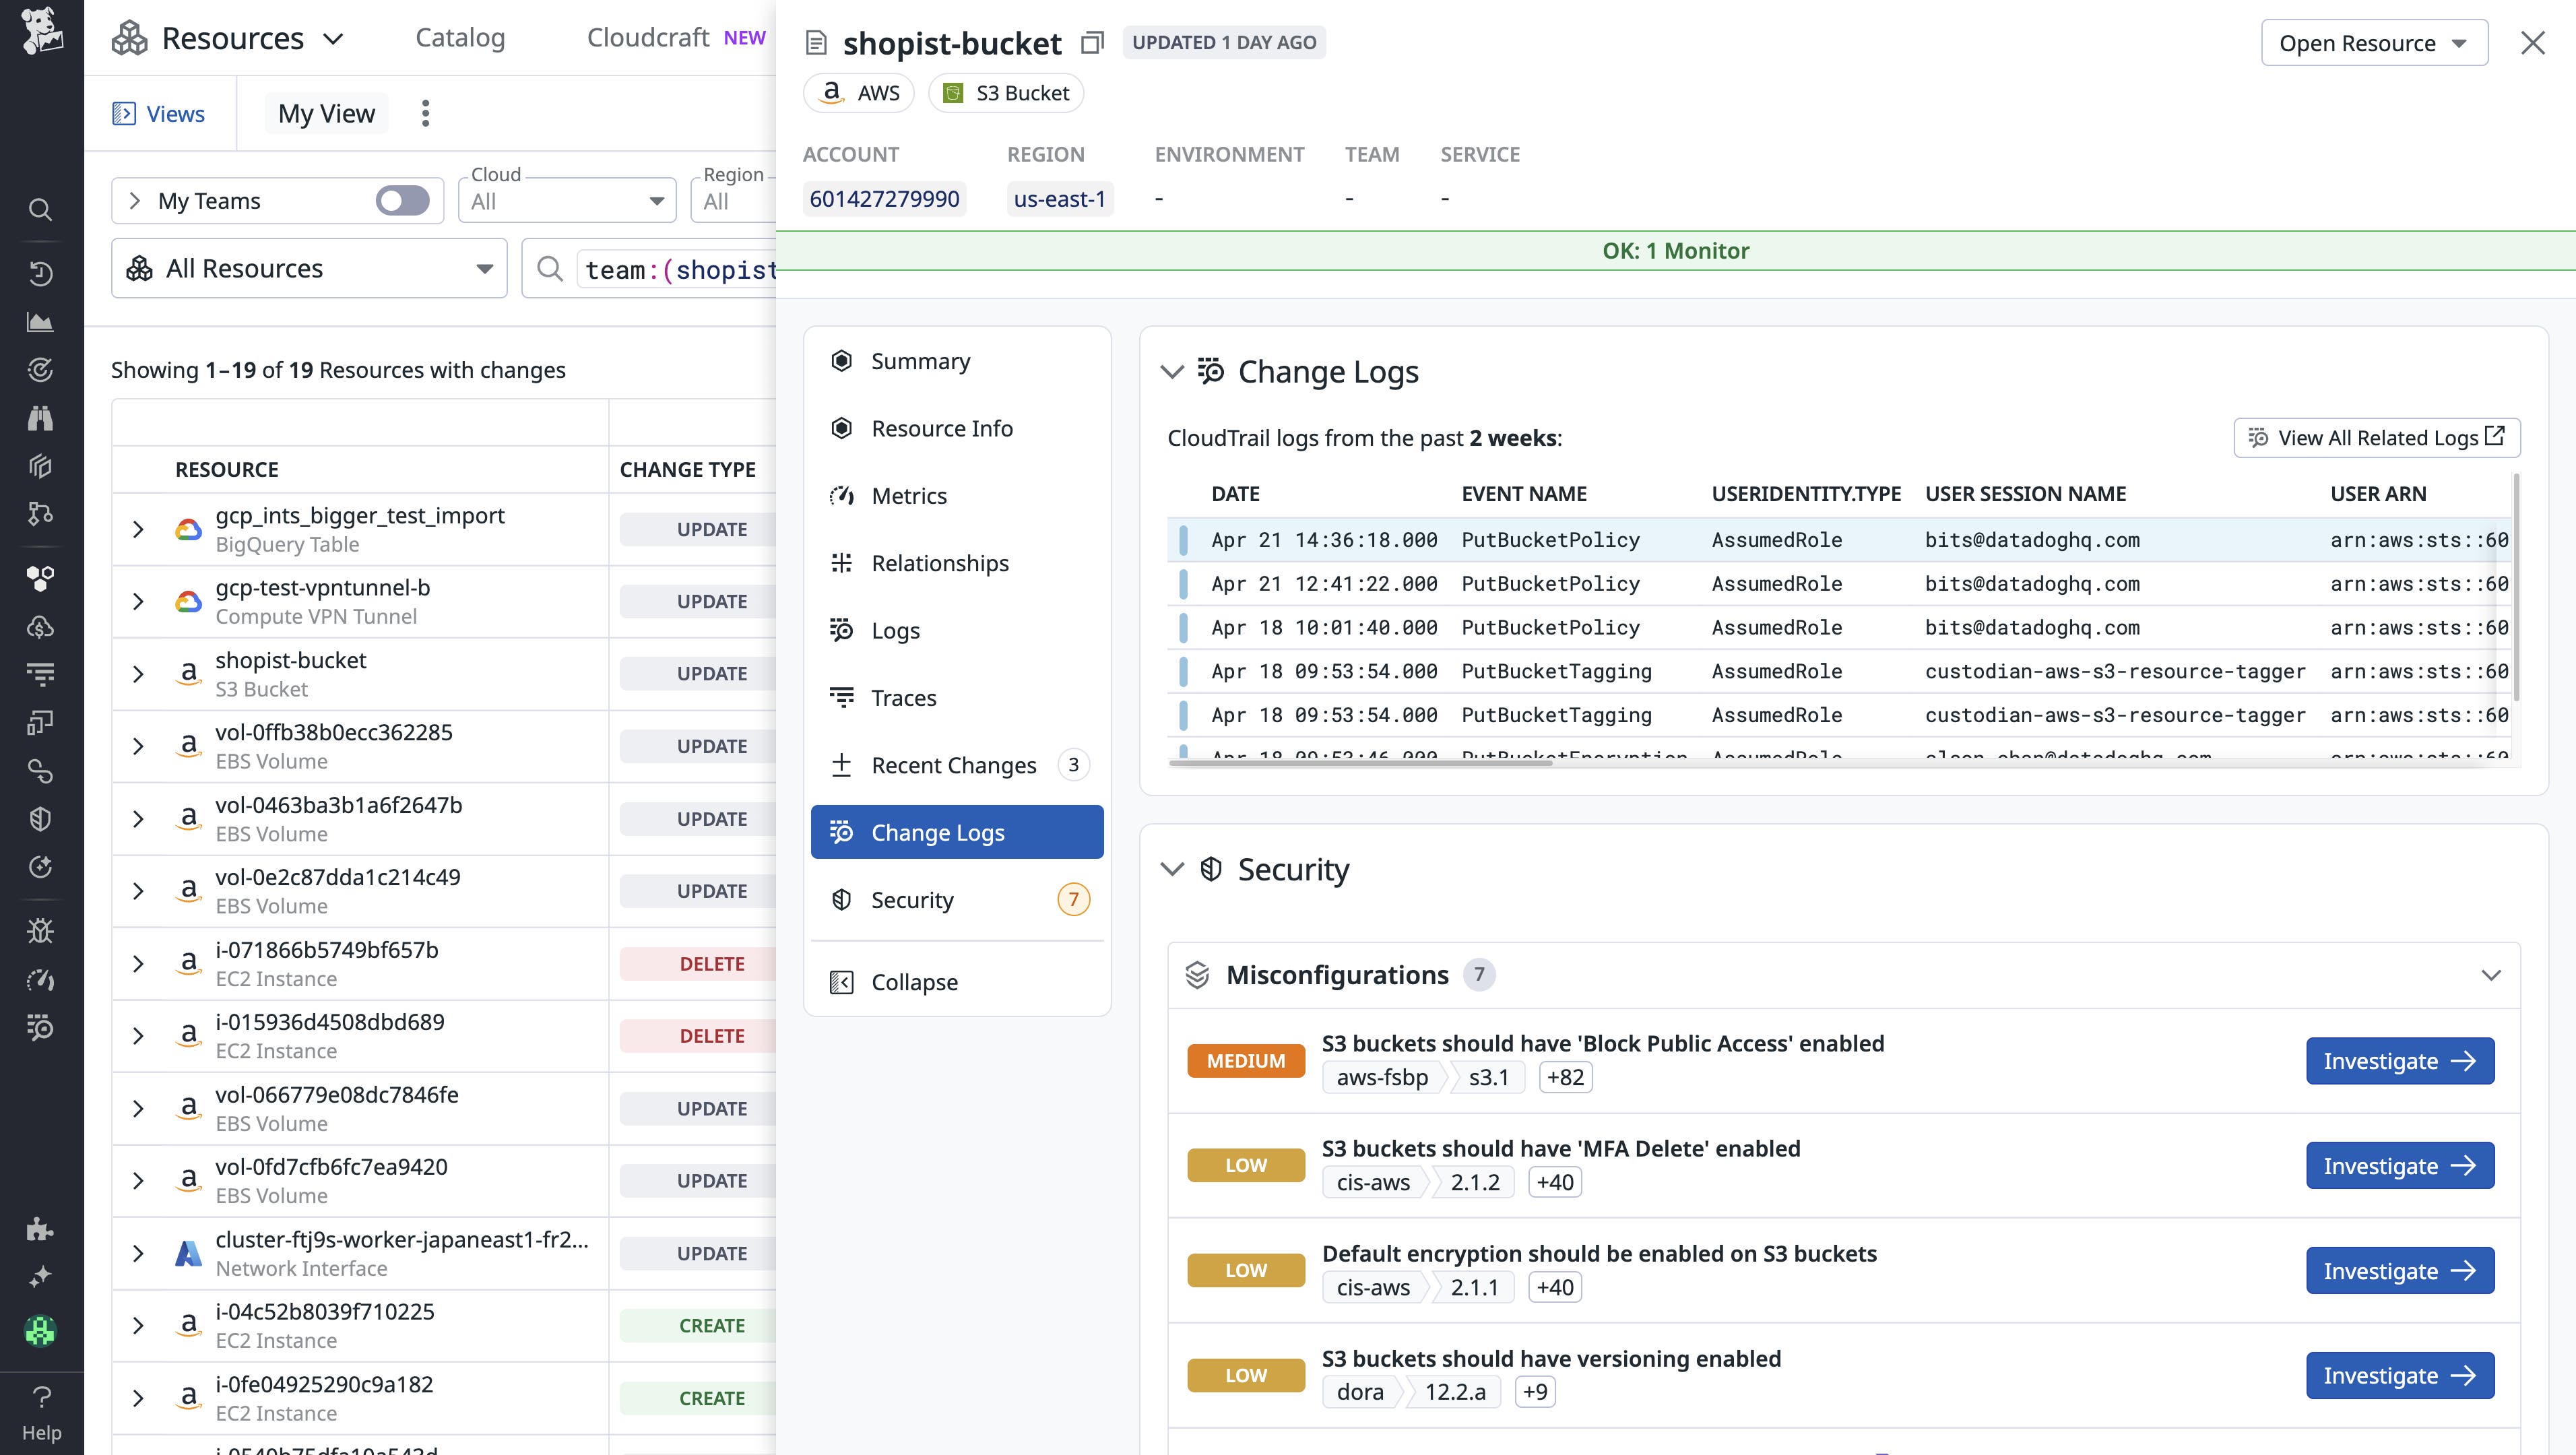
Now that you’re aware of the problematic change and who made it, you can alert the person who made the change to roll it back. After the fix is deployed, the Changes tab reflects the update within seconds. From the resource side panel, you can confirm that metrics and monitors are back to a healthy state—all without leaving the workflow.
Search by changed fields and broaden your search to resolve similar issues
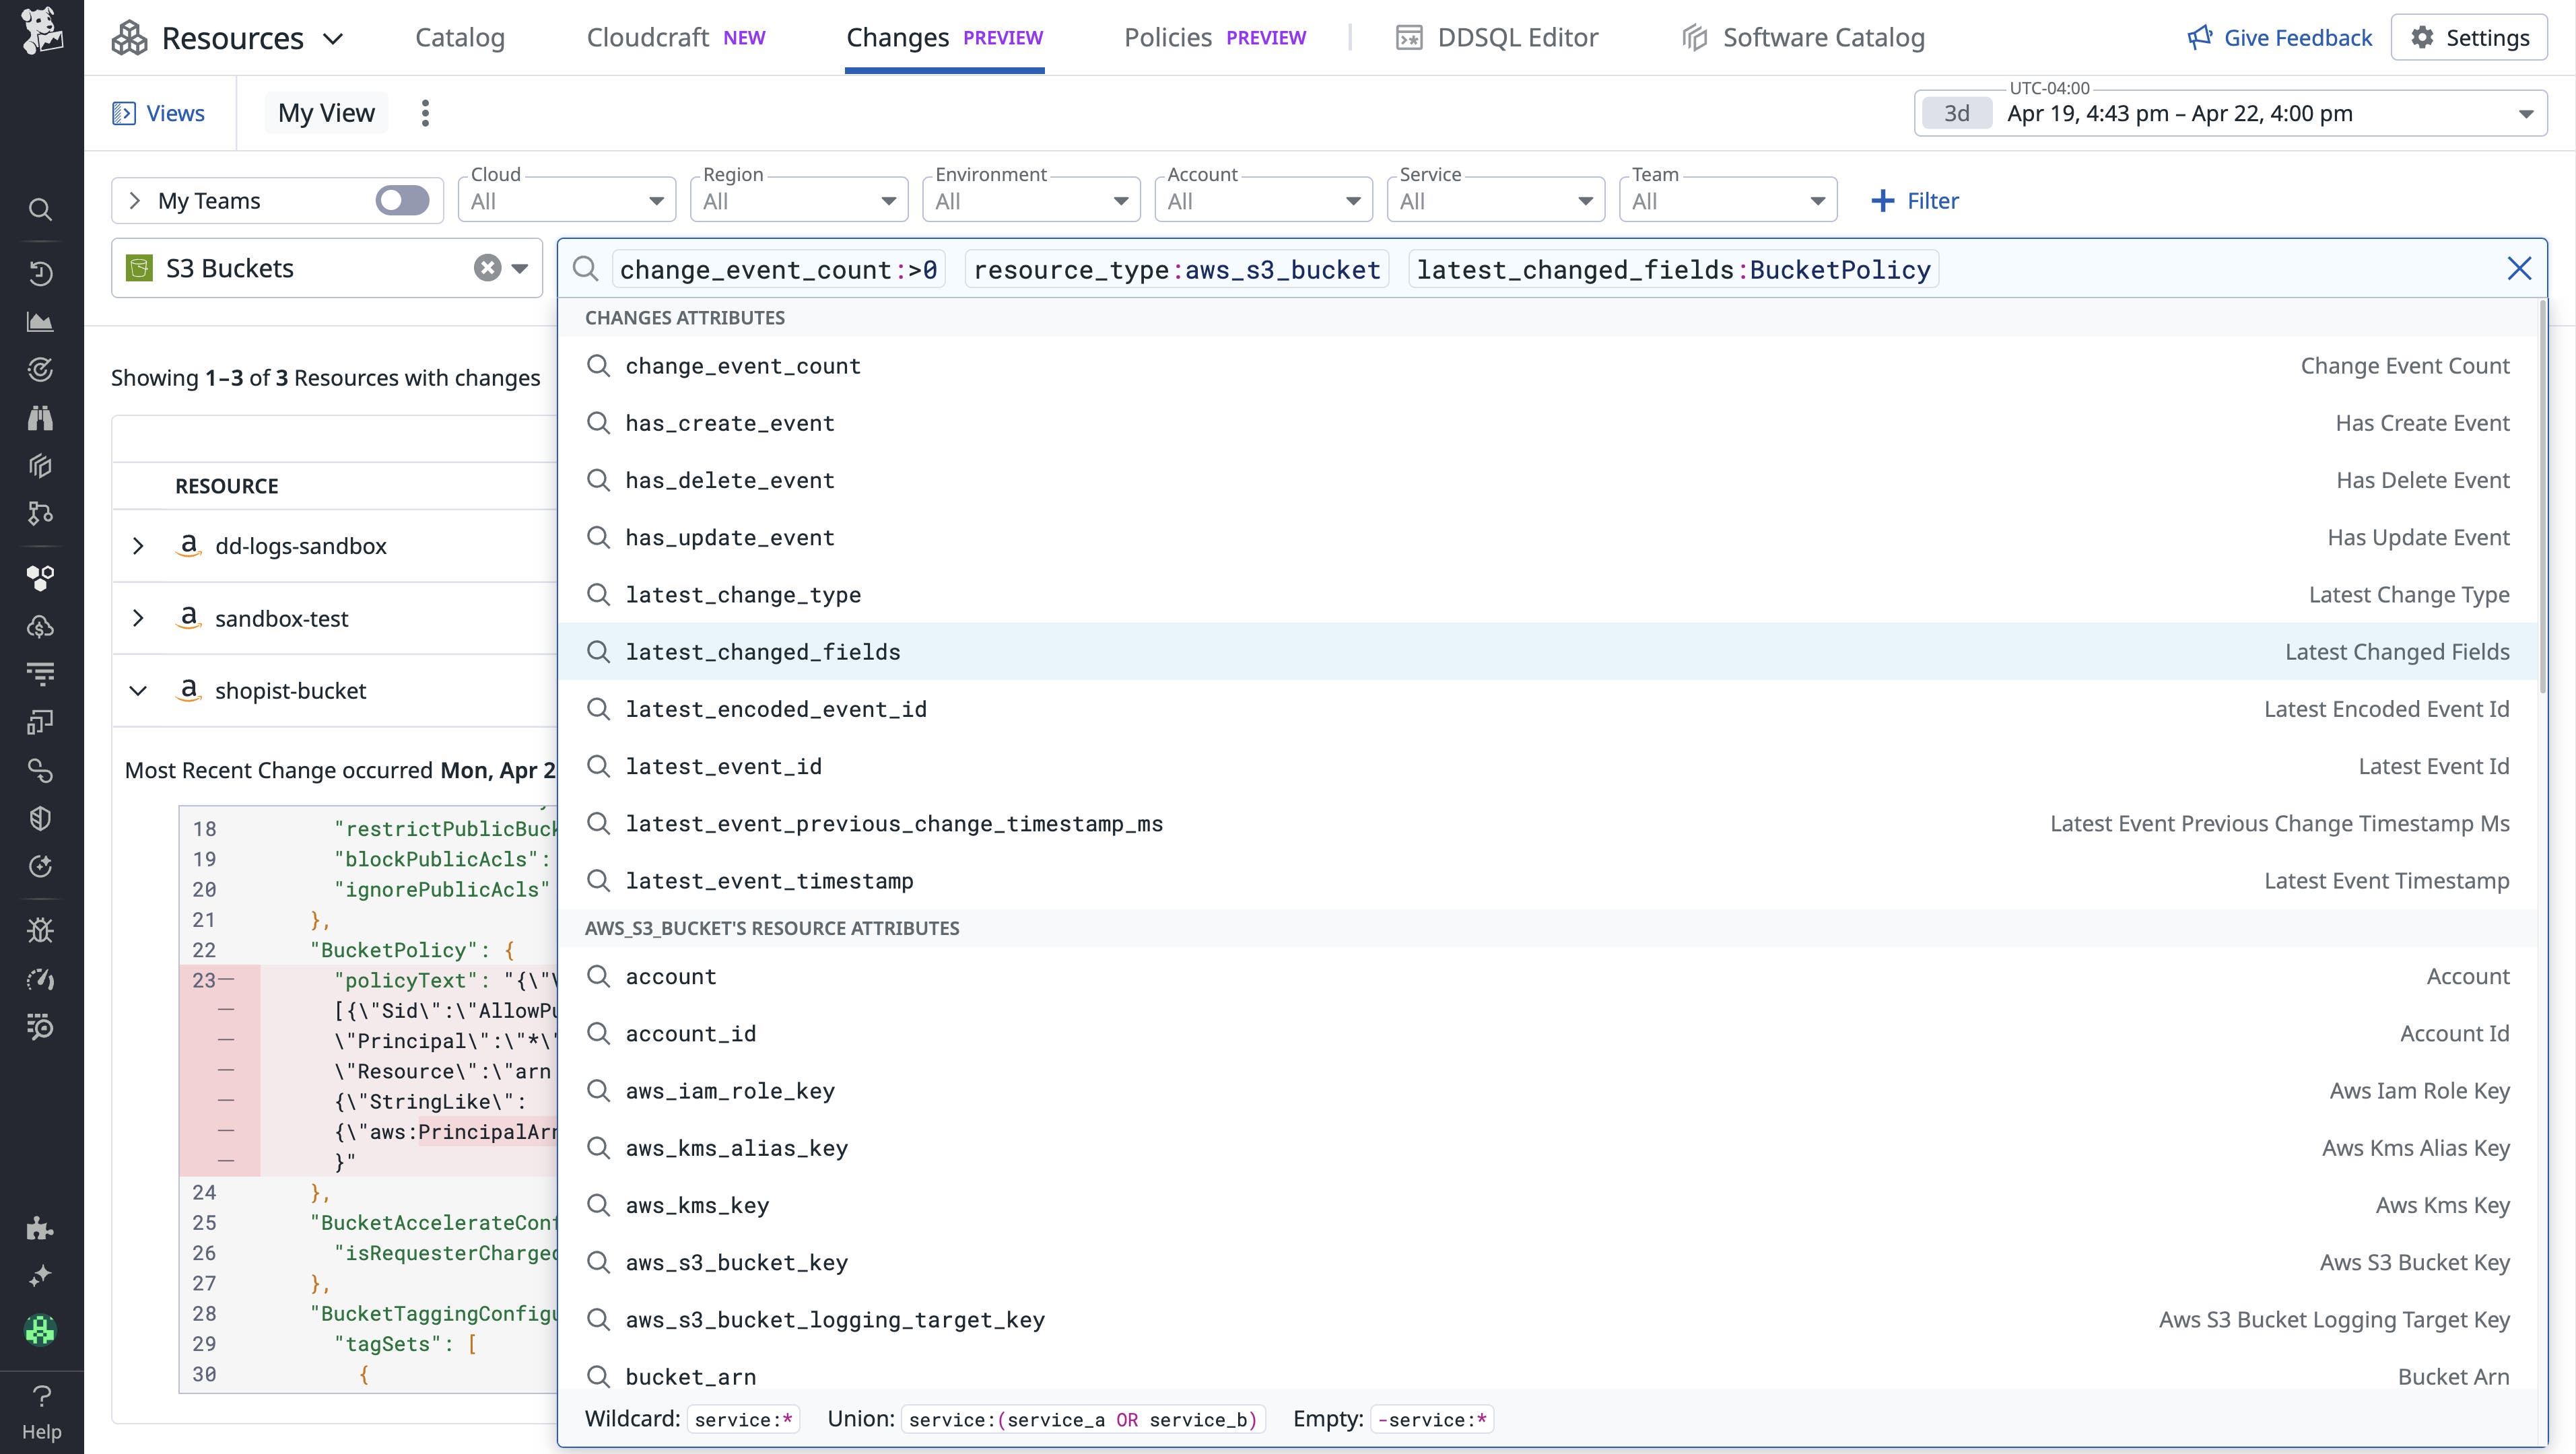
To prevent repeat issues, use the Changes tab to search by changed attributes—such as BucketPolicy—and identify similar misconfigurations. This action surfaces other resources with the same misconfiguration that have not yet caused problems, allowing you to proactively correct them.
By using flexible wildcard search methods, you can quickly identify patterns and pinpoint anomalies among your changes. To expand your search beyond the selected time frame, you can use the time frame selector to view up to a week’s worth of changes.
Get started monitoring cloud infrastructure changes
In complex distributed environments, configuration changes can ripple across systems and affect service-level metrics. Fragmented tools make these changes difficult to identify and track. With Snapshot Changes and one-click access from Monitor Status pages, you can quickly troubleshoot infrastructure-related incidents with context that already exists inside your monitor.
To start troubleshooting with Snapshot Changes, sign up for the Preview and enable resource collection. You can learn more about Snapshot Changes in our documentation, which includes a comprehensive list of supported resource types. If you don’t already have a Datadog account, sign up for a 14-day free trial today.
