Bowen Chen

Jane Wang
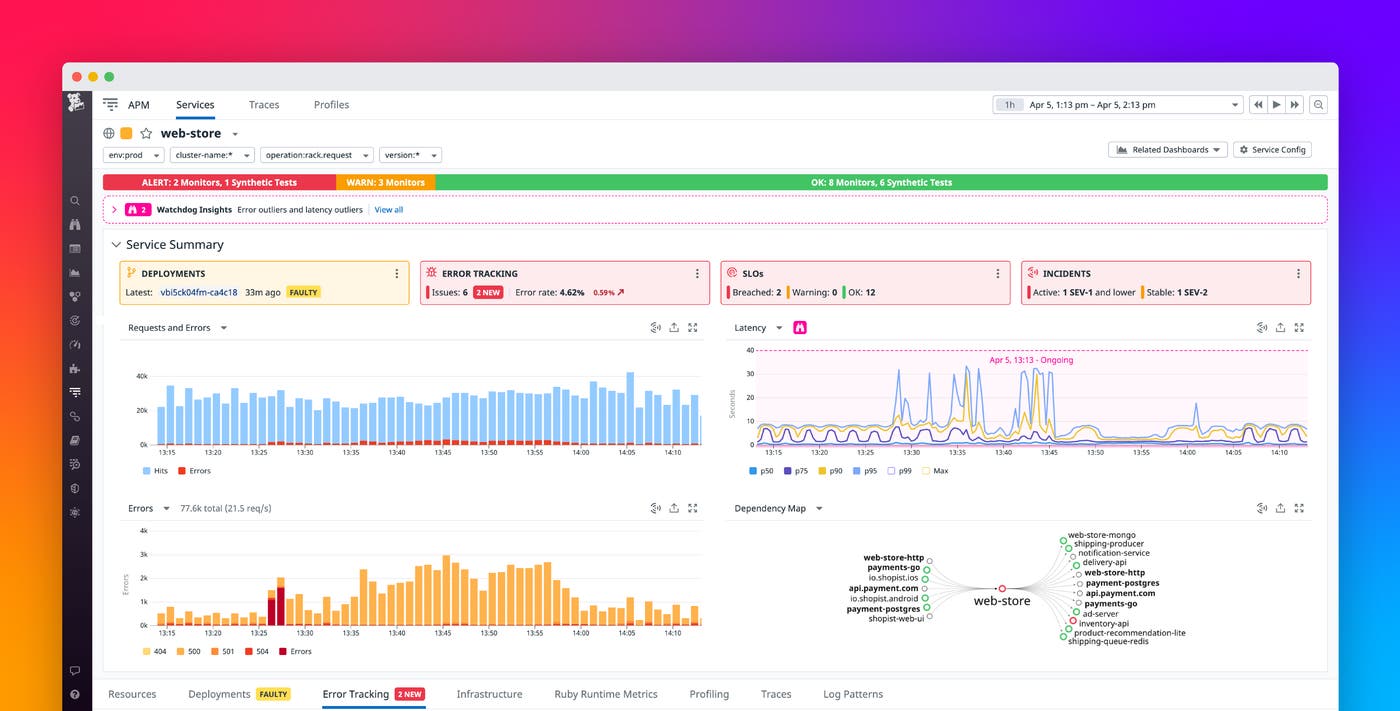
When your service is undergoing performance issues, it is essential to address them in a timely and frictionless manner. With access to more telemetry and insights, the APM Service Page provides a comprehensive overview of your service and helps you quickly drill down under the hood to diagnose and investigate issues. Along with summary cards that highlight faulty deployments, new issues, SLOs, and incidents, the Service Page now features integrated Error Tracking, traces, log patterns, and code profiles. To get a holistic view into the health of your service, we’ve updated the Service Page with the following:
- Highlights on deployments, errors, SLOs, and incidents
- Embedded Error Tracking and Watchdog Insights
- End-to-end visibility with distributed traces, log patterns, and code profiles
Easily monitor faulty deployments, new issues, SLO breaches, and ongoing incidents
Each time you release a new version of your service, you risk introducing new errors and performance degradations that will ultimately affect end-user experience. Using the Service Page’s summary cards, you can gain quick insights into any problems affecting your service and immediately address them. Datadog will automatically detect any recent deployments that appear to be faulty and highlight them within the Deployments card. For ongoing monitoring, the Error Tracking card will flag new issues in your service, alongside your service’s issue count and error rate. Datadog Service Level Objectives (SLOs) help you contextualize your service in relation to existing benchmarks, enabling you and your team to keep performance goals top of mind. You can also see if your service is involved in any incidents that require immediate attention.
Using the Service Page as your central source for service health telemetry, you can take action from the summary cards to best respond to your service’s needs—whether that means adding new availability SLOs, declaring and diagnosing ongoing incidents, or looking into new issues affecting your service.
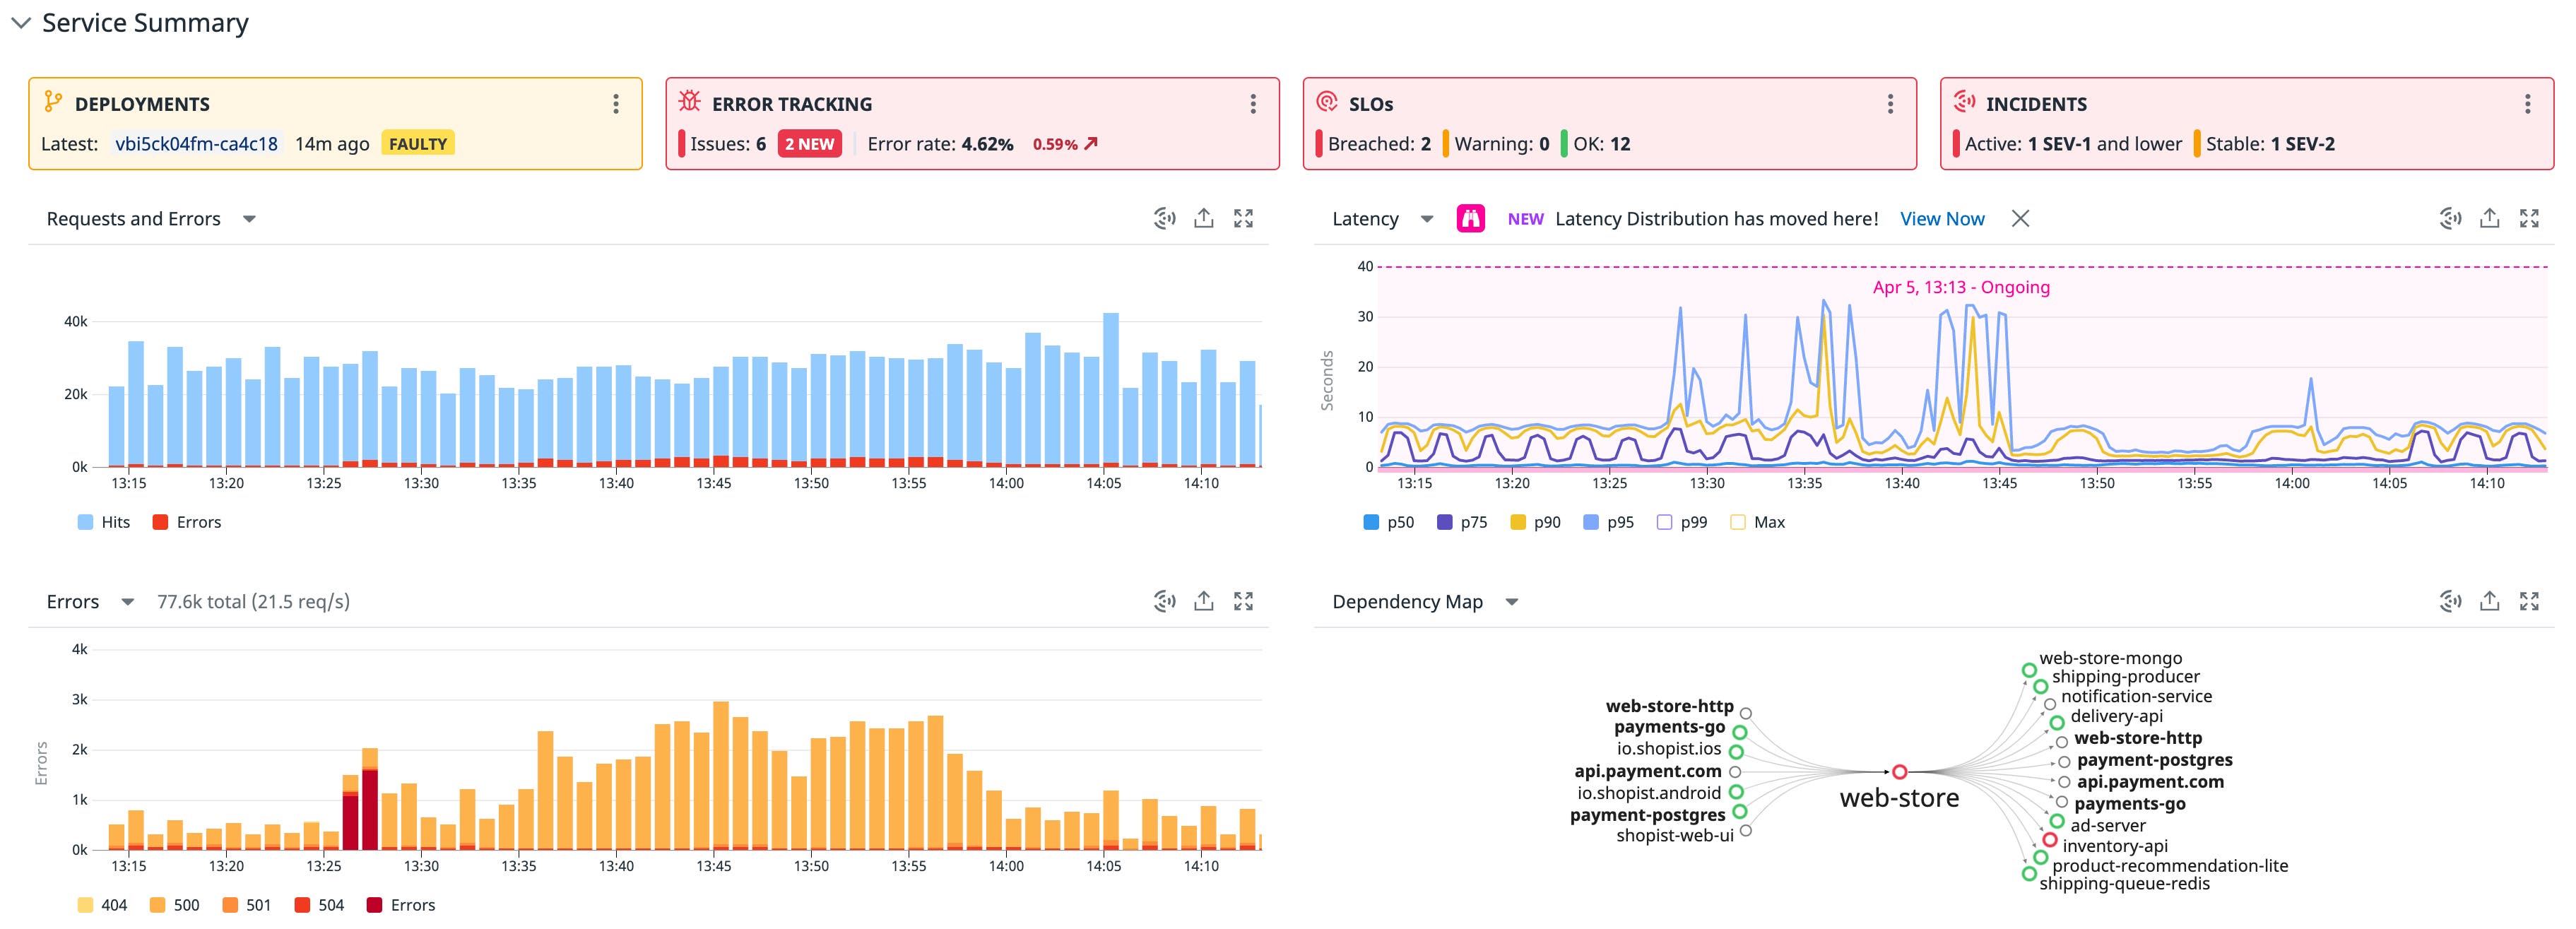
The service summary introduces a dependency map so you have a clear view of upstream and downstream service dependencies. You can follow each dependency to its respective Service Page to dig deeper into your investigation. We’ve also moved the latency distribution graph to where the rest of the latency graphs are, enabling you to get a more focused view of your performance metrics.
Automatically detect and prioritize relevant issues with Error Tracking and Watchdog Insights
Visibility into errors is crucial for finding the root cause of performance problems—that’s why we’re excited to announce that Error Tracking is now embedded within the Service Page, surfacing new issues in real time and enabling you to assess trends in ongoing errors. Error Tracking automatically aggregates similar errors into issues to reduce noise so you can focus on troubleshooting the issues with the highest impact.
If the Error Tracking summary card shows a surge in the number of new issues or your service’s error rate, click “View All Issues” for a list of all issues in the Error Tracking tab below. In this tab, you can see exactly which resources are most affected, and a list of the most common issues occurring within your service. You can inspect an issue for more details and view relevant error stack traces to get a better understanding of how it’s impacted your service over time.
The Service Page integrates with Watchdog to aid your investigations using automatic anomaly detection. We’ve added Watchdog Insights to the top of the page, which surfaces tags on spans with high error rates and latency. If Watchdog flags any anomalies in your service metrics, it will overlay a visual indicator on your service’s requests, errors, and latency graphs. By clicking on the Watchdog icon, you can view more details about the anomaly, such as its root cause, critical failures on related services, and impacted views and users from your frontend application with Datadog RUM. From the side panel, you can enable recommended monitors to be alerted on similar anomalies in the future.
End-to-end visibility with distributed traces, log patterns, and code profiles
You can now explore traces, log patterns, and profiles directly from the Service Page, eliminating the need to context switch while troubleshooting. With the new Traces tab, you can drill down to problematic spans using core tags and facets such as error type, span duration, and status code. For more information, you can inspect each trace’s corresponding flame graph to identify the source of bottlenecks or errors.
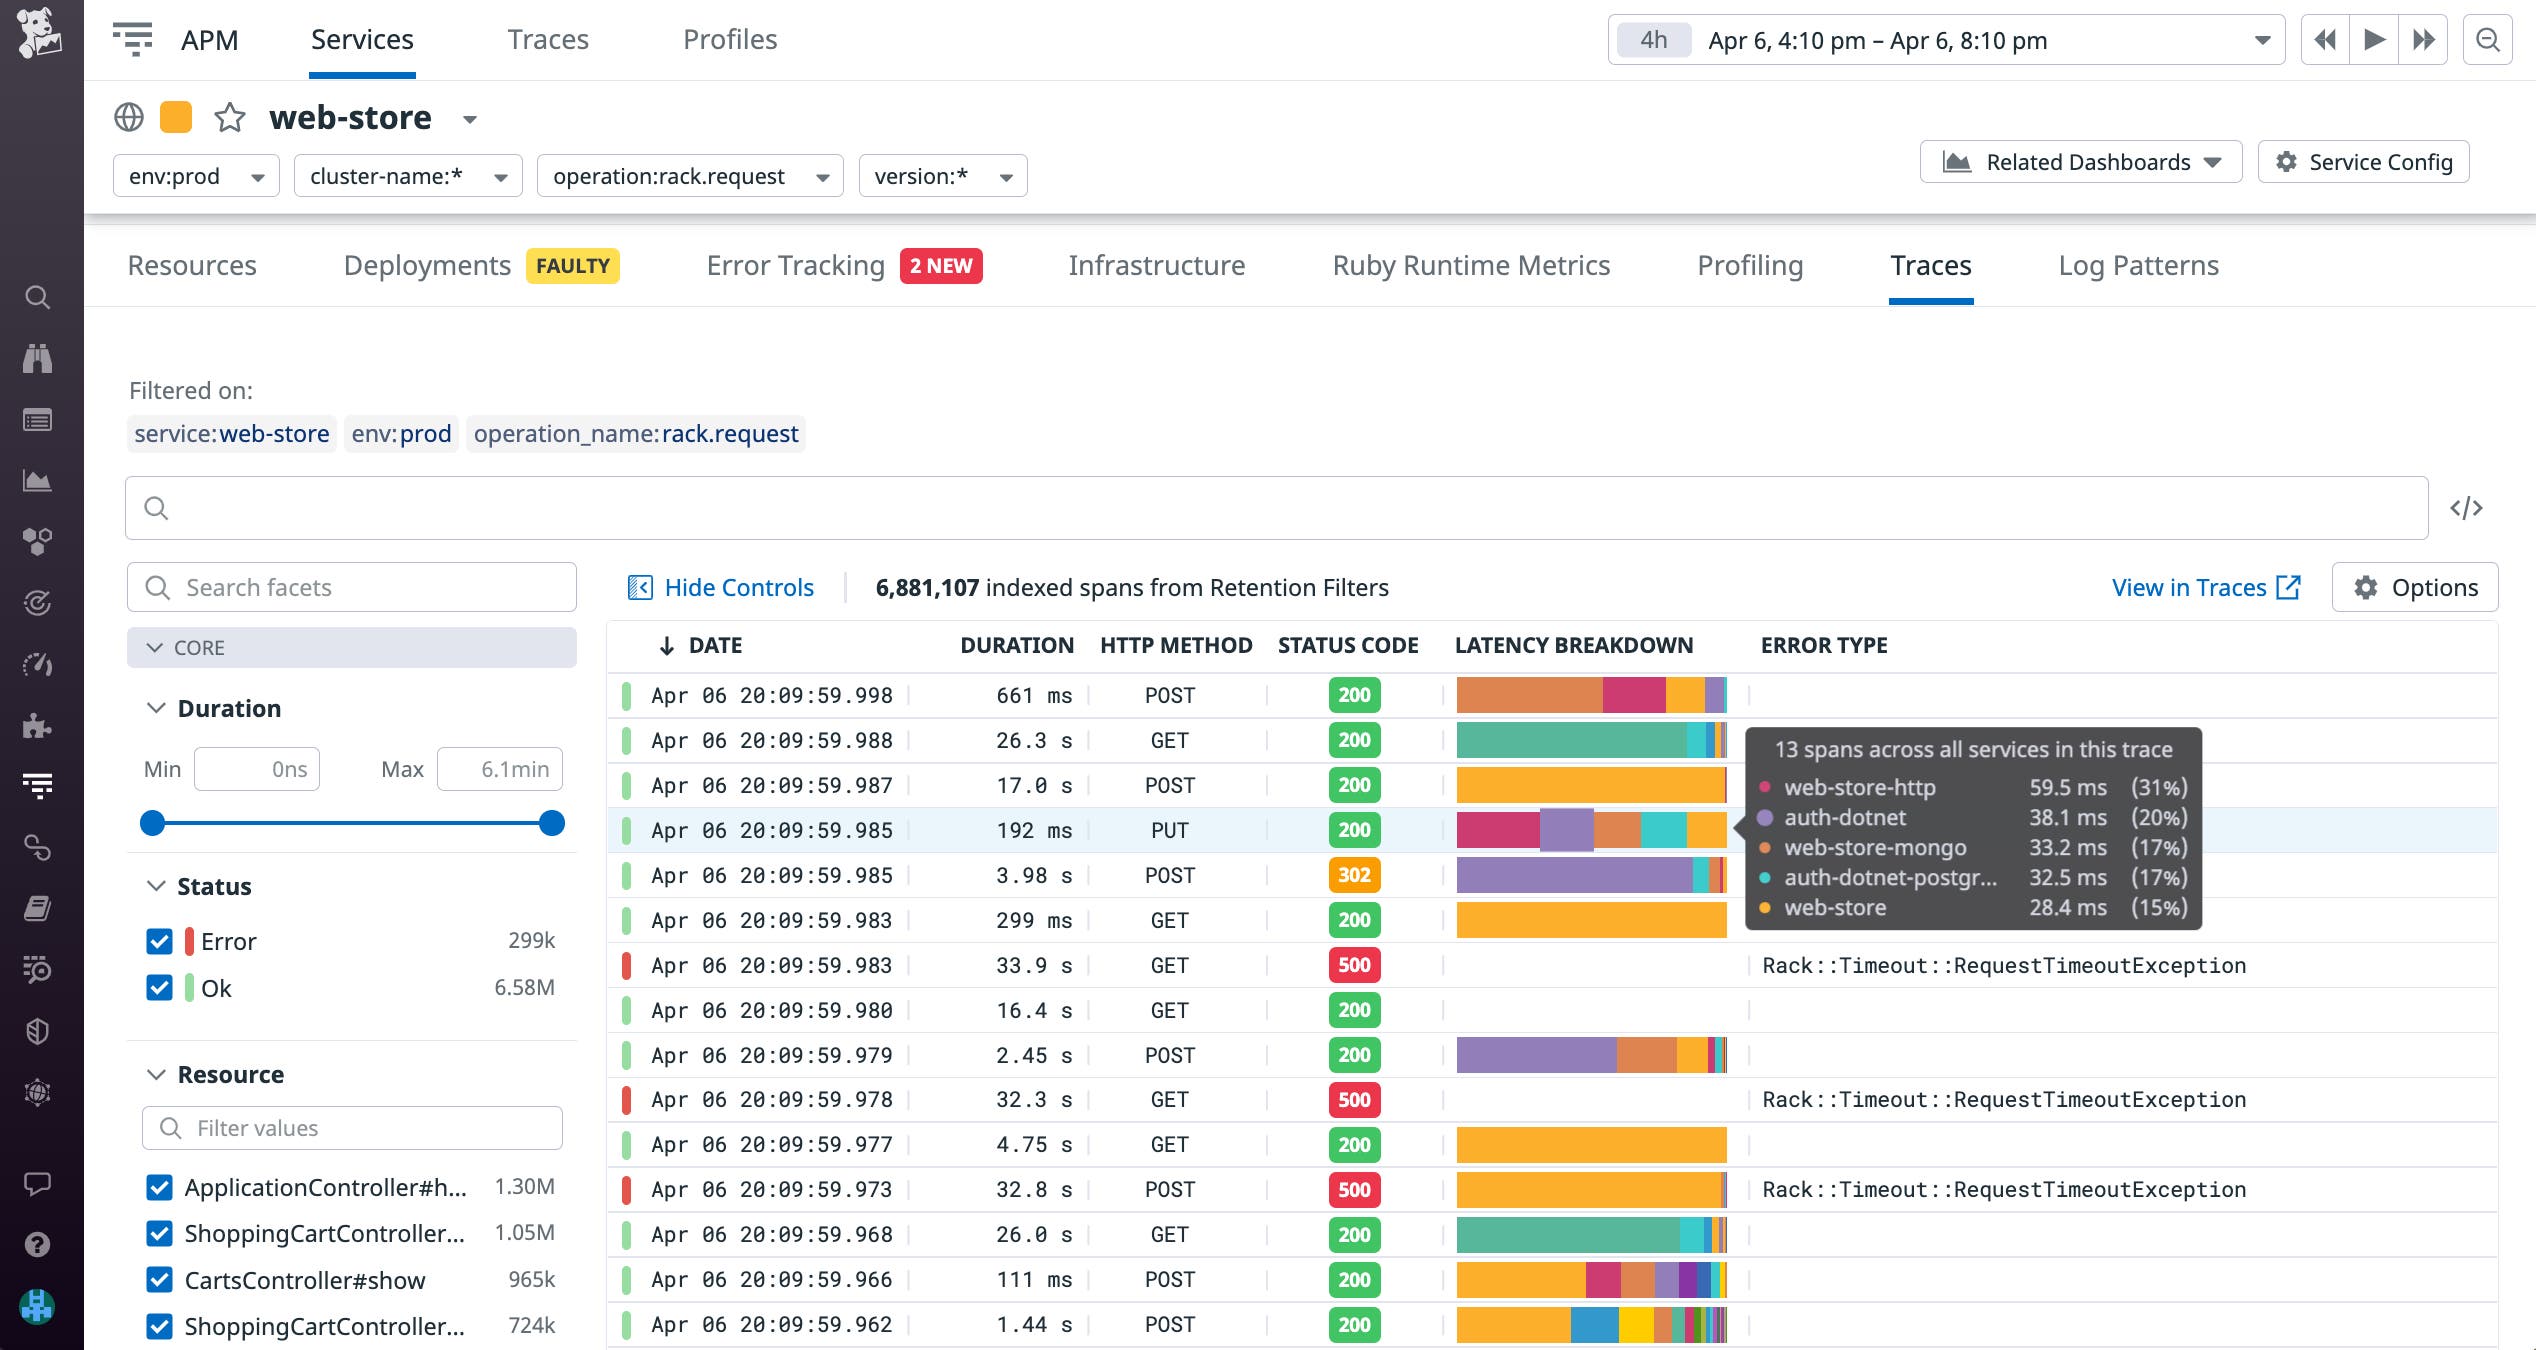
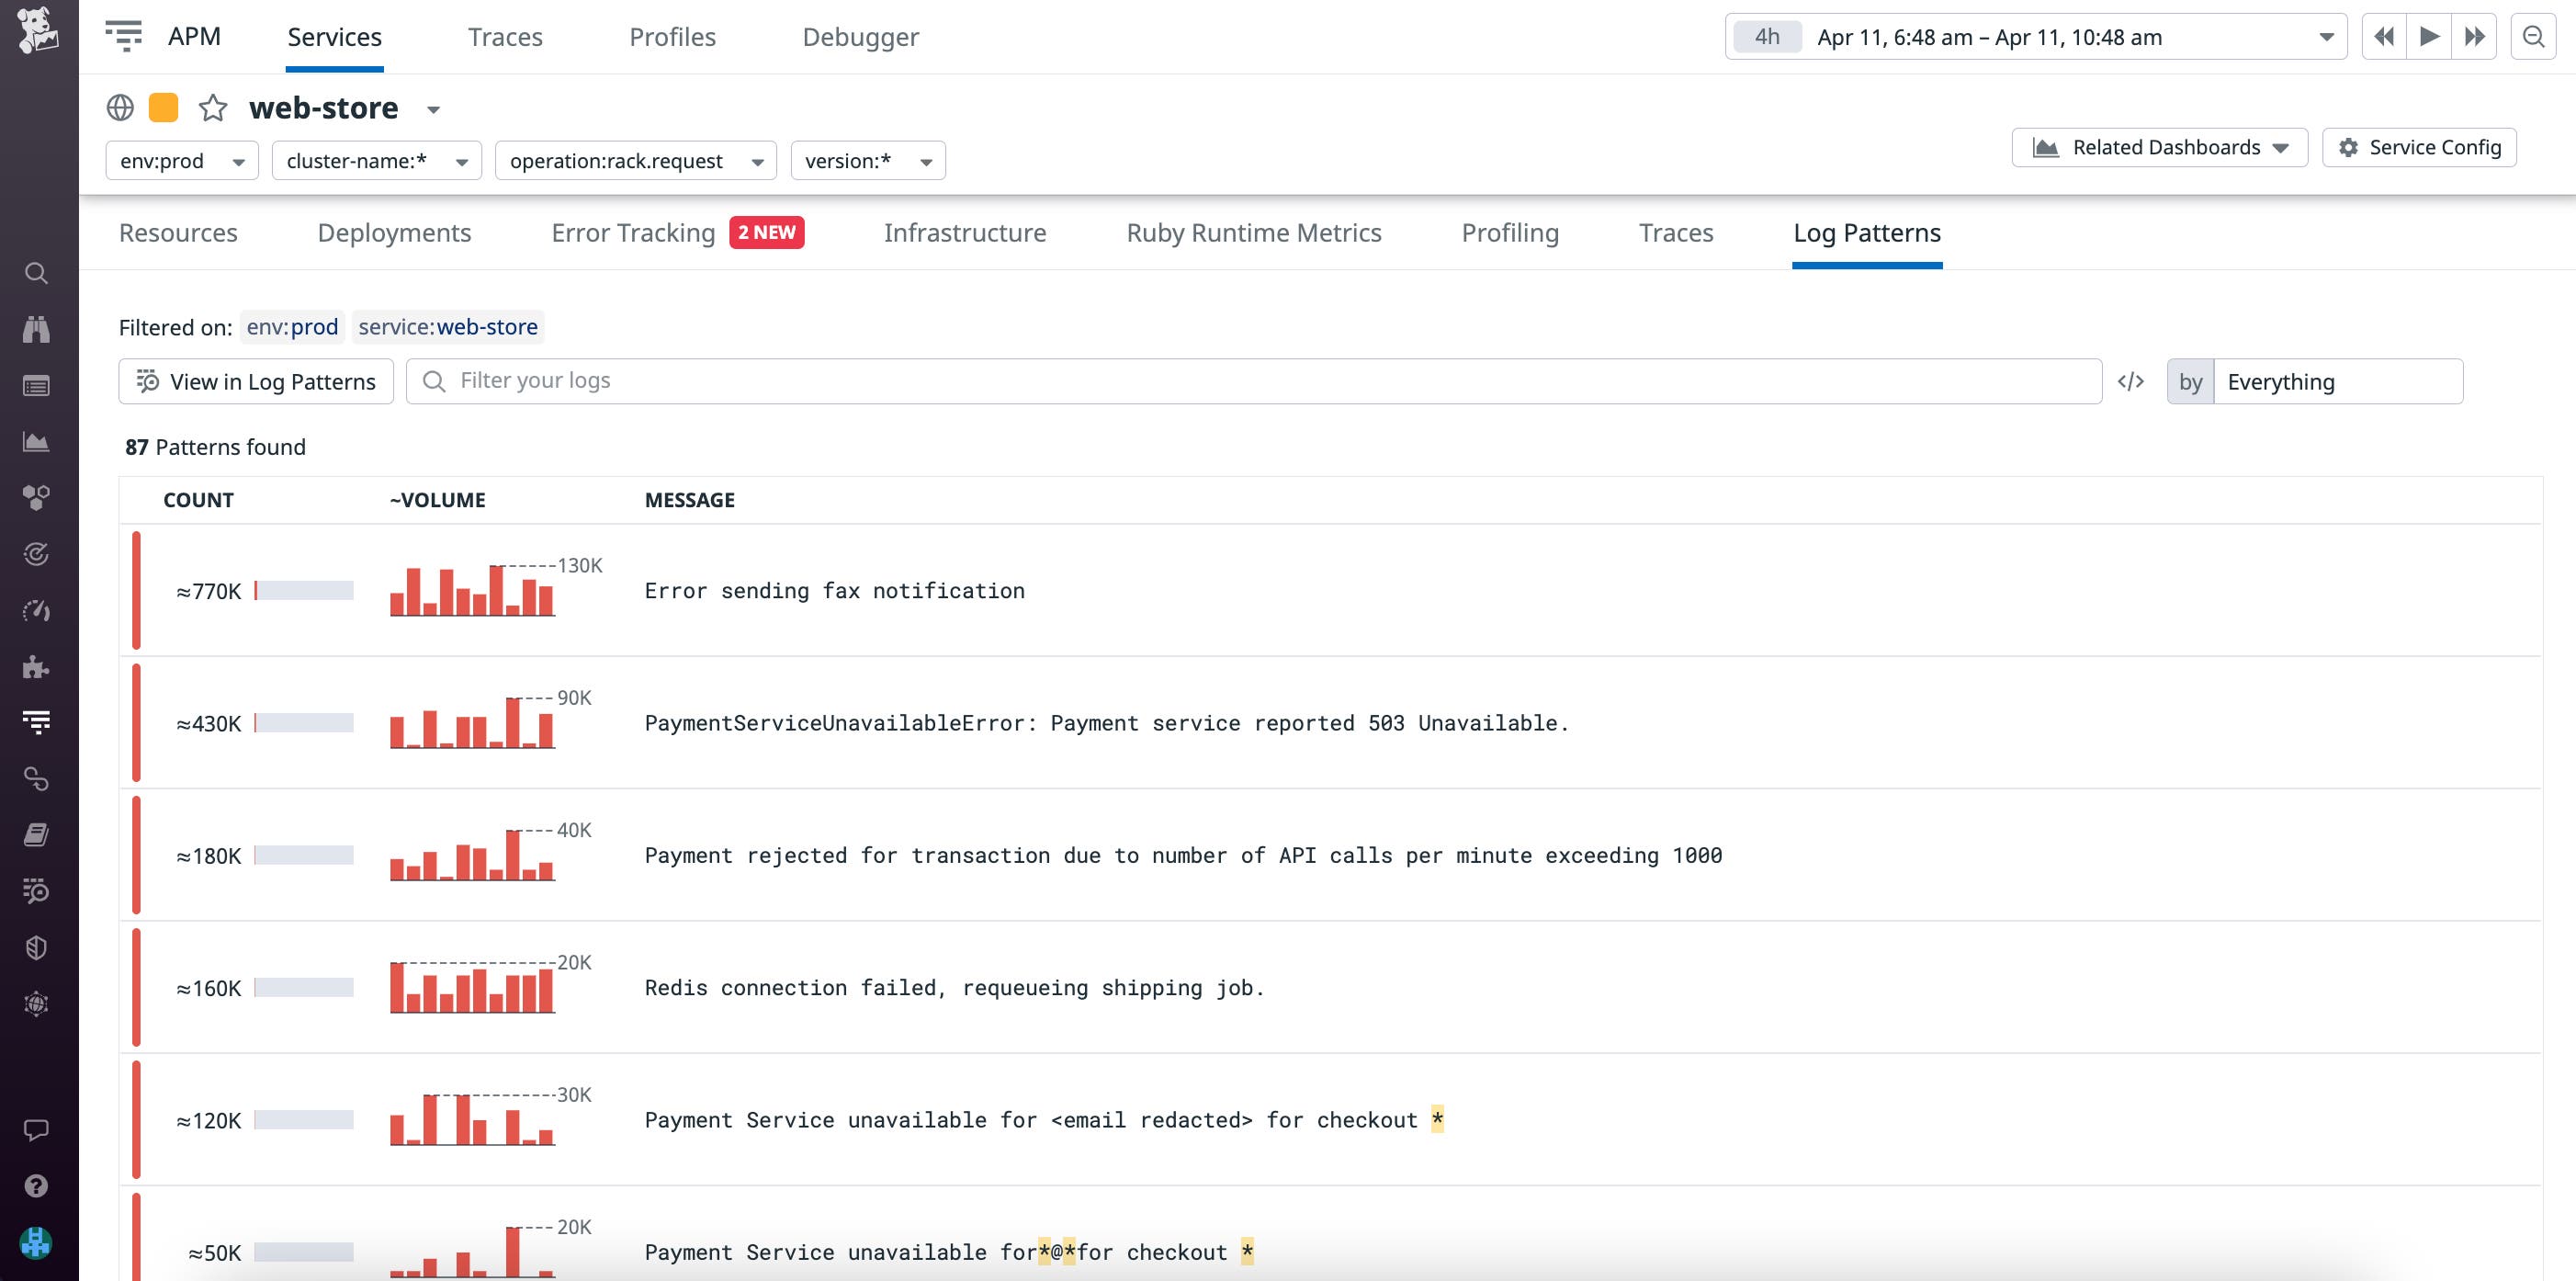
When you begin troubleshooting, it can be difficult to filter through large volumes of data for clues. The new Log Patterns tab helps you cut through the noise by showing you an overview of common patterns in your service’s logs, with error log patterns surfaced first.
Along with log patterns and traces, the Service Page now has a Profiling tab that helps you identify and debug resource-intensive methods that may be slowing down your service. For example, you can click on the method that has the highest CPU time to pivot directly to view related traces, logs, and other data; filter utilization metrics by version; or open up a flame graph to inspect a profile in more detail.
Full visibility into the health of your service
When issues arise, the last thing you want is to spend time tracking down the right data and switching between multiple tools and windows. The updated Service Page includes more telemetry and insights to help streamline your investigation. If you have a Datadog account, select a service from our APM Service List to view the Service Page in action. Or if you’re not yet using Datadog, start monitoring your service health with a free 14-day trial.
