Jordan Obey
Senior Technical Content Writer
Serverless platforms like AWS Lambda have helped accelerate application development by removing the need to provision and manage infrastructure resources. However, serverless architecture presents new monitoring challenges. Because AWS Lambda handles underlying infrastructure for you, you don't have access to system-level metrics. Instead, you have to monitor your Lambda functions for insight into their performance and resource usage. But just viewing Lambda function metrics alone may not be enough to get to the bottom of an issue. If function executions fail, it's important to get context into why they failed and what you can do to quickly resolve the issue.
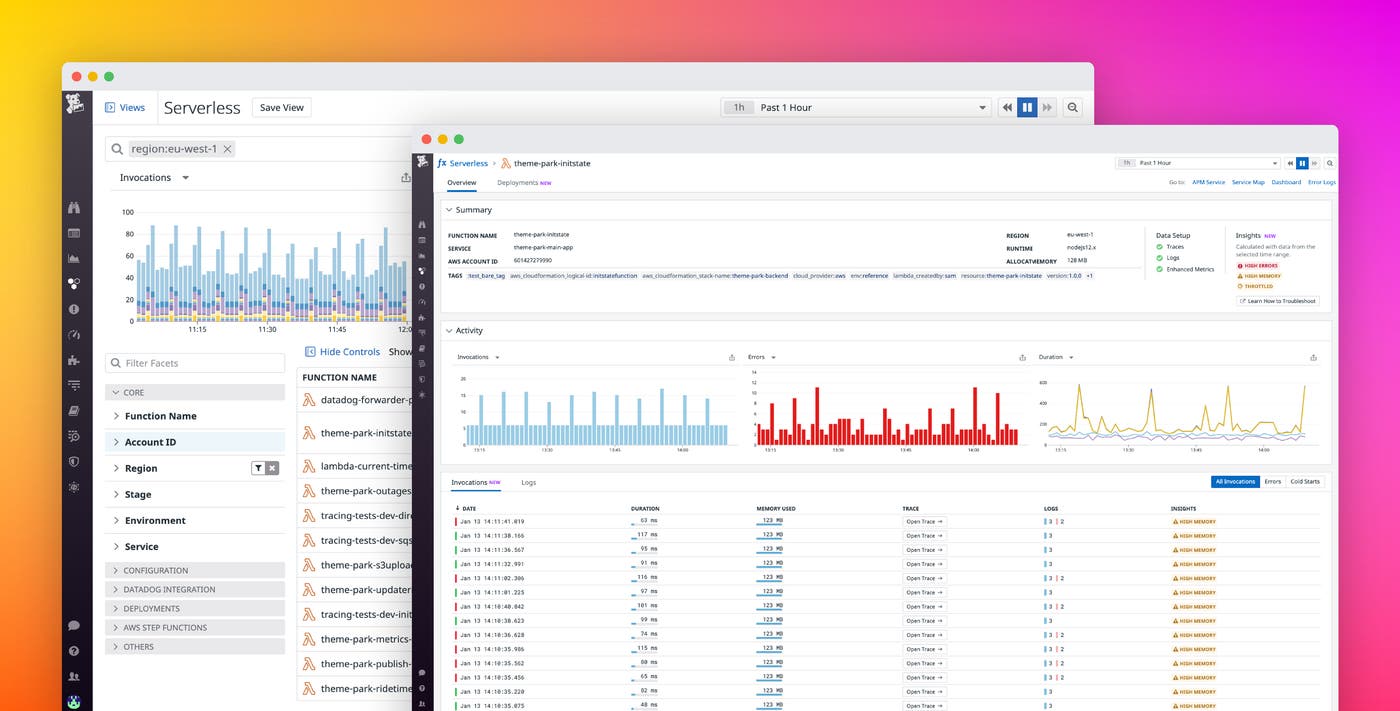
This is why we've added automatically-generated insights to provide deeper visibility into the health and performance of your functions. Datadog uses key data from your Lambda functions to identify and flag those that are failing or performing poorly. If there is an issue with a function, insight flags can provide context into the nature of the problem (such as high memory usage, cold starts, or over-provisioned memory) so you can begin troubleshooting errors or optimizing your functions' resource allocation quickly. We've also added additional UI features to the Lambda function overview page to make it even easier to pivot from your function invocations to relevant traces and logs for immediate troubleshooting.
In this post, we'll walk through how you can use generated insights to:
drill down into functions' relevant traces and logs for troubleshooting
Identify root causes of Lambda function errors at a glance
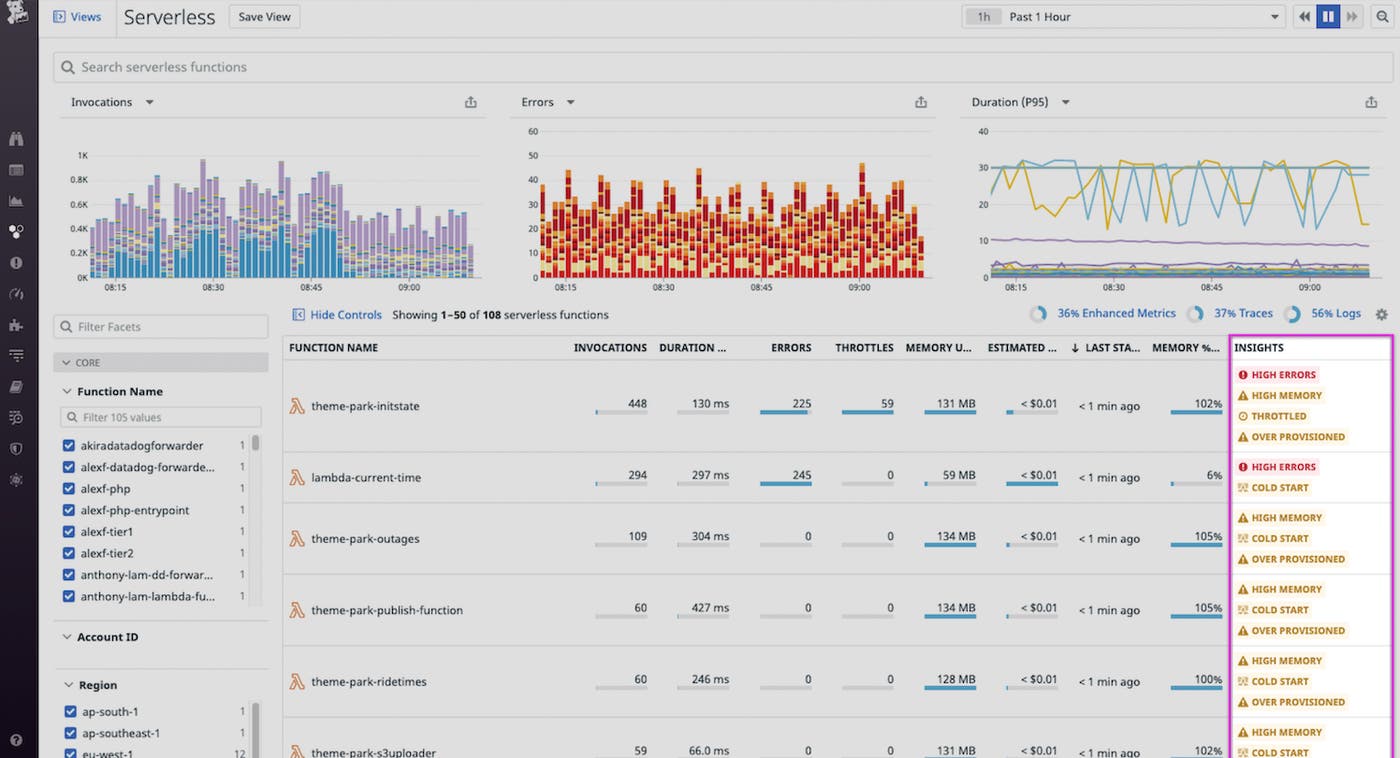
Troubleshooting serverless functions can be challenging since issues can have any number of causes, including insufficient memory and code-level errors. To meet this challenge, Datadog now uses a combination of metrics, traces, and logs from your functions to automatically produce insights that you can view in the function table available in the Serverless homepage, making it easier to identify issues occurring in your Lambda functions.

Datadog can display one or more of many possible errors and warnings for a function: High Errors, High Memory Usage, Out of Memory, High Duration, Timeout, Cold Starts, Throttled, High Iterator Age, and Over Provisioned. If Datadog detects that a function has met a warning condition within a selected timeframe, it will automatically display the corresponding flag so developers can immediately know where to direct their attention while troubleshooting their Lambda functions. For example, if more than 10 percent of invocations in a specified timeframe result in errors, a High Errors error will appear in the Insights column.

You can then dive down into individual functions so you can start troubleshooting issues with a more granular view of each invocation.
Spot invocation problems in real time
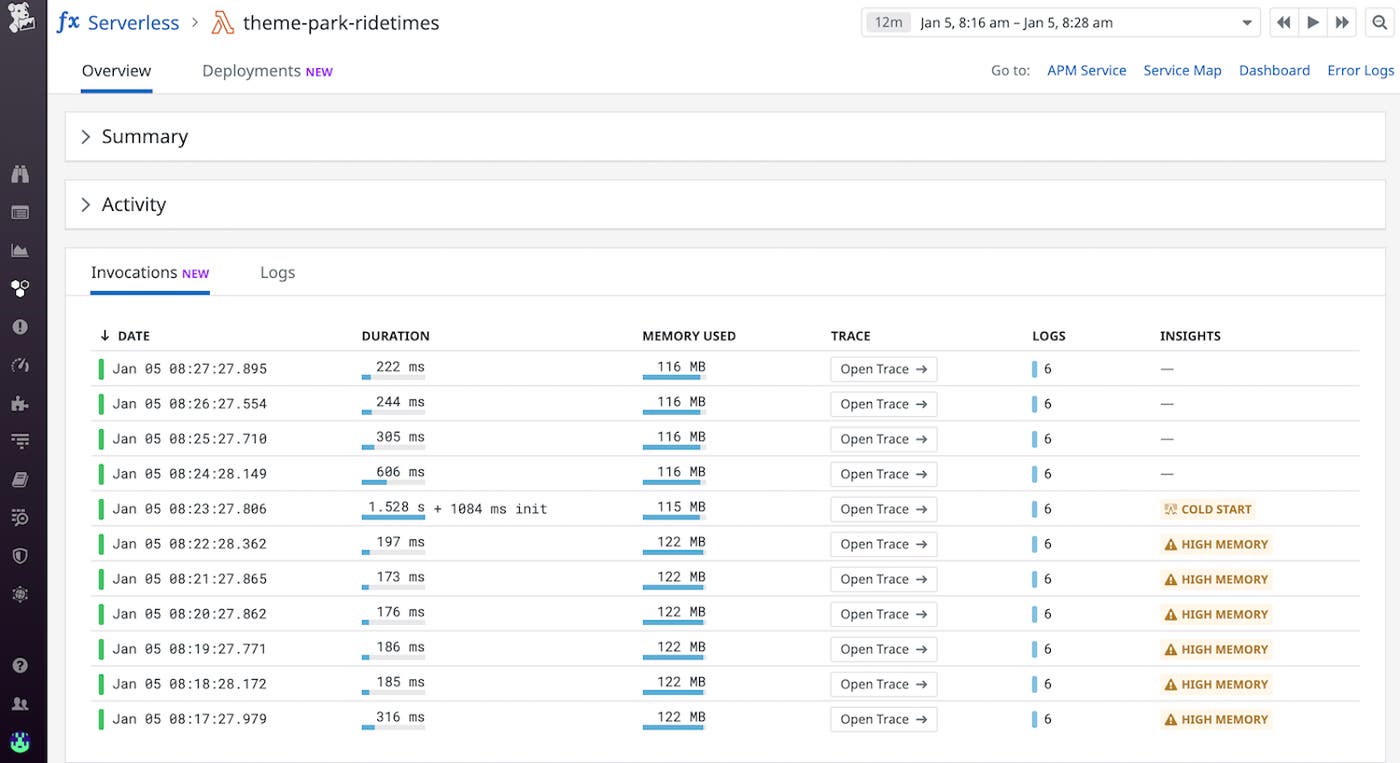
To help you gain deeper context into your function invocations, we've included additional details in the overview pages of your Lambda functions. Each function has a table that provides a real-time stream of invocations. These tables include metadata for each invocation so that you can tie insights directly to specific invocations. For example, if you see a High Memory Usage warning on the serverless homepage, you can drill down to that function and then see exactly which of its invocations used more memory than expected. This enables you to quickly take steps to troubleshoot the issue, including reconfiguring the function's memory allocation, and reduce your time to recovery.

Correlate failing Lambda functions with traces and logs
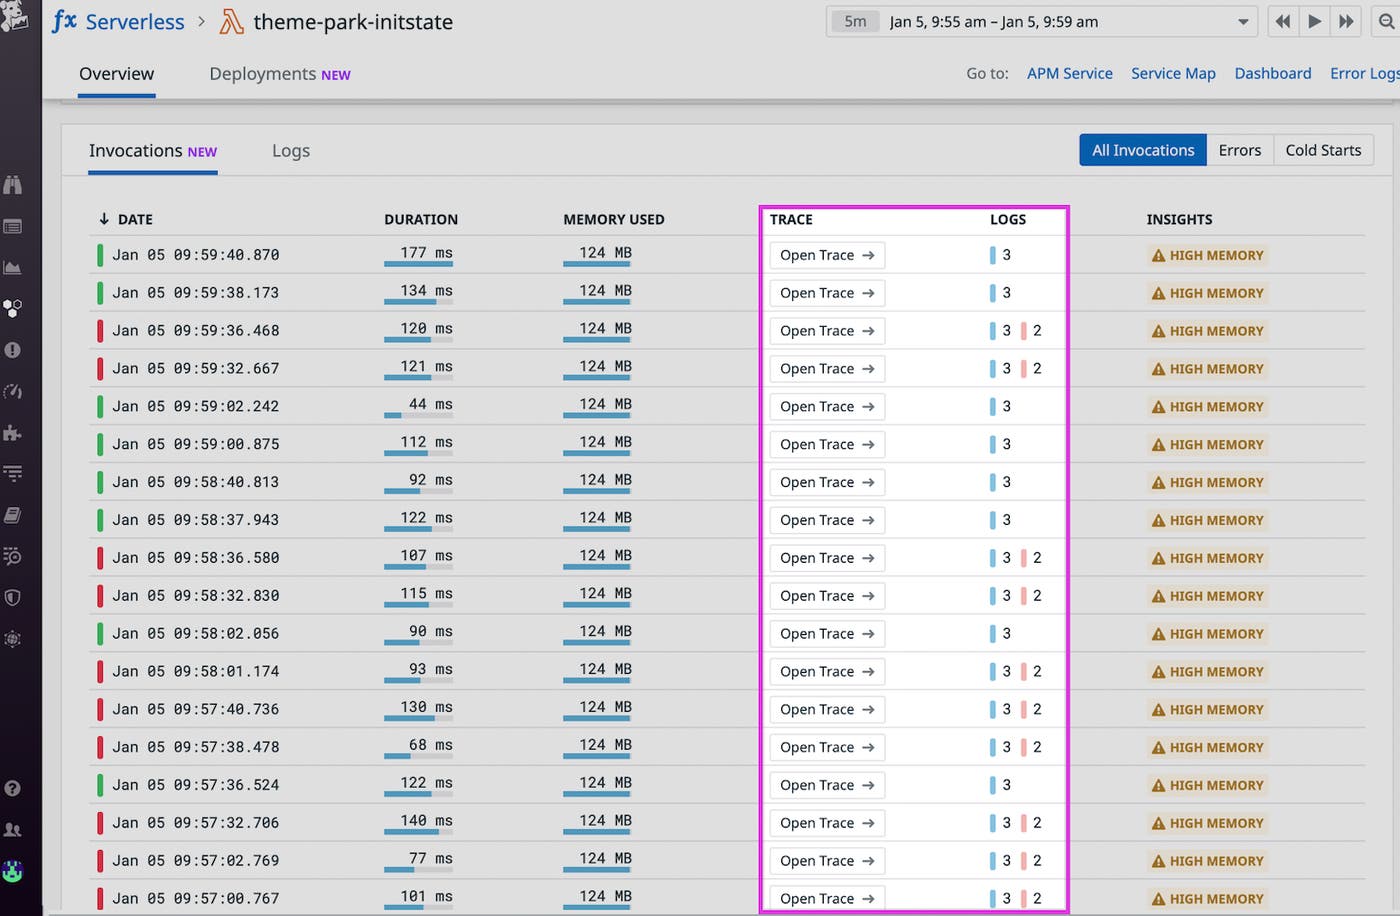
Datadog automatically ties functions to their associated traces and logs so you can get more context around each function's invocation. Now, Datadog makes it even easier to pivot to relevant APM and log data for easier troubleshooting by including "Trace" and "Logs" columns in the invocation table. Clicking "Open Trace" brings you to the request trace for that specific function invocation. The "Logs" column lists the number of log lines and errors associated with an invocation, so you can see at glance if any particular invocation has an unexpectedly large volume of logs, possibly indicating an issue.

If you see that a function has a surplus of errors in the Serverless homepage, you can navigate to its invocation table and use the "Logs" column to view those errors so that you know where to direct your troubleshooting.
Your serverless functions in full view
Datadog immediately pulls together key health and performance data to surface the insights you need to monitor your serverless applications and AWS Lambda functions so you can spot and mitigate issues as soon as they arise. If you currently have a Datadog account, you can monitor your serverless functions alongside more than 1,000 other technologies to get end-to-end visibility into your entire infrastructure.
If you don't have a Datadog account, sign up today for a 14-day free trial.

