Jinwu Liu

David Pointeau

Alex Guo
Engineering, operations, and security teams can struggle to make sense of their telemetry data in isolation. Logs, metrics, and events tell what is happening but are often missing critical metadata like who owns what, where it’s coming from, or indicators of attack. These gaps in visibility slow down incident response, complicate cost control, and make business or security analytics much harder.
With Reference Tables, you can now directly import external metadata from SaaS providers such as Snowflake, Salesforce, ServiceNow, and Databricks for powerful enrichment and joins. Instead of manually downloading CSVs or juggling datasets across SaaS providers, you can bring business, ownership, and security context into a unified observability and security platform.
This capability can be applied to metadata from a wide range of tools and services. In this post, we’ll focus on several real examples of how you can use Reference Tables for complex joins across data sources, richer dashboard visualizations, crucial context in pipelines, and rapid anomaly detection.
Use Snowflake ownership tables for business intelligent cost control
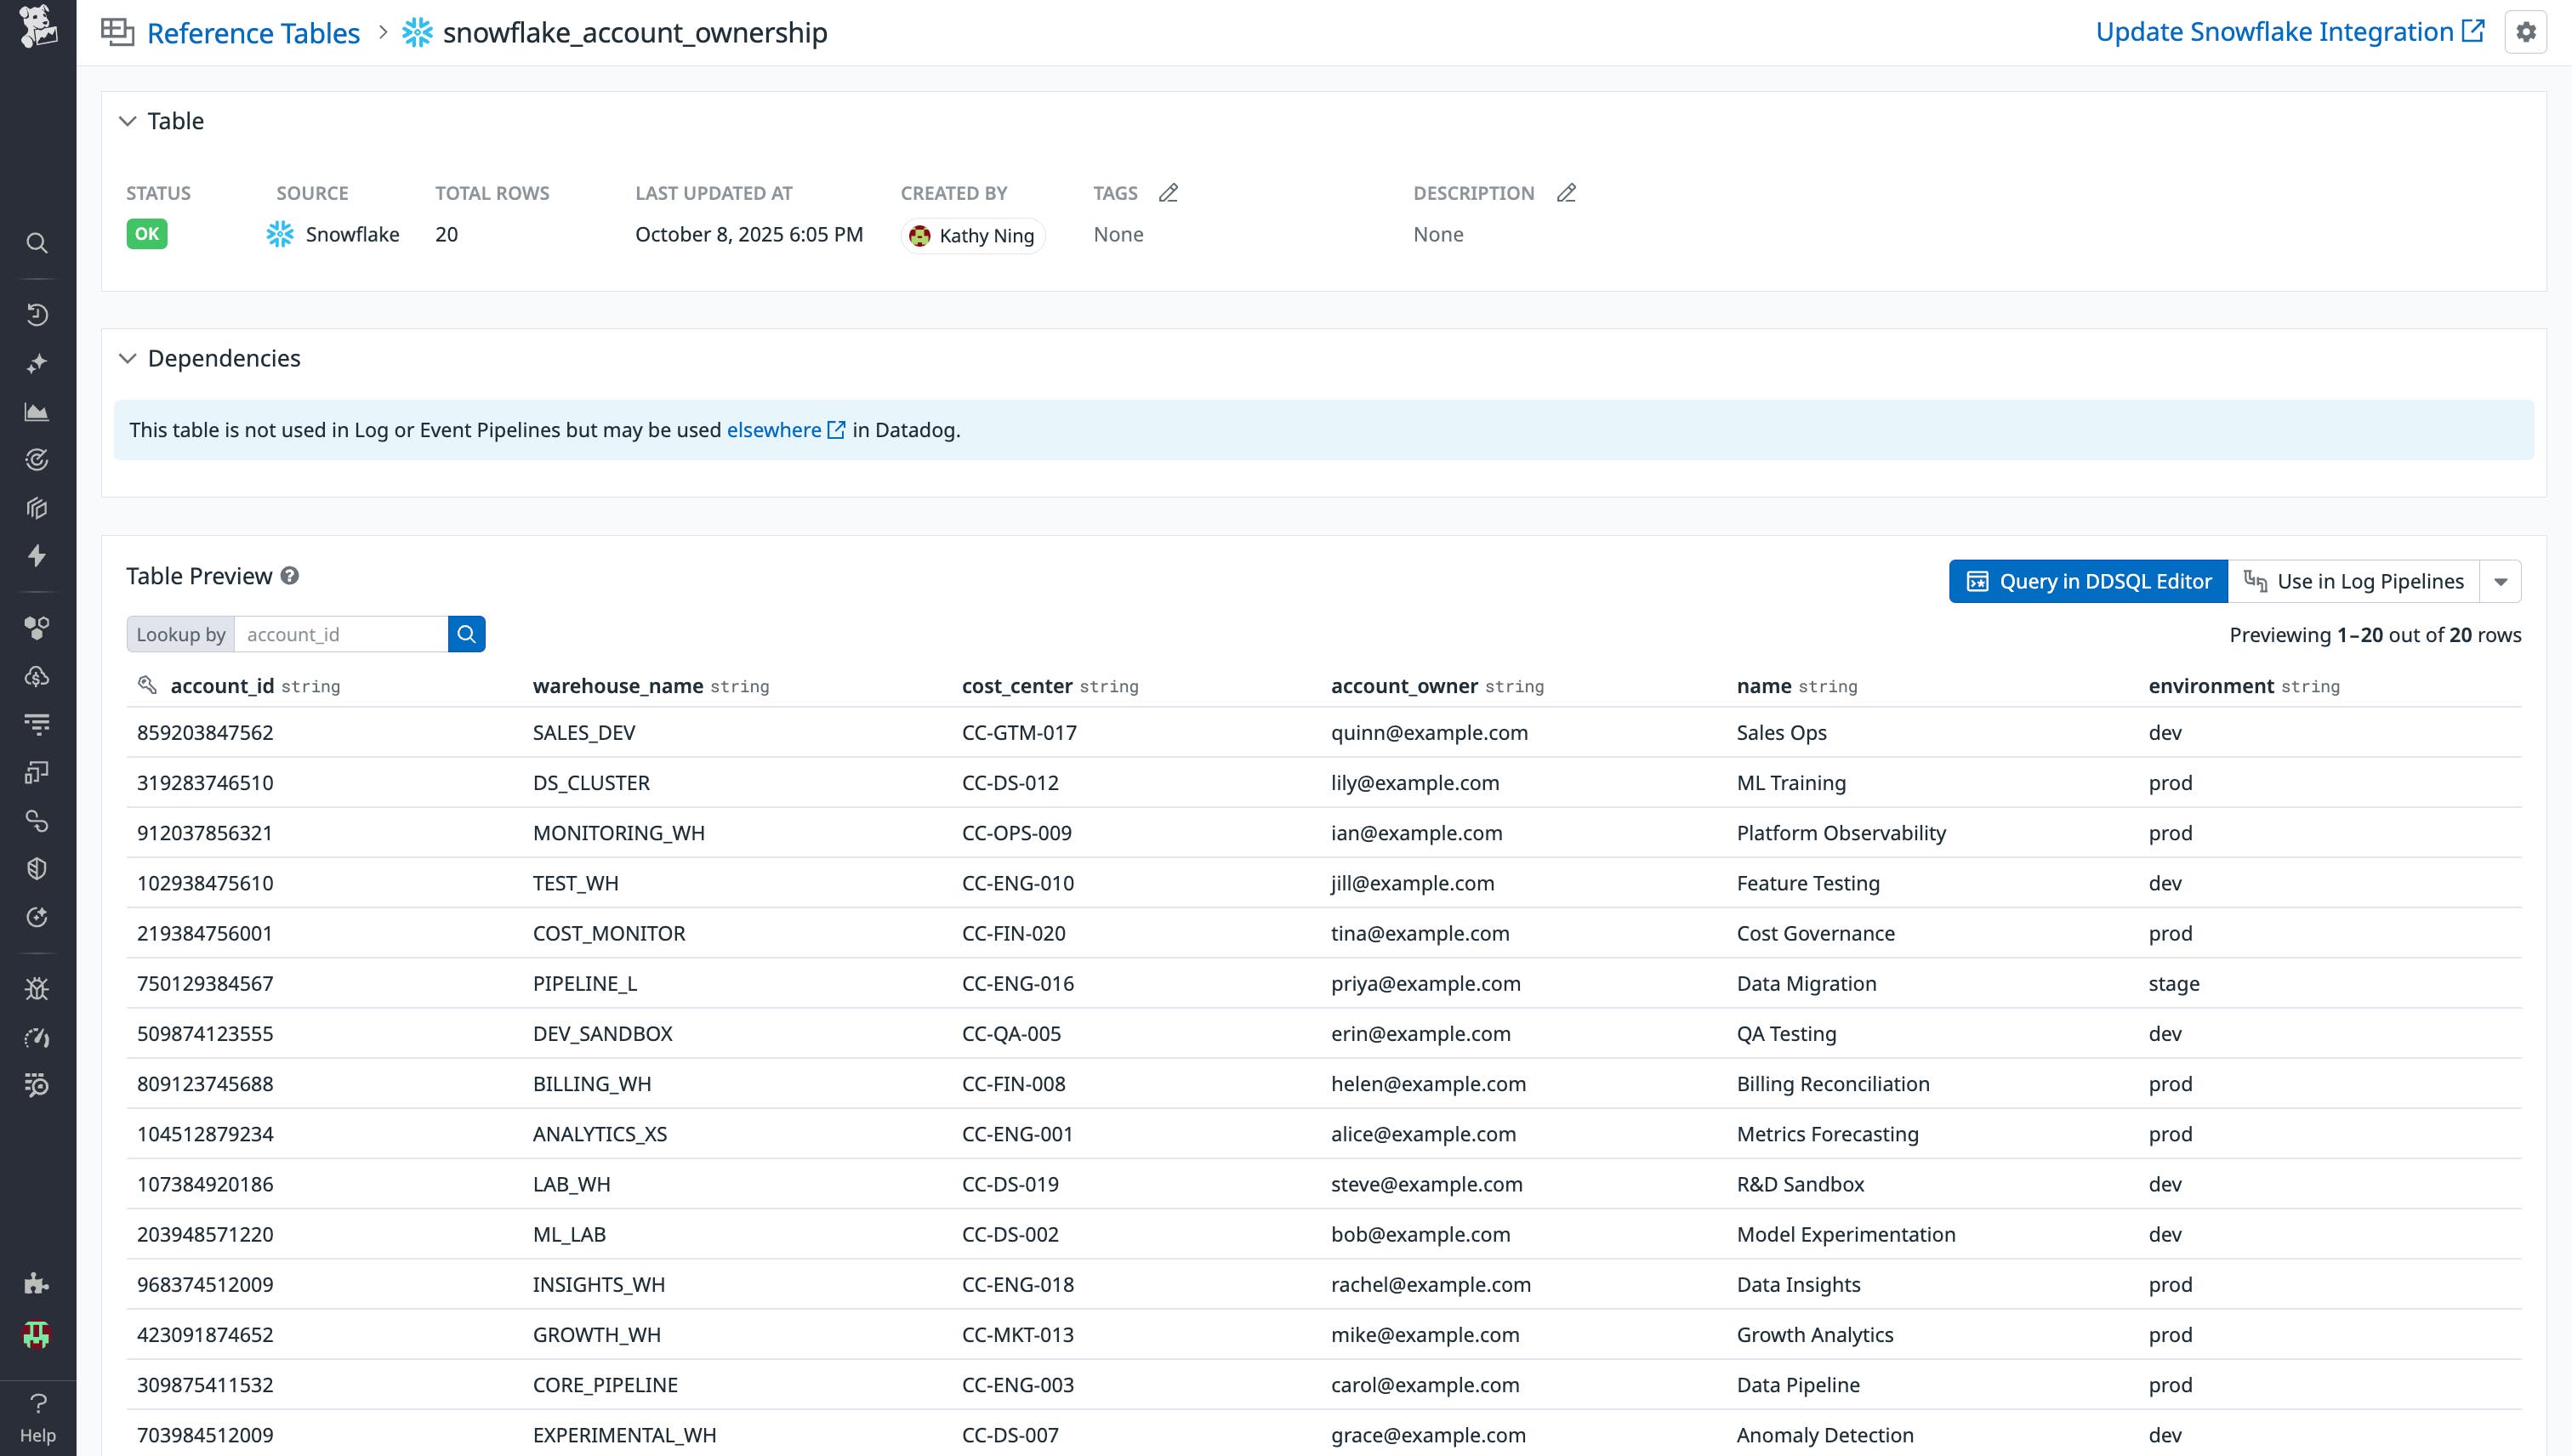
Companies may get hit with surprise Snowflake bills when one team’s experimental query or mis-sized warehouse causes a spike in costs, leaving finance and engineering teams scrambling to determine the cause. Without ownership or project metadata connected to usage, it’s hard to hold teams accountable or optimize spend proactively.
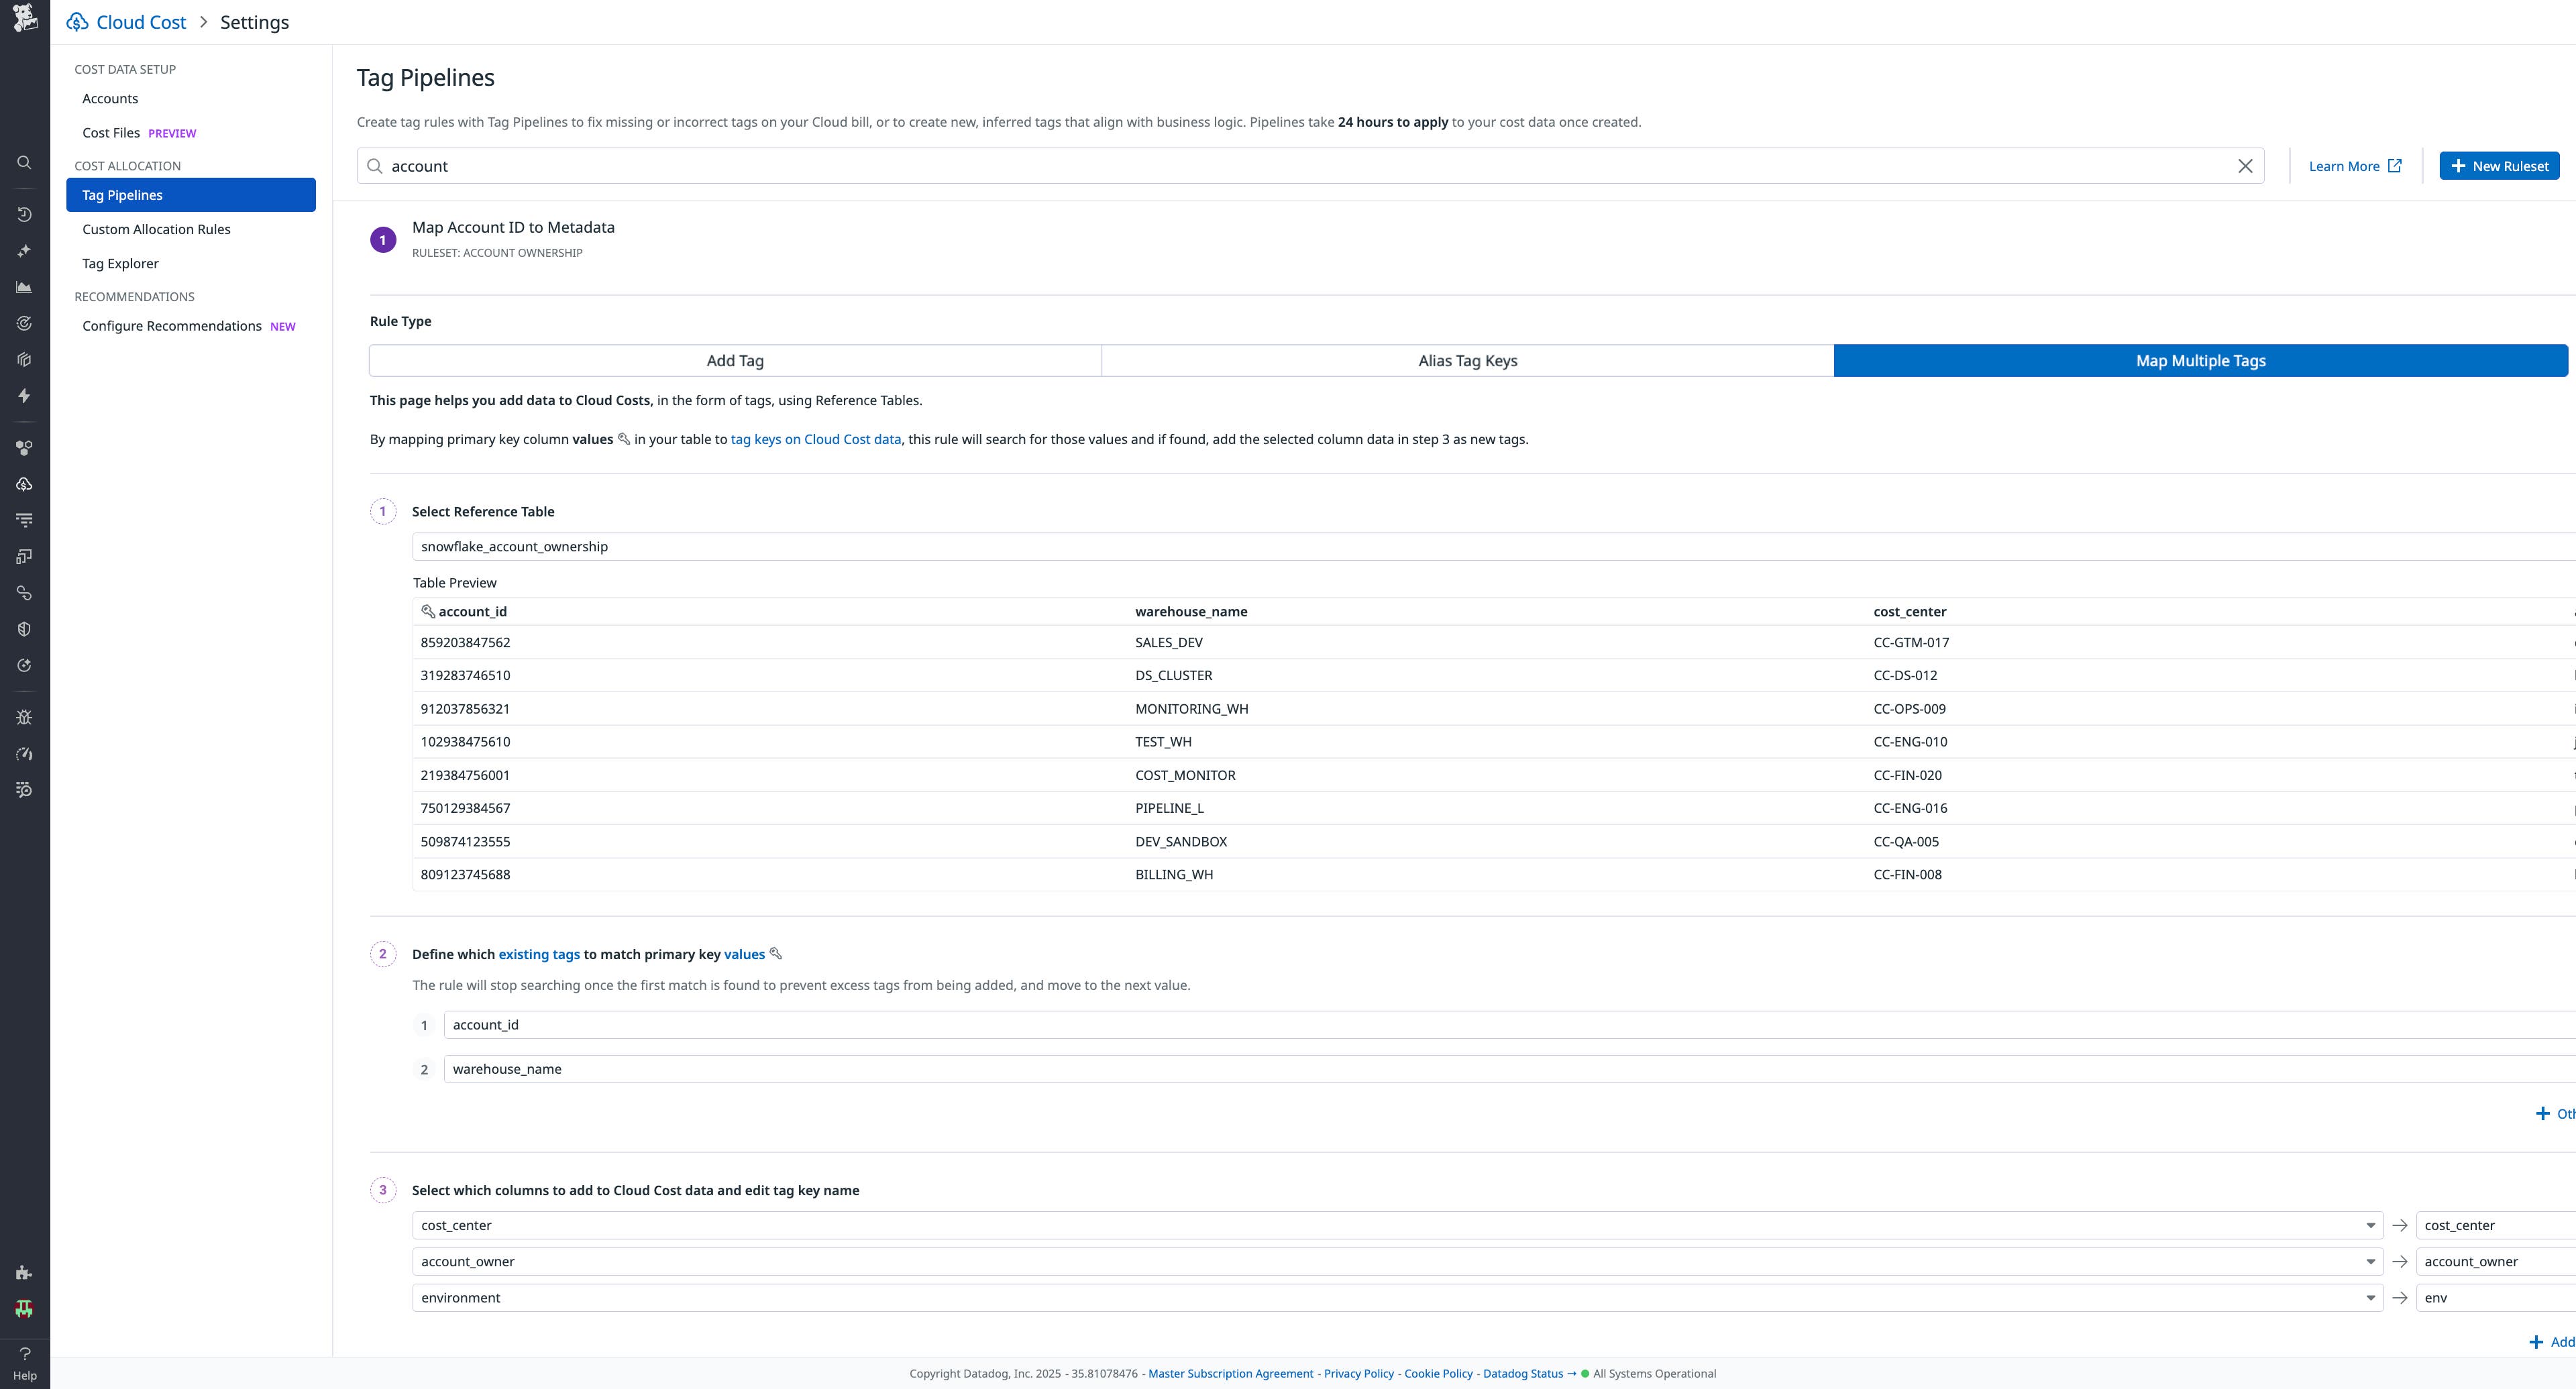
By bringing in a Reference Table from Snowflake that maps account IDs to the cost centers or team owners, you can correlate users with log entries that reflect query history or even apply tags at ingest via Cloud Cost Management tag pipelines. You can then attribute costs downstream in cost attribution dashboards or take action to provision usage in Cloud Cost Management. This correlation enables cost transparency and accountability for teams and allows engineers to preempt monthly surprises.
Add ServiceNow CMDB metadata to events to triage faster and reduce impact
When incidents occur, teams often waste time figuring out what asset is implicated, which business service it supports, who owns it, and what SLA or priority applies. Slower triage leads to longer outages, more customer impact, and more firefighting.
With our ServiceNow integration, Reference Tables can automatically add CMDB fields (e.g., owner, location, and firmware version) to logs and events using a primary key such as host name or device IP. Lookup Processors will then keep tables updated from ServiceNow queries, with no manual CSV uploads required.
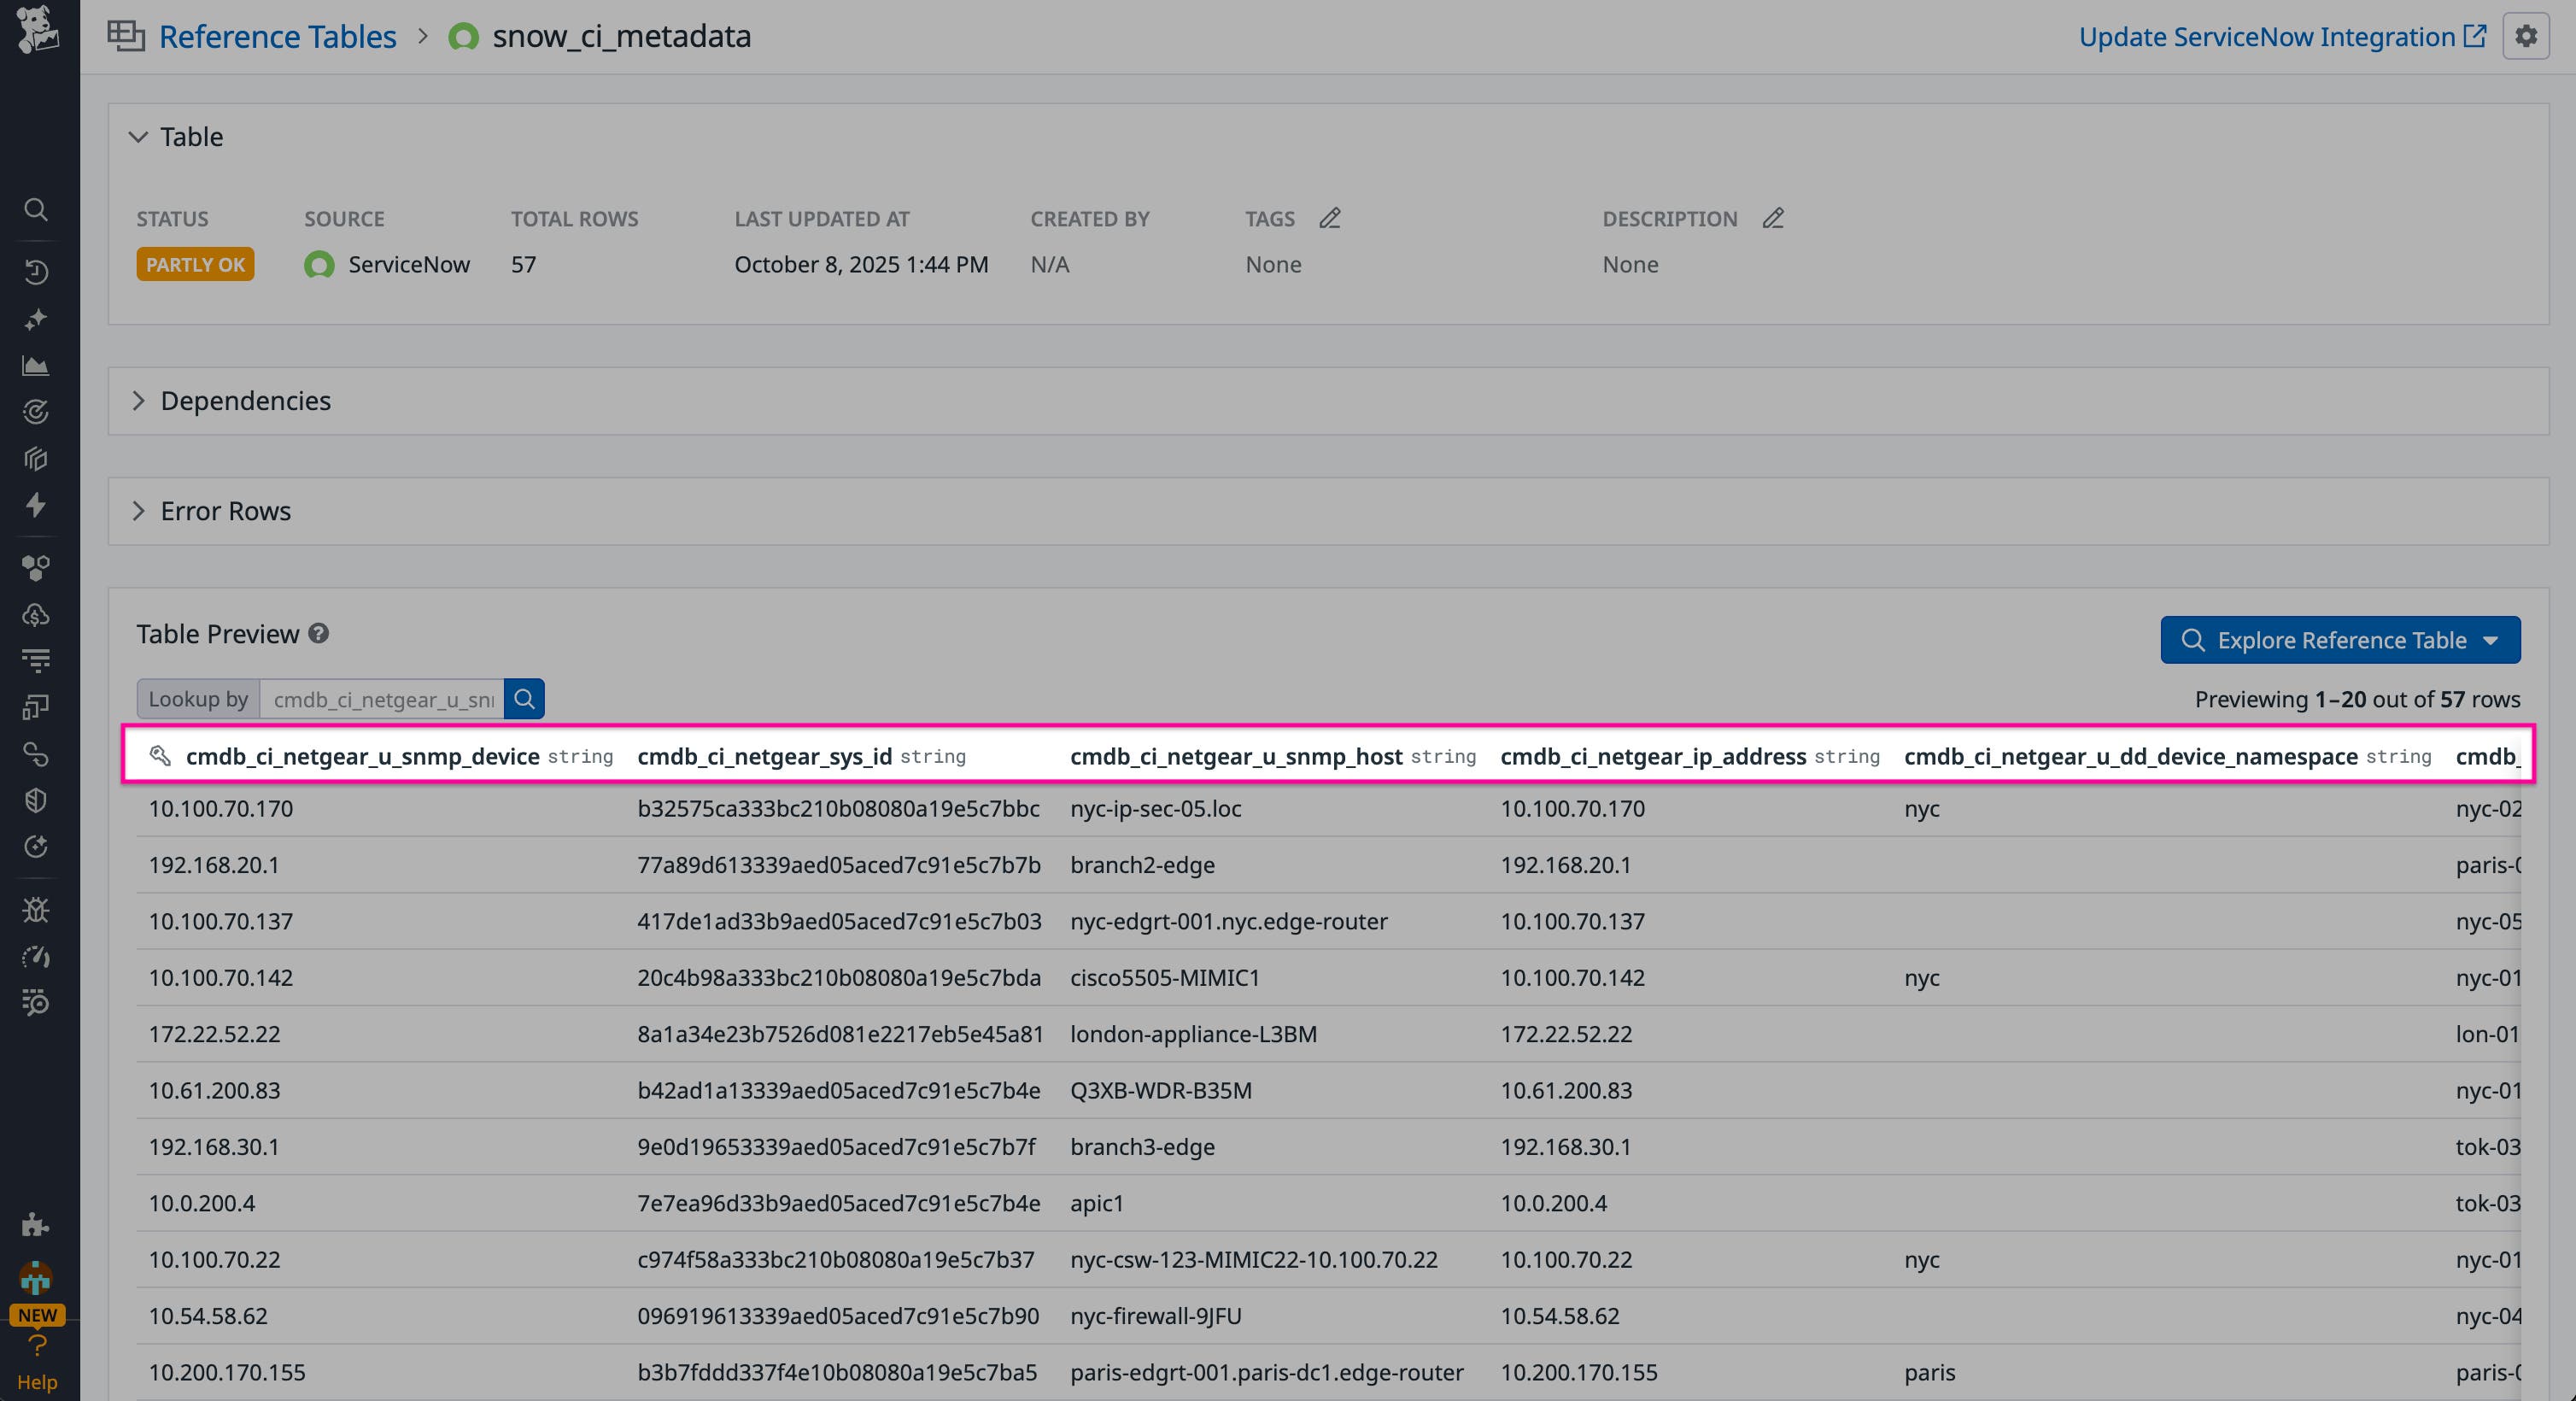
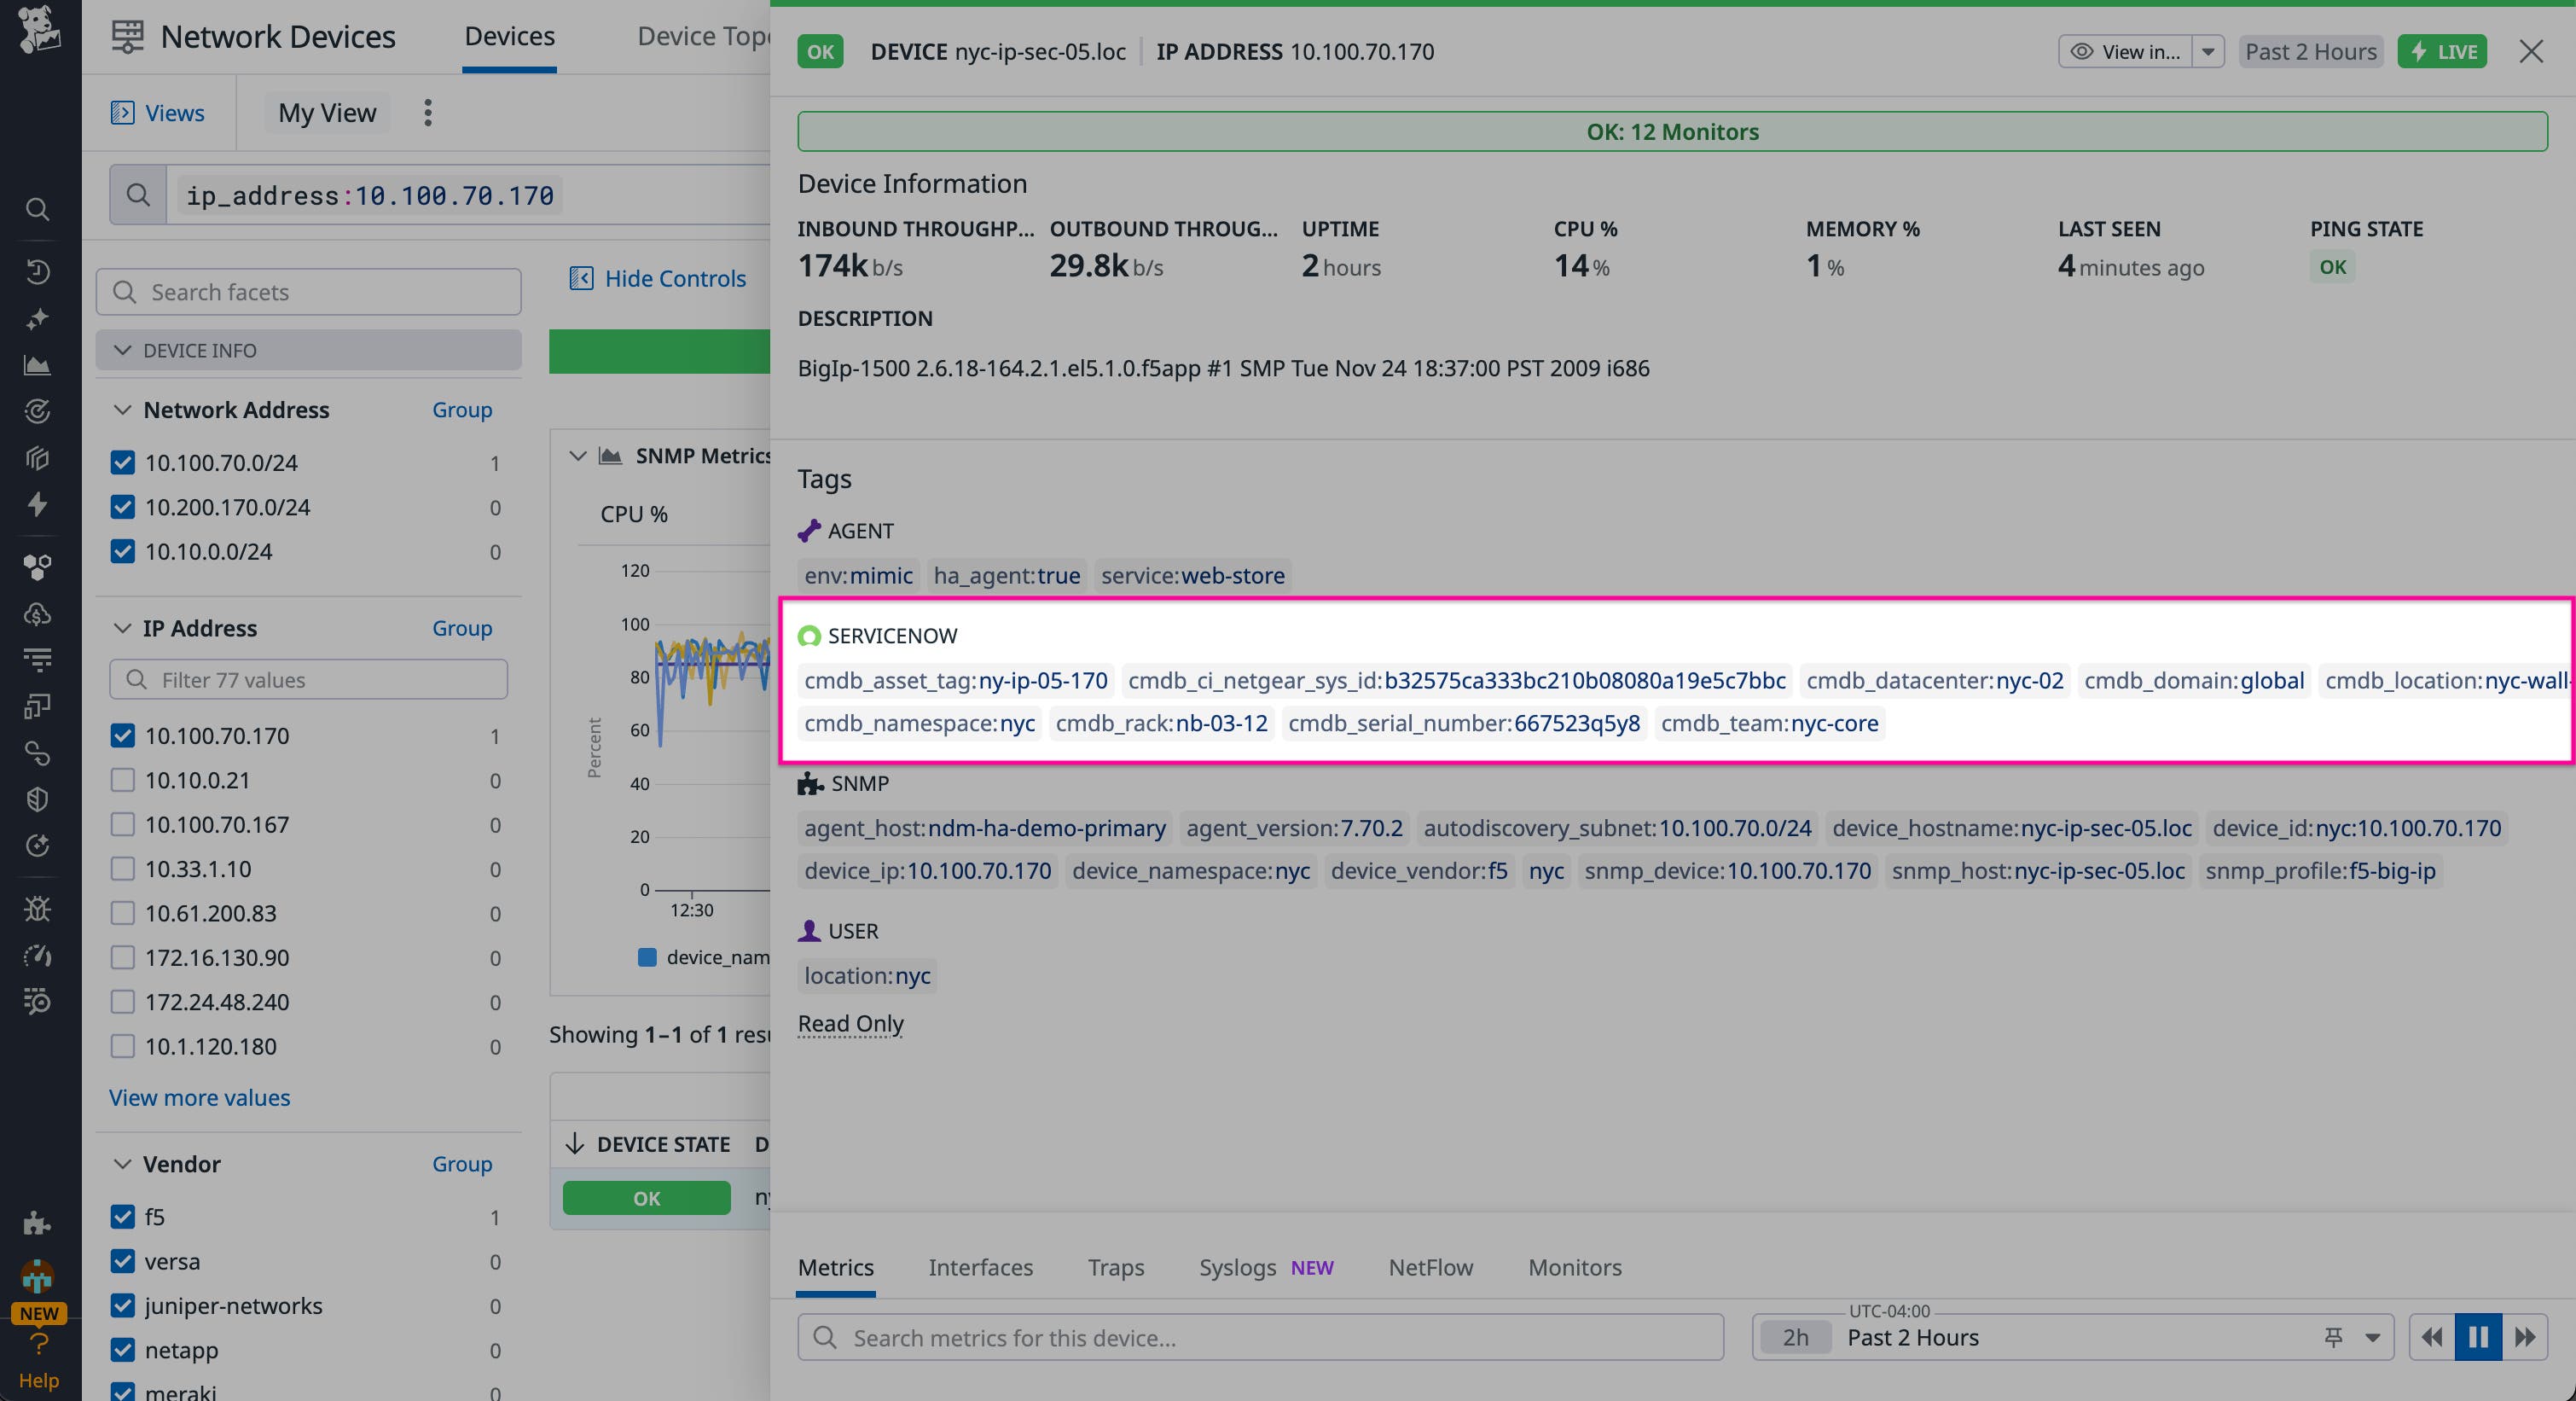
For example, you can enrich network traffic logs with ownership and location data, making it easy to identify contacts or device details during incidents. Reference Tables also extend to events generated by alerts and Watchdog™, letting you correlate issues across devices and reduce noise. With Datadog Log Management, you can then turn this enriched data into metrics, dashboards, and anomaly detection for investigations and troubleshooting.
Understand product usage across customer segments with Salesforce metadata
Let’s say your RUM events are showing performance problems like slow page loads or user frustration, but your RUM telemetry data lacks specific customer context like account tier or industry the user belongs to. This means urgent fixes may be incorrectly prioritized, leading to churn or SLA breaches, and you may not know it until it’s too late.
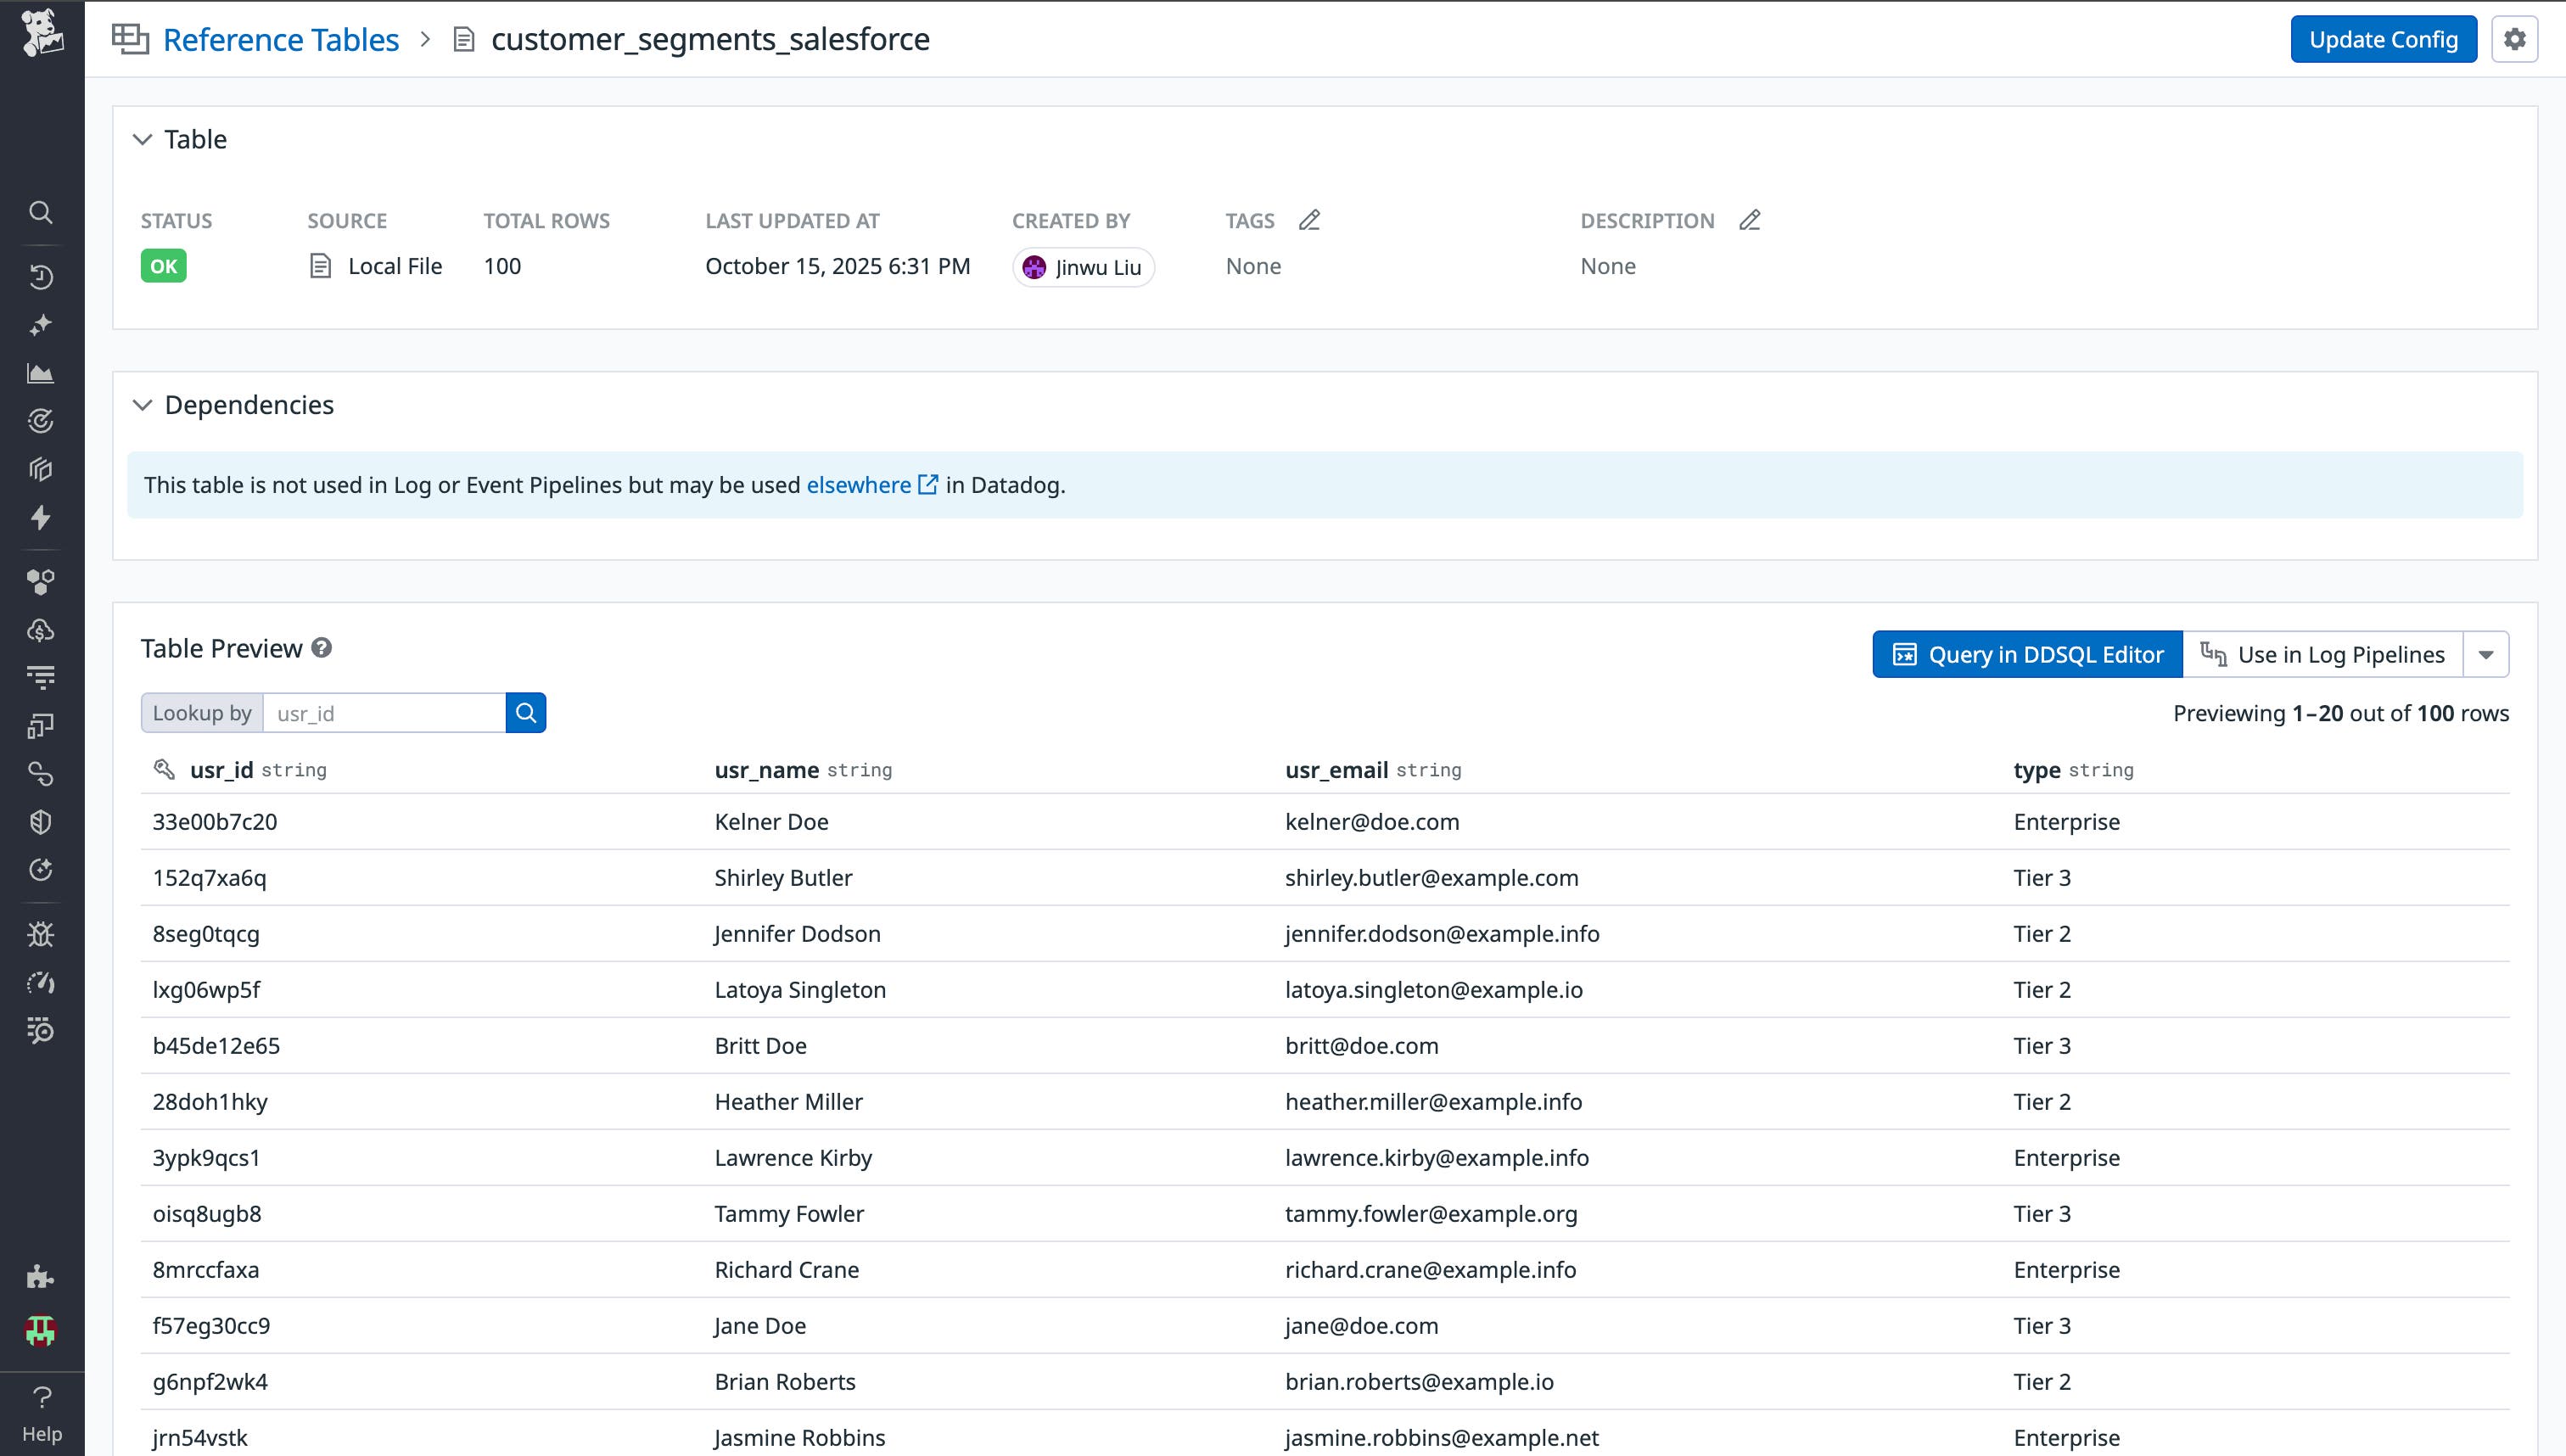
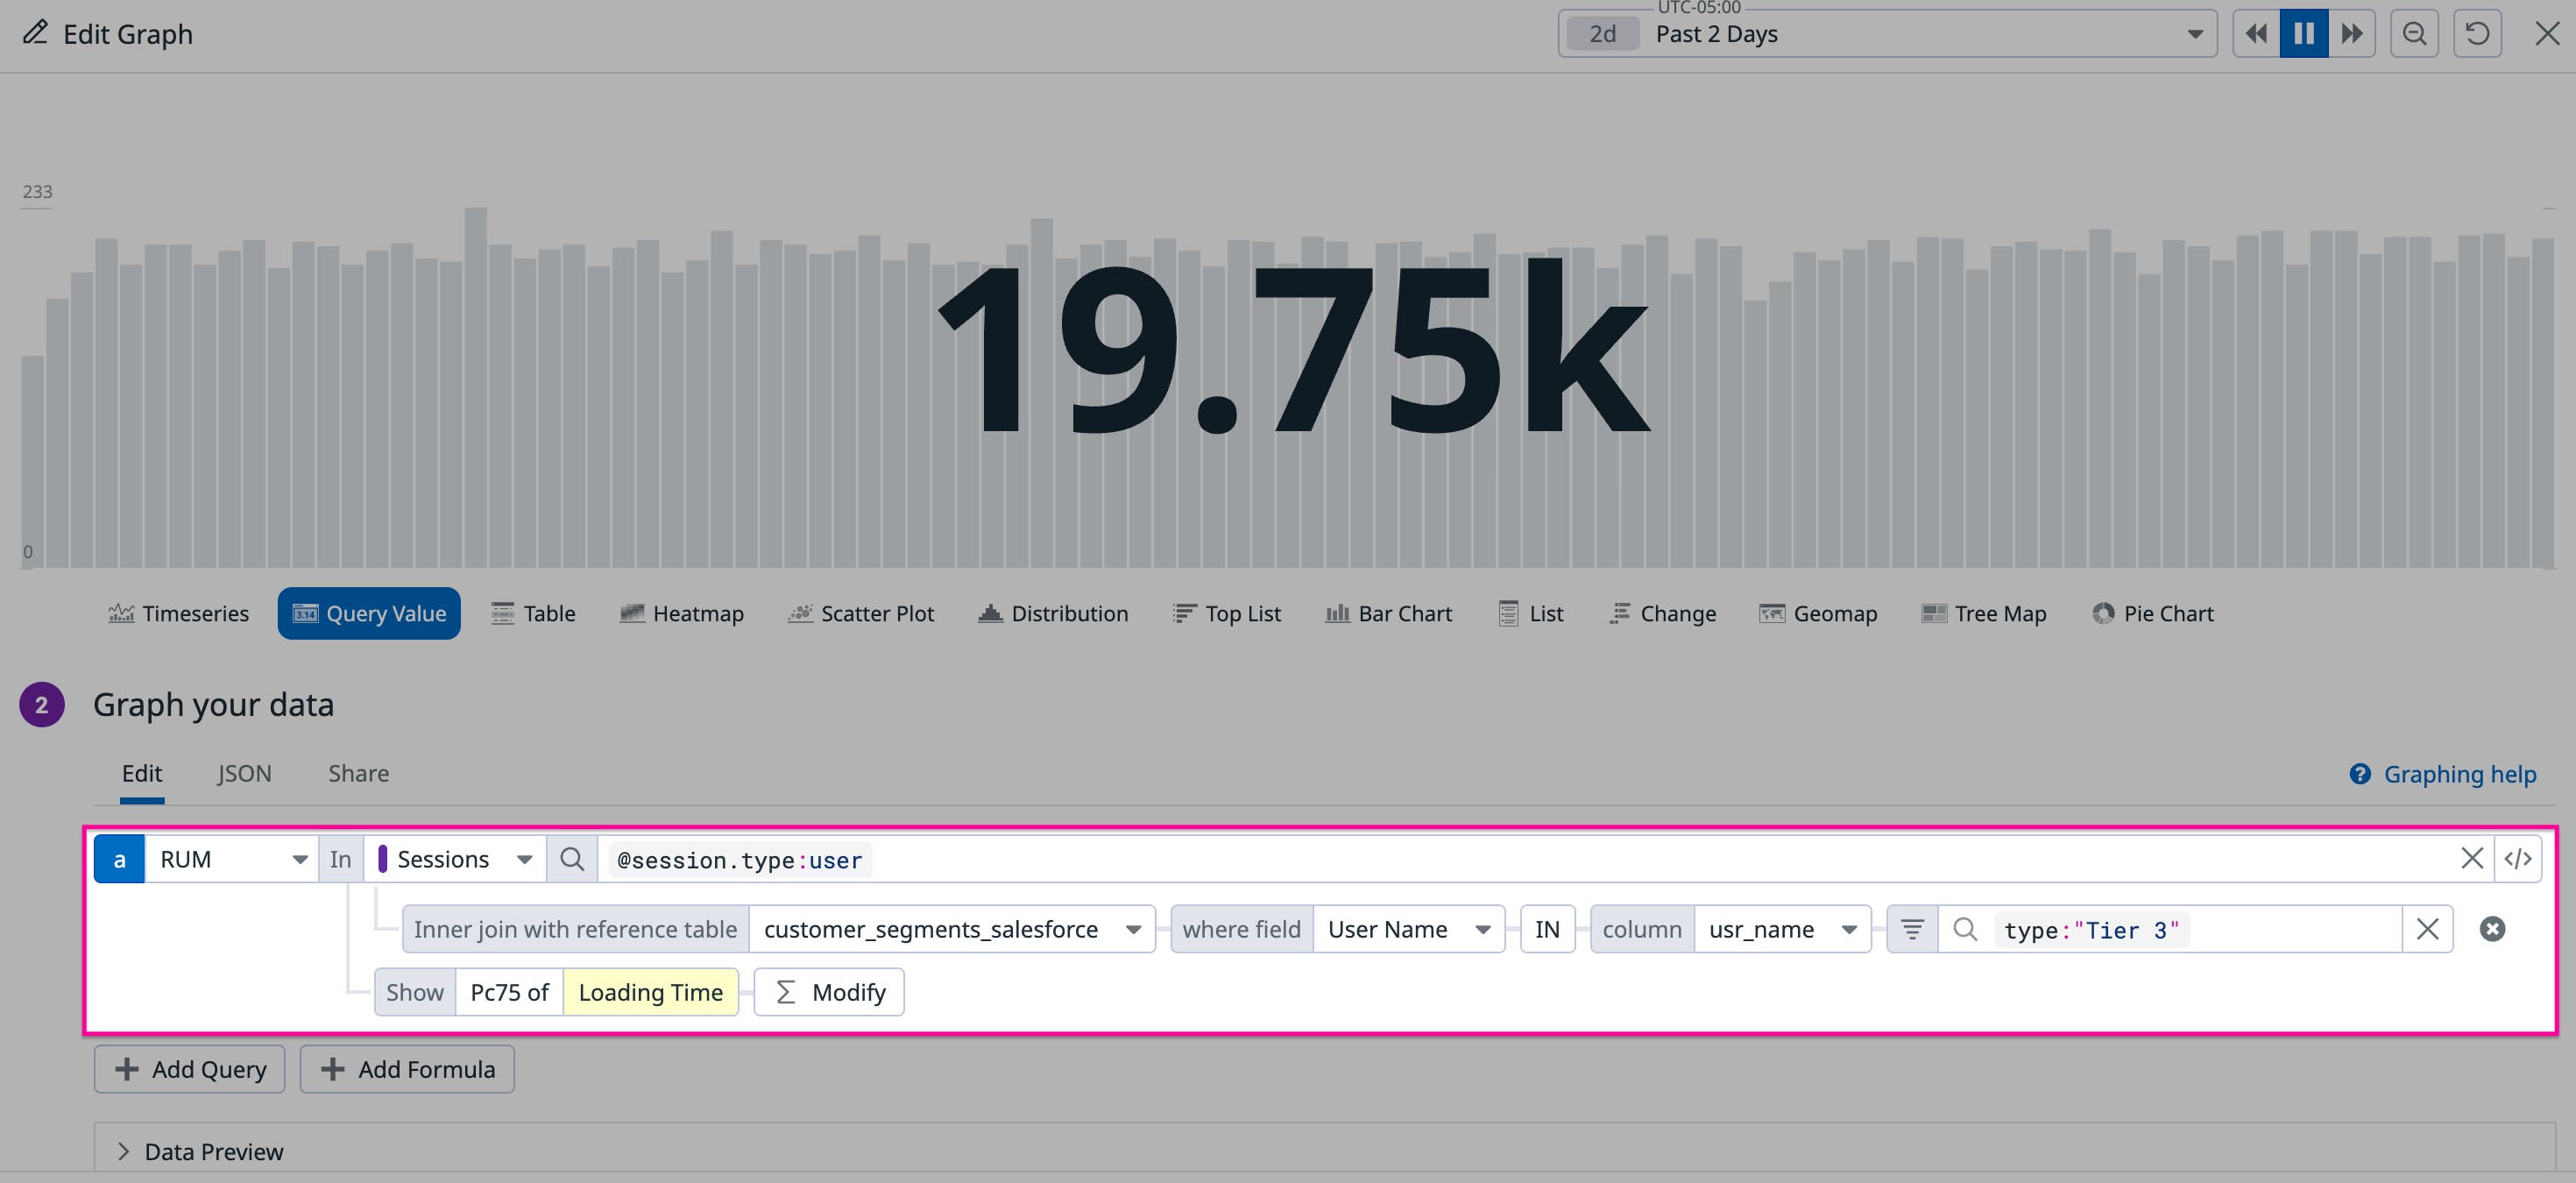
By pulling in a Reference Table via Salesforce that maps user ID to account tier or support level, you can join that data with your RUM session data in dashboards, which allow you to create visualizations to segment or group sessions by business-important customer attributes like “customers in region X” or “P99 page load time for enterprise customers exceeding a certain threshold.” This allows you to pinpoint performance degradations or provide targeted support, directly benefiting customer experience and engagement.
Detect permission misconfigurations using Databricks metadata
In large Databricks deployments, permissions drift and misconfigurations are hard to spot until they lead to data leakage, unauthorized access, or compliance violations. Meanwhile, job logs and cluster events often don’t include metadata about who owns clusters or what permissions and configurations are enforced. Without that context, teams often discover issues only after audit failures or sensitive data has been accessed inappropriately.
By pulling in a Reference Table that maps Databricks cluster or job ID to team information or permission levels, you can join that data with your data pipeline logs and events to detect and act on permission misconfigurations or suspicious configuration changes. For example, you can join logs of filed permission escalations enriched with a Reference Table in a detection rule such as “unexpected permission change in prod by team X” for quick investigations.
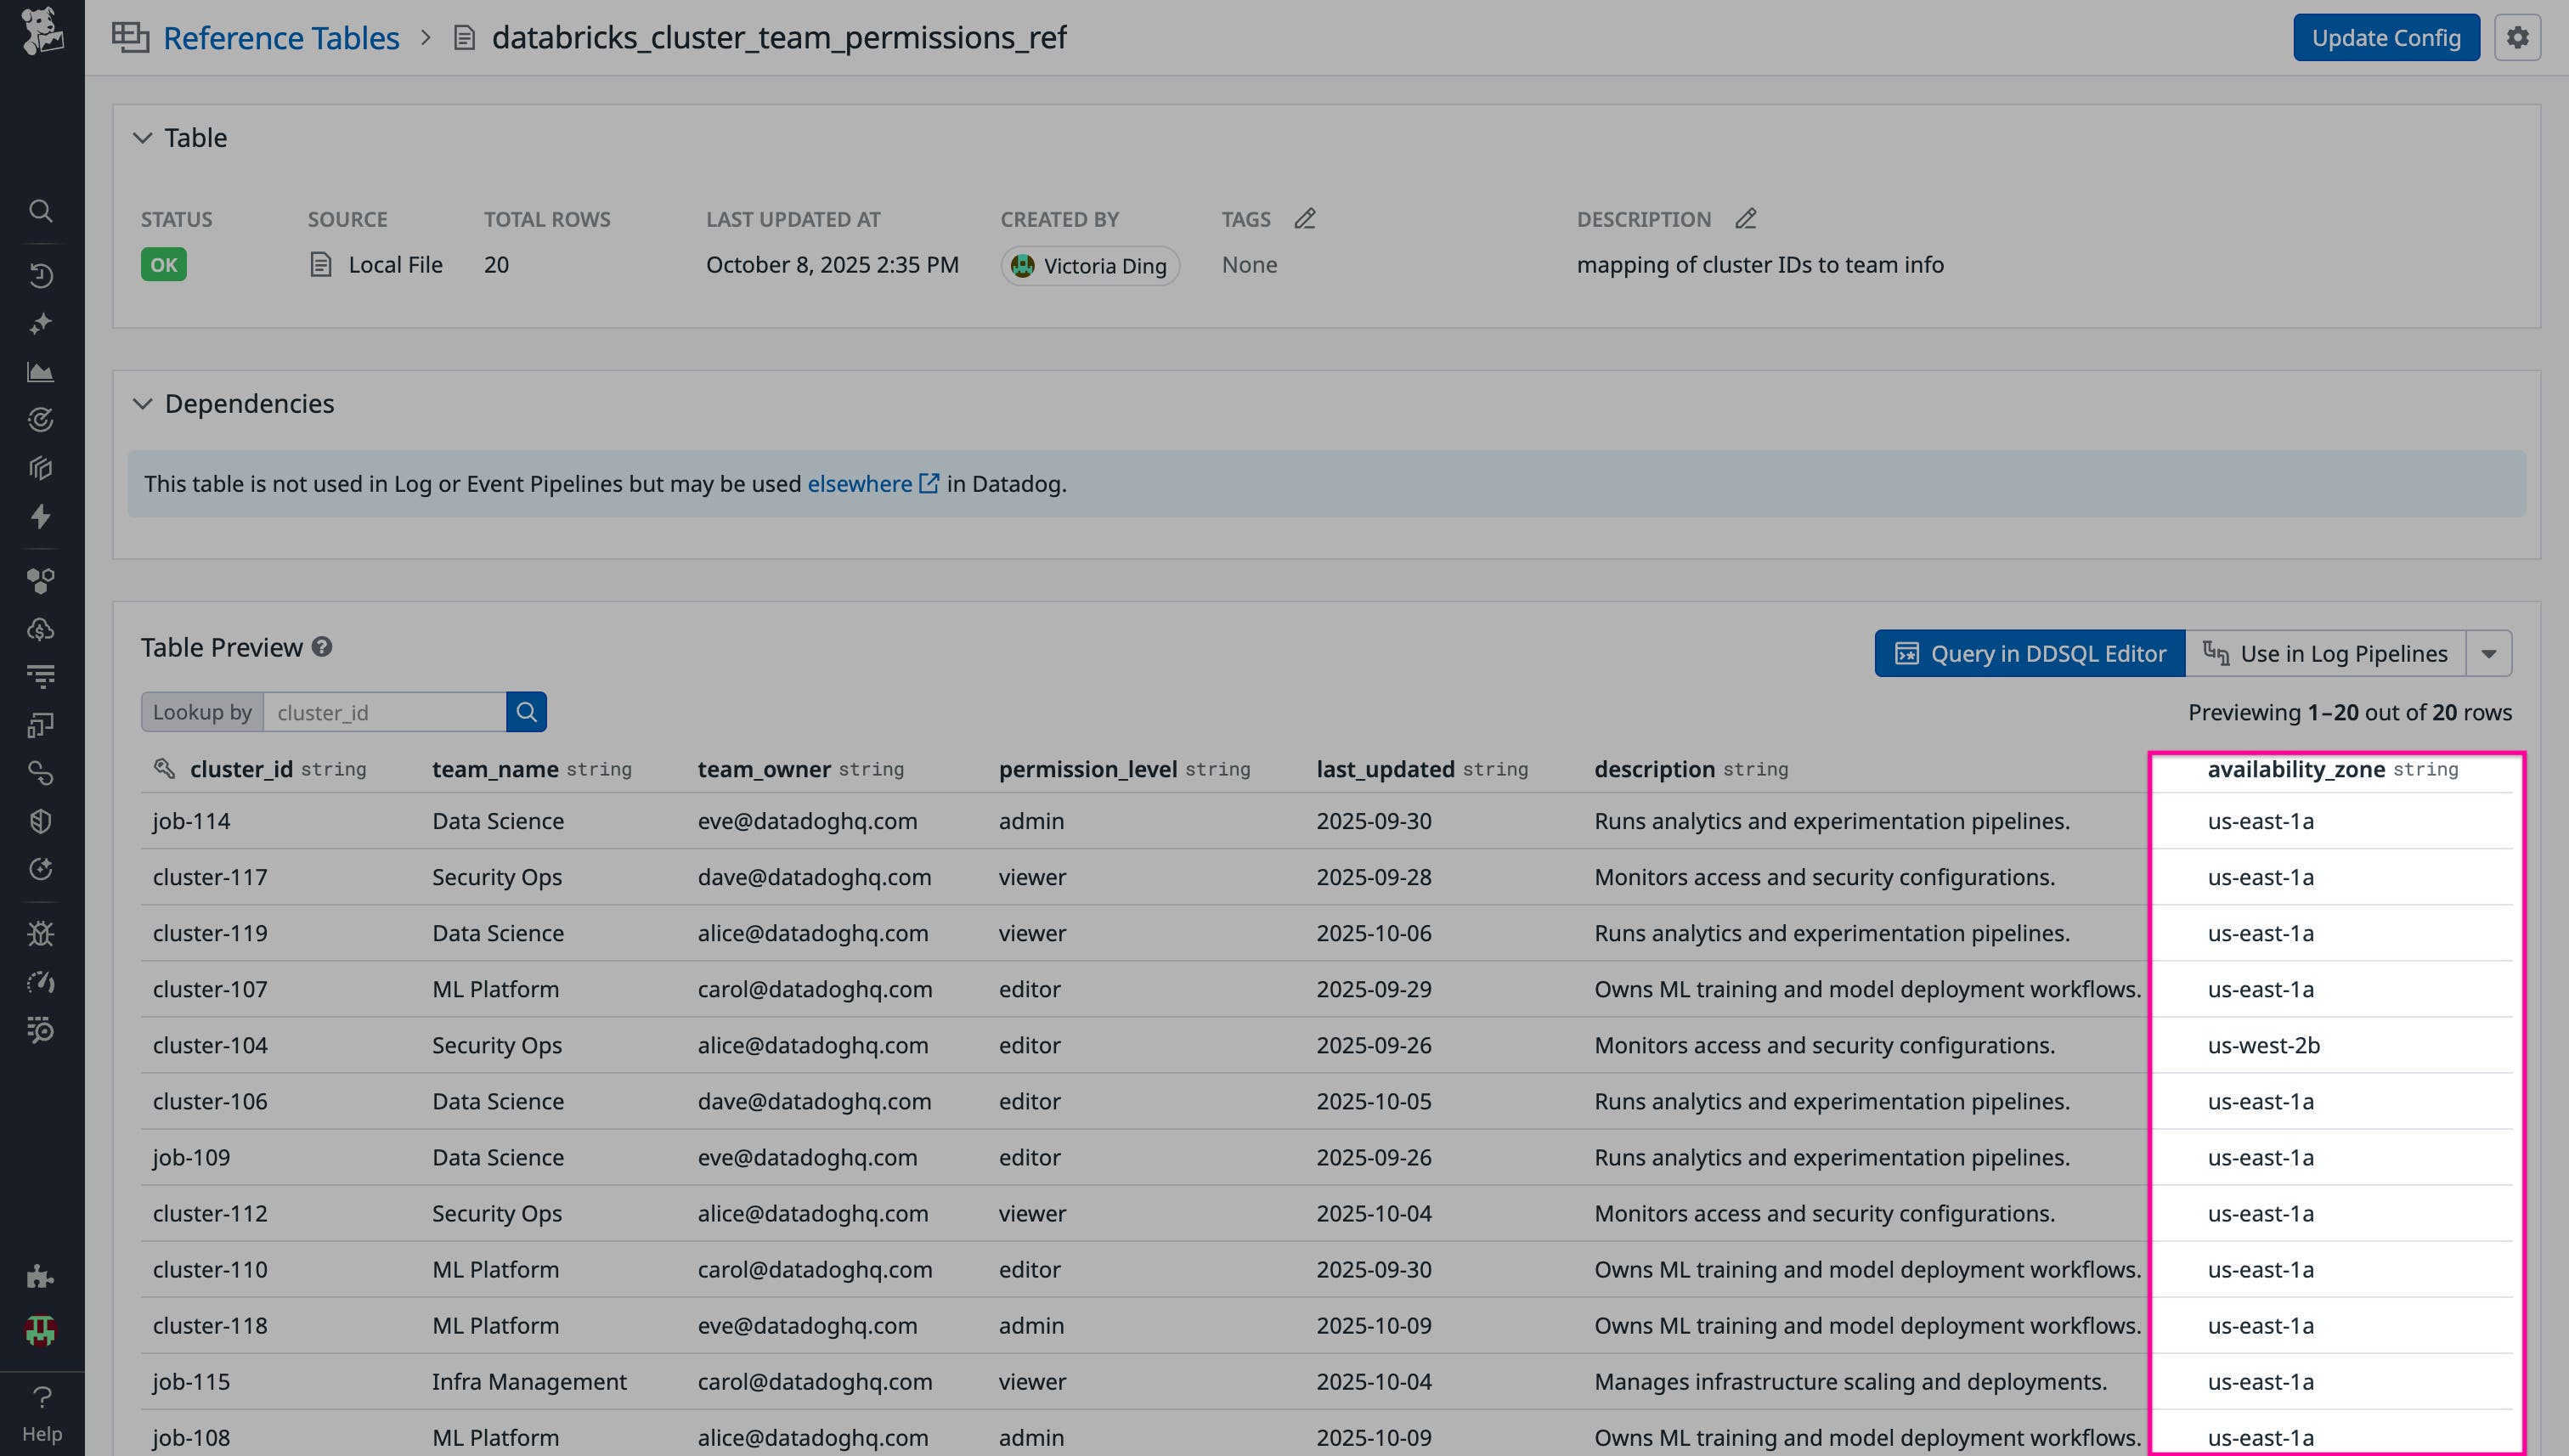
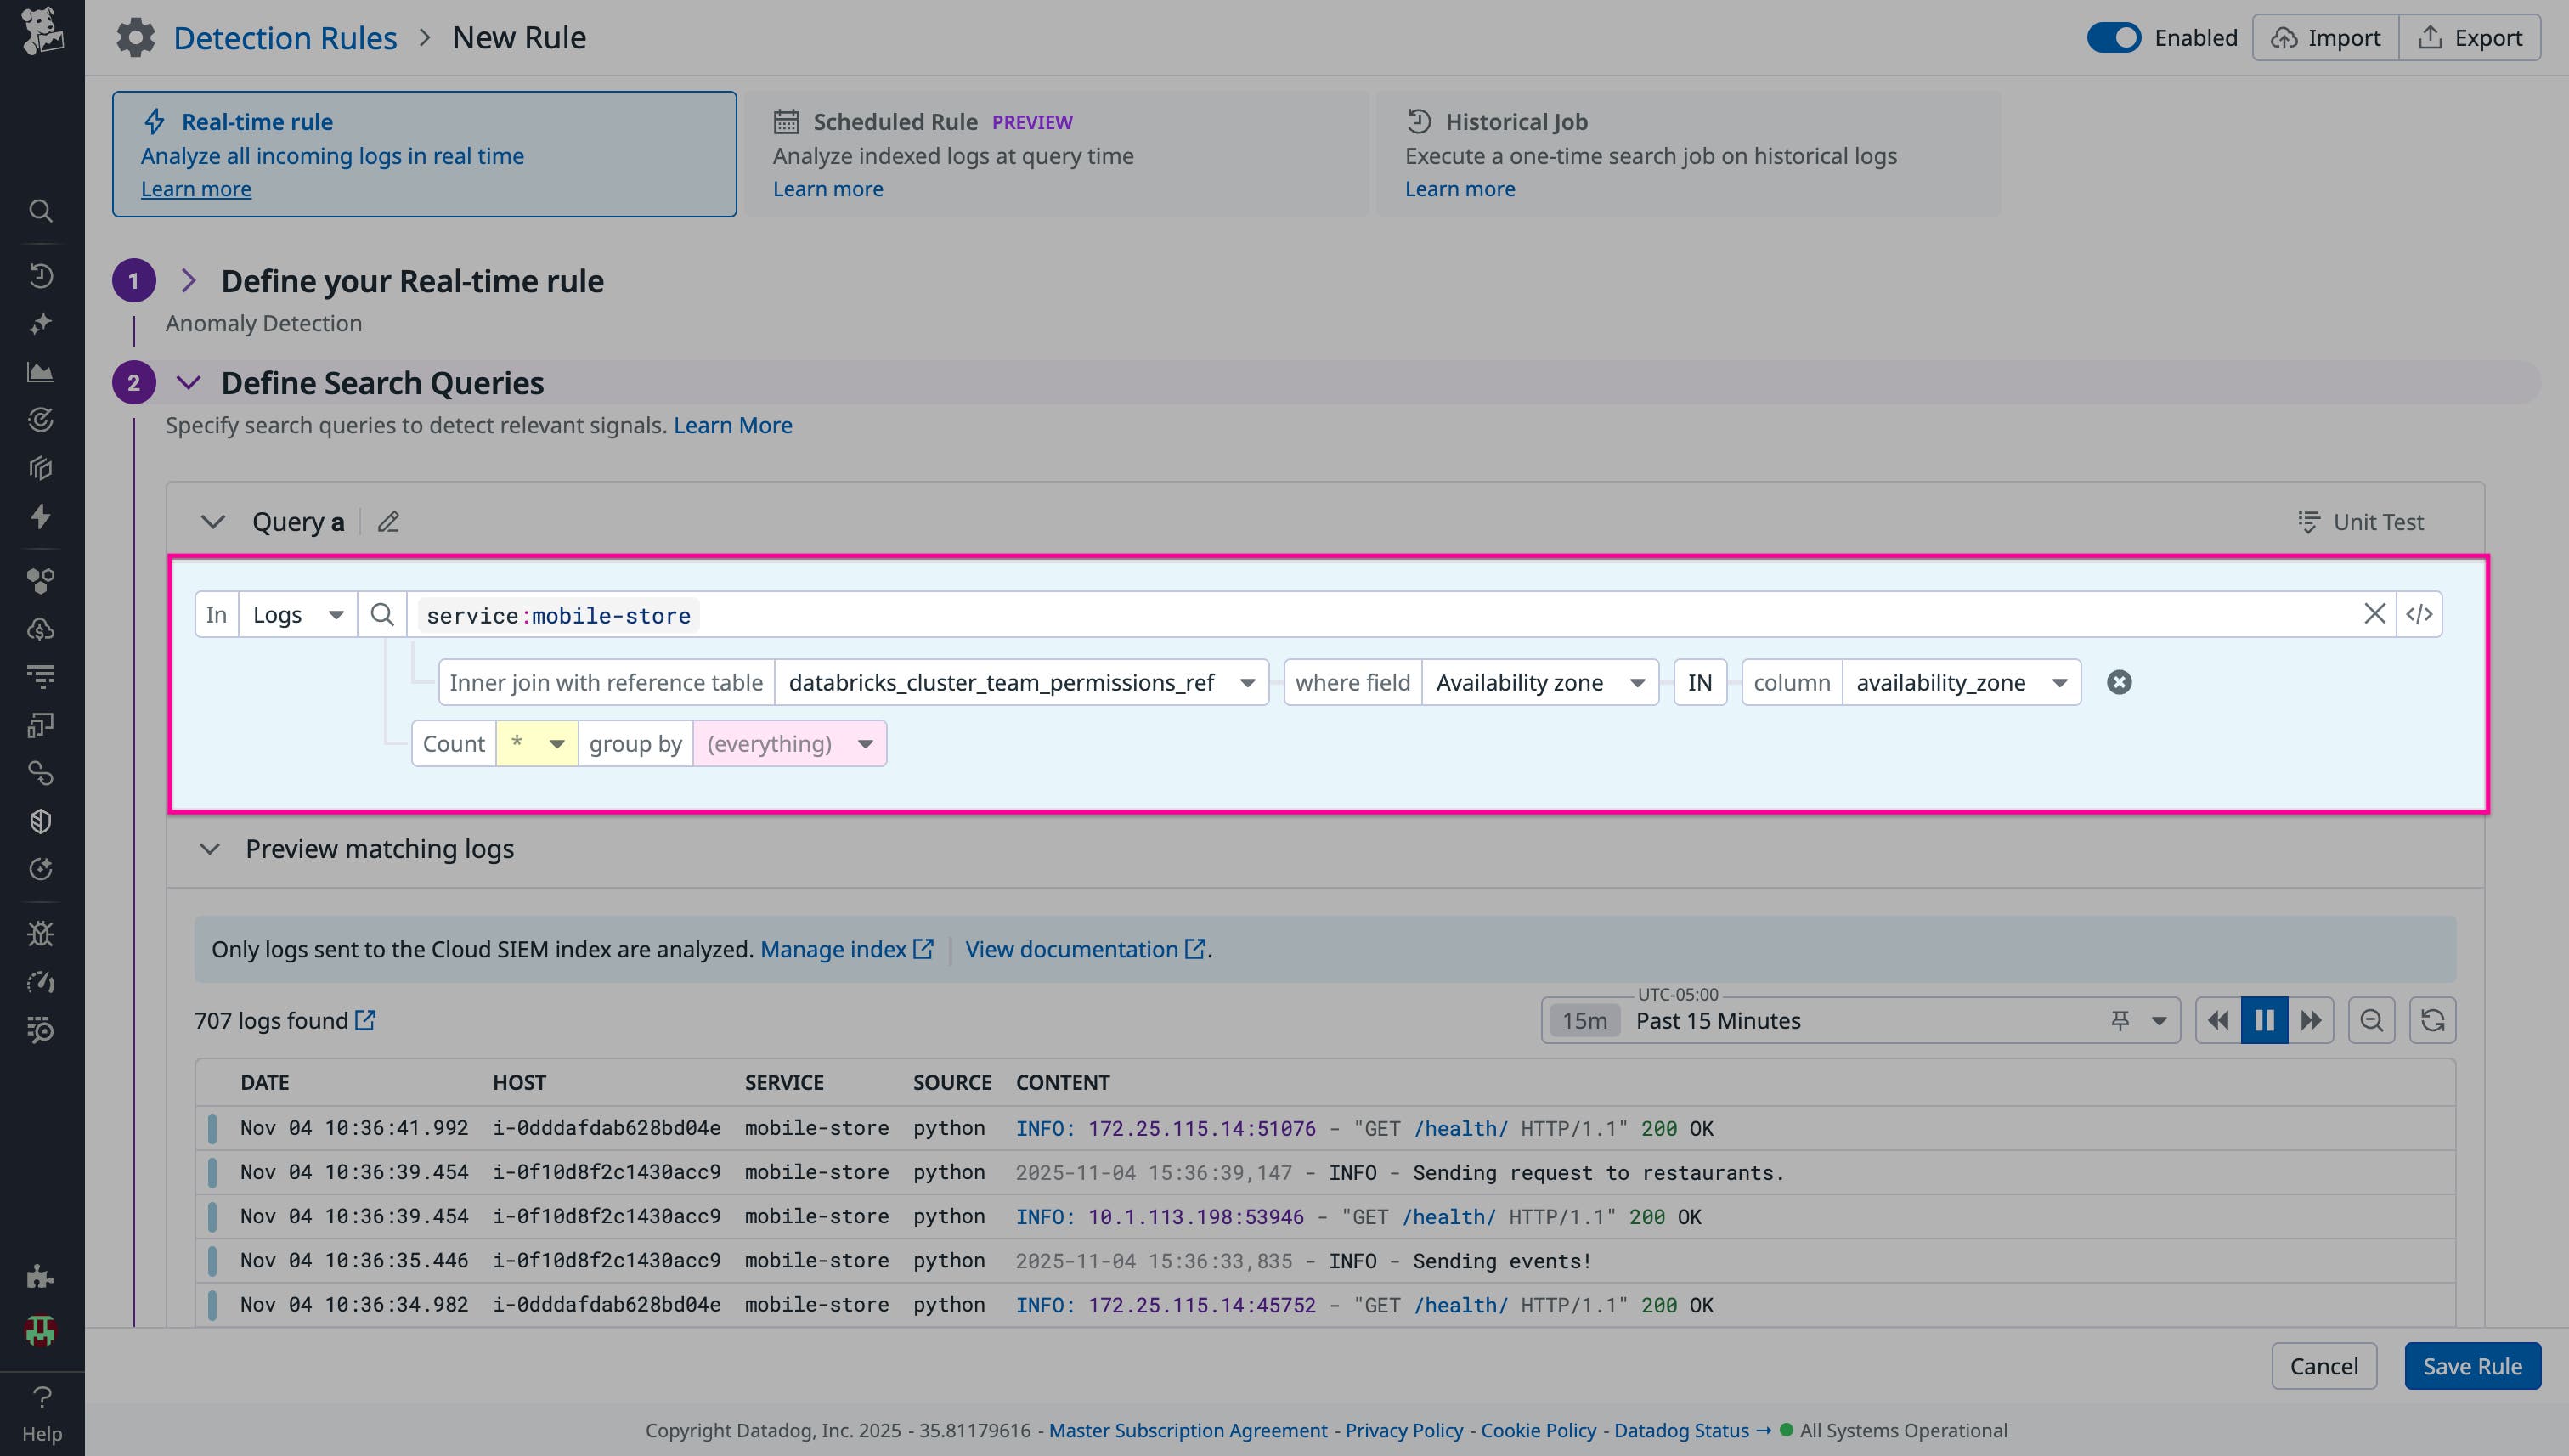
When a misconfiguration is detected, you can also use Workflow Automation to automatically open and assign a ticket to the responsible team identified in a Reference Table to ensure rapid resolution.
Get started with Reference Tables and third-party integrations today
Breaking down data silos starts with bringing all your context into one place. With Datadog Reference Tables, you can enrich your telemetry with metadata from Snowflake, Salesforce, ServiceNow, Databricks, and other sources important to your team without manual CSV uploads or fragmented datasets. These integrations make it easy to combine business, ownership, and security context directly with your logs, metrics, and events so teams can move faster and make smarter decisions.
To learn more, check out our documentation for Reference Tables and our Snowflake, Salesforce, ServiceNow, and Databricks integrations.
If you’re new to Datadog, you can start a 14-day free trial and see firsthand how Reference Tables help unify business and technical context across your observability and security data.


