Mallory Mooney

Eyal Engel

Shubham Mehrotra
Tracing is a critical part of monitoring application performance, especially as organizations shift to deploying services using distributed systems, serverless computing, and containerized environments. Teams need real-time, end-to-end visibility into all of the traces relevant to performance issues such as an application outage or an unresponsive service, but managing tracing costs often results in gaps in valuable tracing data. These gaps can increase the time it takes to pinpoint and resolve an issue and turn a small anomaly into a worst-case scenario that could significantly affect your customers and business.
Datadog Distributed Tracing solves these problems by giving you full control over your traces via fine-grained ingestion controls and tag-based retention filters. Ingestion controls allow you to adjust the trace volume and sampling rate per service based on your criteria, such as request throughput and level of importance for your application. This enables you to focus on your most business-critical services and transactions while staying within budget.
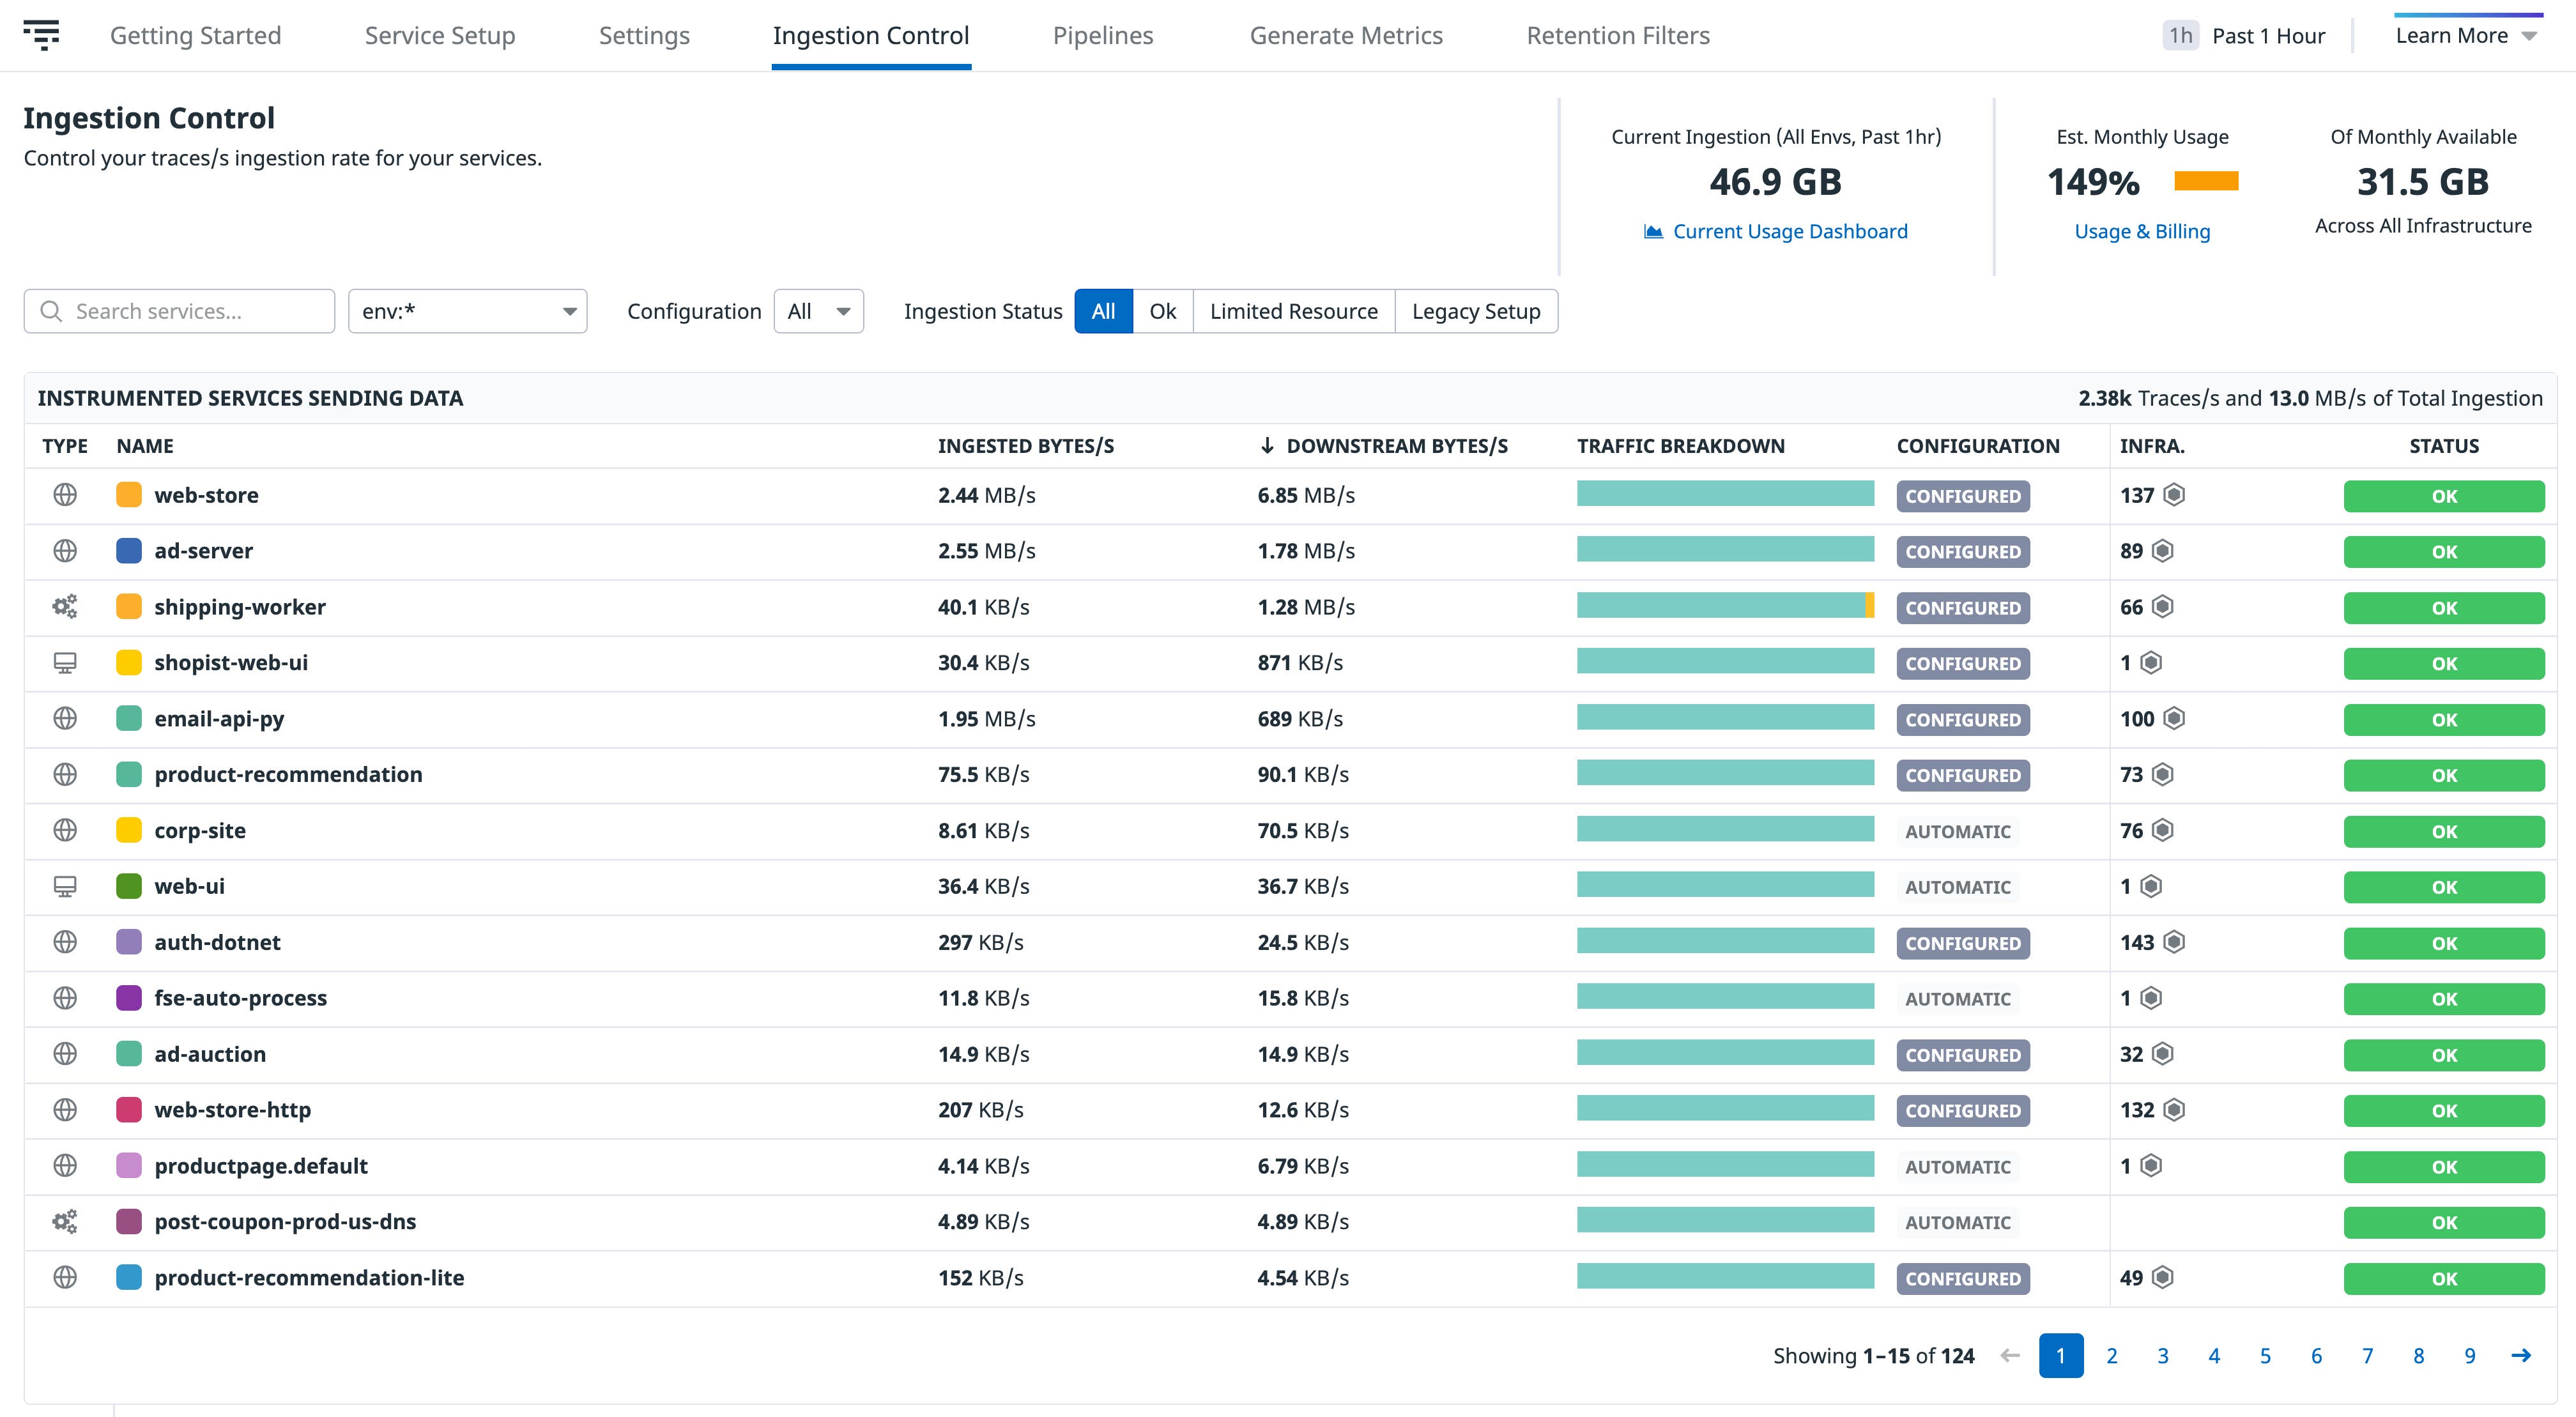
Once you’ve configured your services, you can live search and investigate every ingested span by any tag over a rolling 15-minute window. You can also visualize services and their dependencies in real time with the request flow map, which Datadog generates based on ingested traces. This visibility is critical during incidents or new deployments, where traces can play a key role in troubleshooting performance bottlenecks or monitoring new dependencies.
For long-term analysis, you can create tag-based retention filters in order to keep telemetry data for specific services for up to 15 days. Datadog captures the entire trace along with the span that matches a particular filter, ensuring that you have complete context for troubleshooting error and high-latency requests.
In this post, we’ll walk through how Datadog Distributed Tracing can help you troubleshoot problems in your application by:
- using Live Search to pinpoint the source of customer issues
- leveraging Live Analytics to visualize service performance in real time to determine how widespread the issue is
- creating retention filters to capture critical performance telemetry and business context for all of your traces
Pinpoint the source of customer-reported issues with Live Search
When you receive an influx of customer-reported issues, such as not being able to check out or purchase an item from your application or site, you need the ability to quickly find and resolve the problem before the issue becomes widespread. With Datadog APM Live Search, you can search and filter across all traces using any tag in real time within the last 15 minutes (rolling window). Datadog automatically streams your ingested traces for your configured services, ensuring that you never miss a critical trace when troubleshooting production outages, deployment issues, or other types of incidents.
The example query below reveals a sudden increase in 5xx errors from a web-store service, which correlates with the incoming reports of issues with customers’ checkout experience.
As seen in the example, you can then select a specific trace, explore its flamegraph, and view more details about the services that were affected and what caused the error. The example trace below shows that a payment service was unavailable, resulting in the internal server errors that were reported by customers.
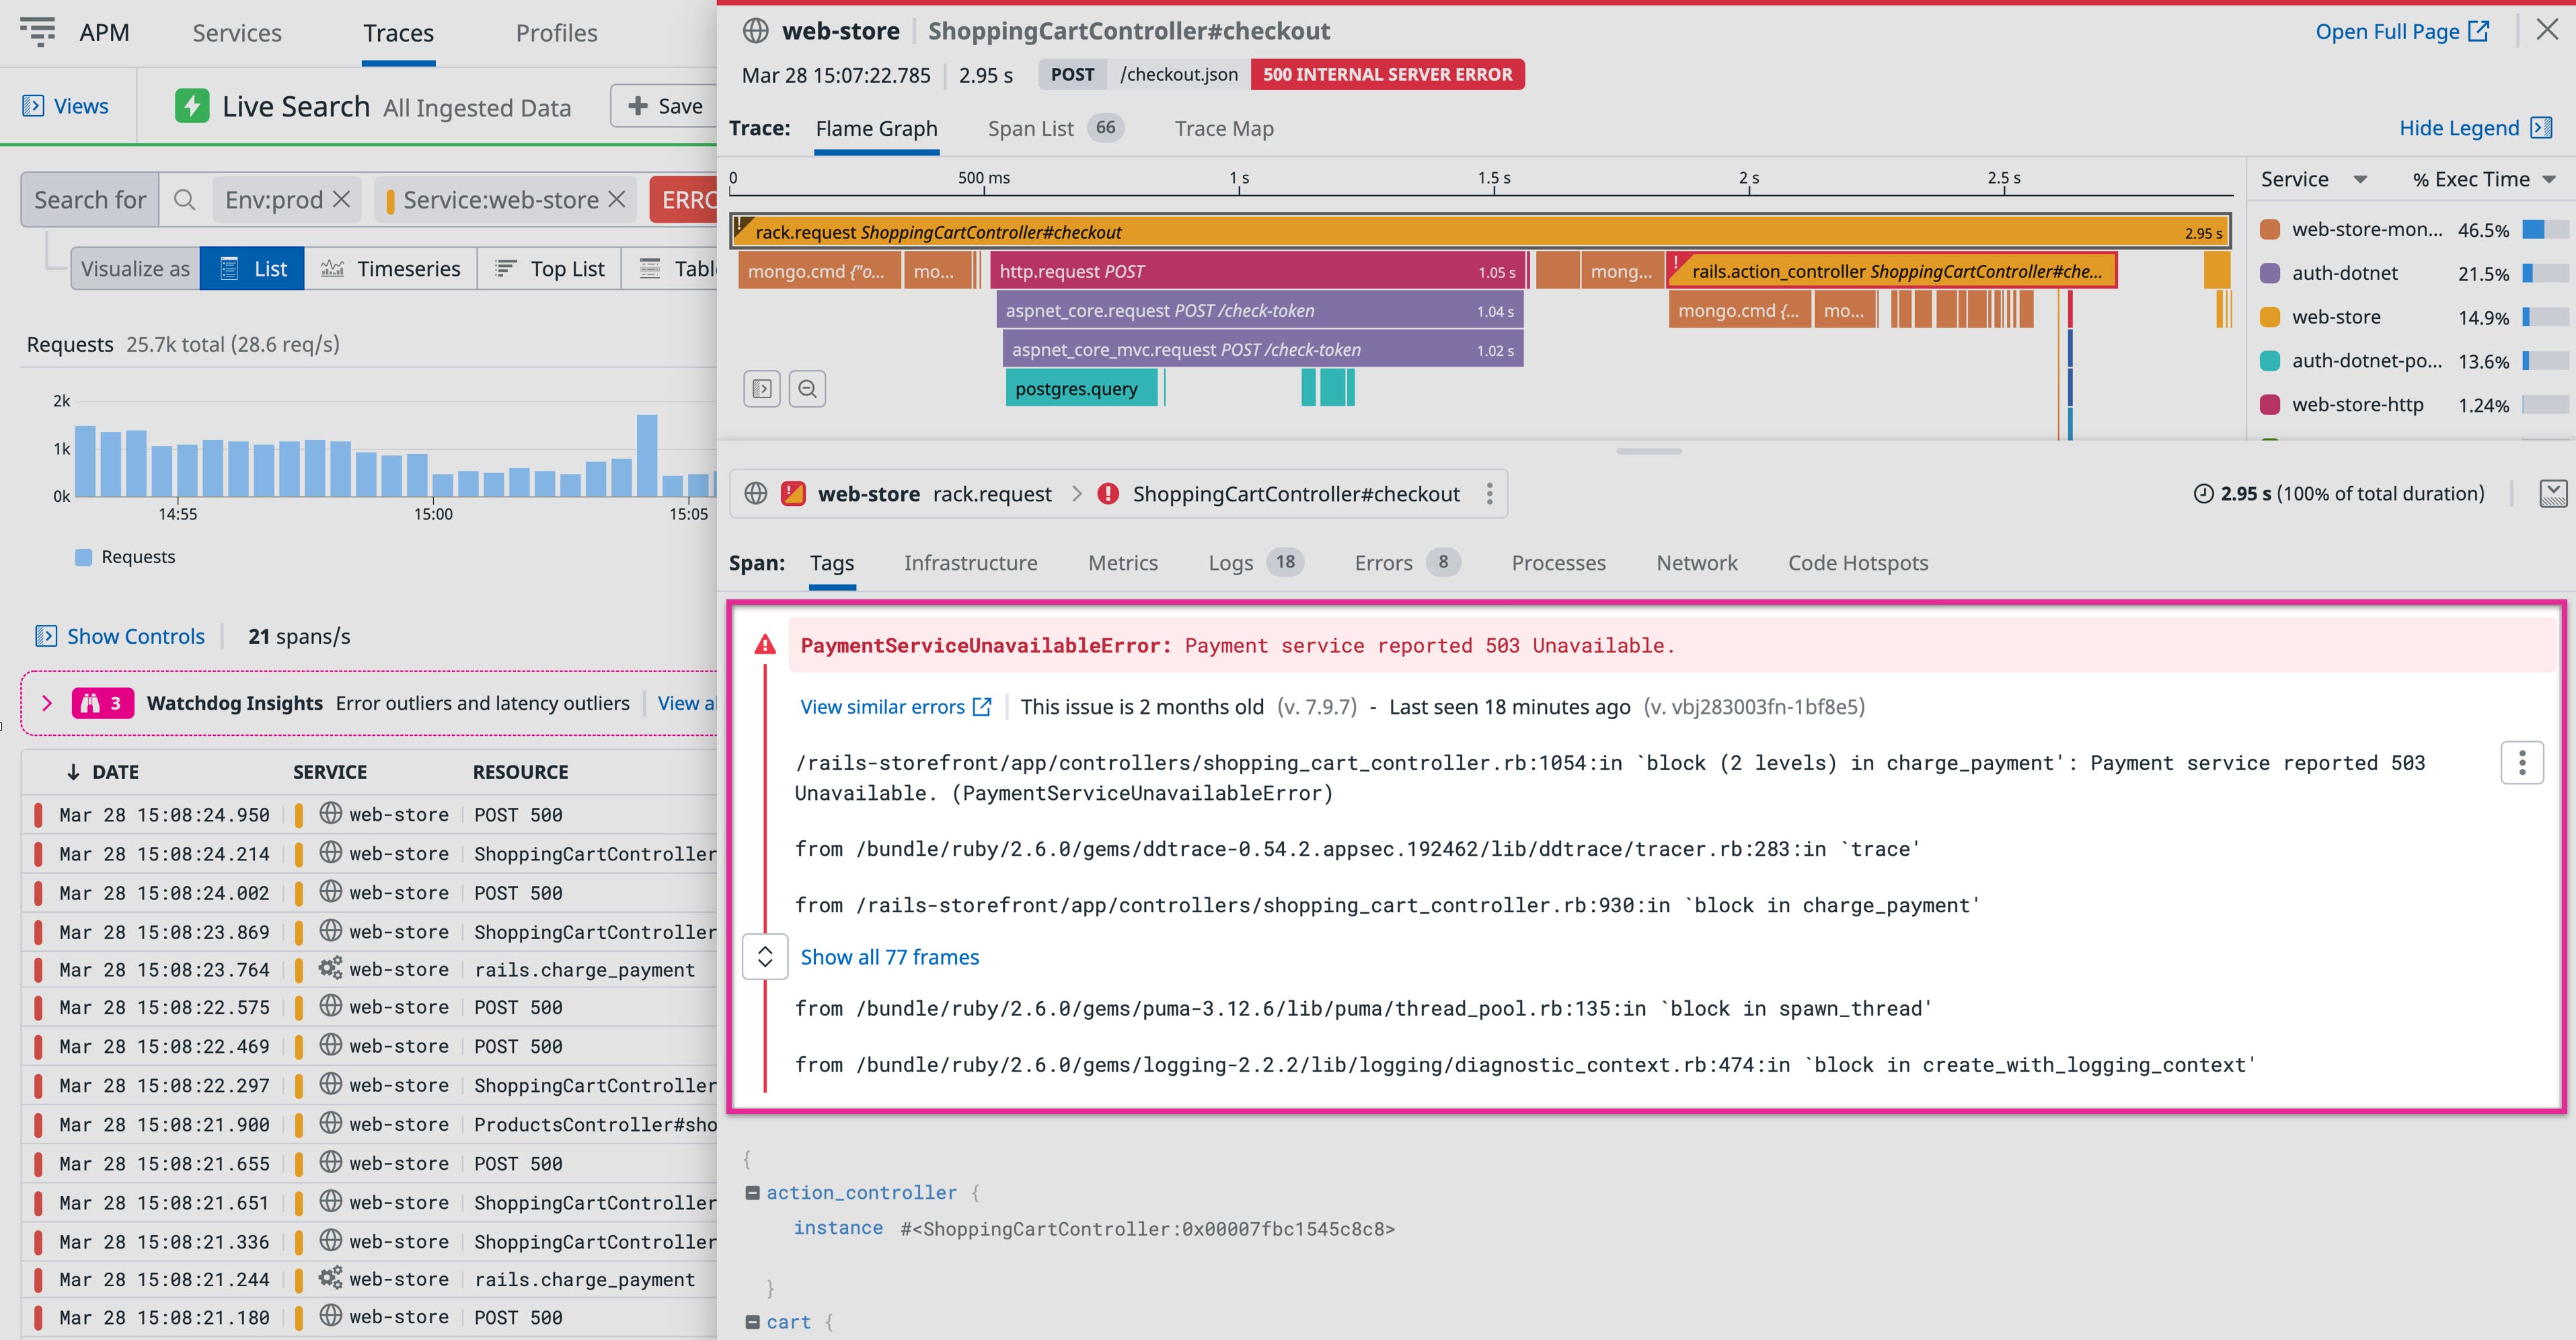
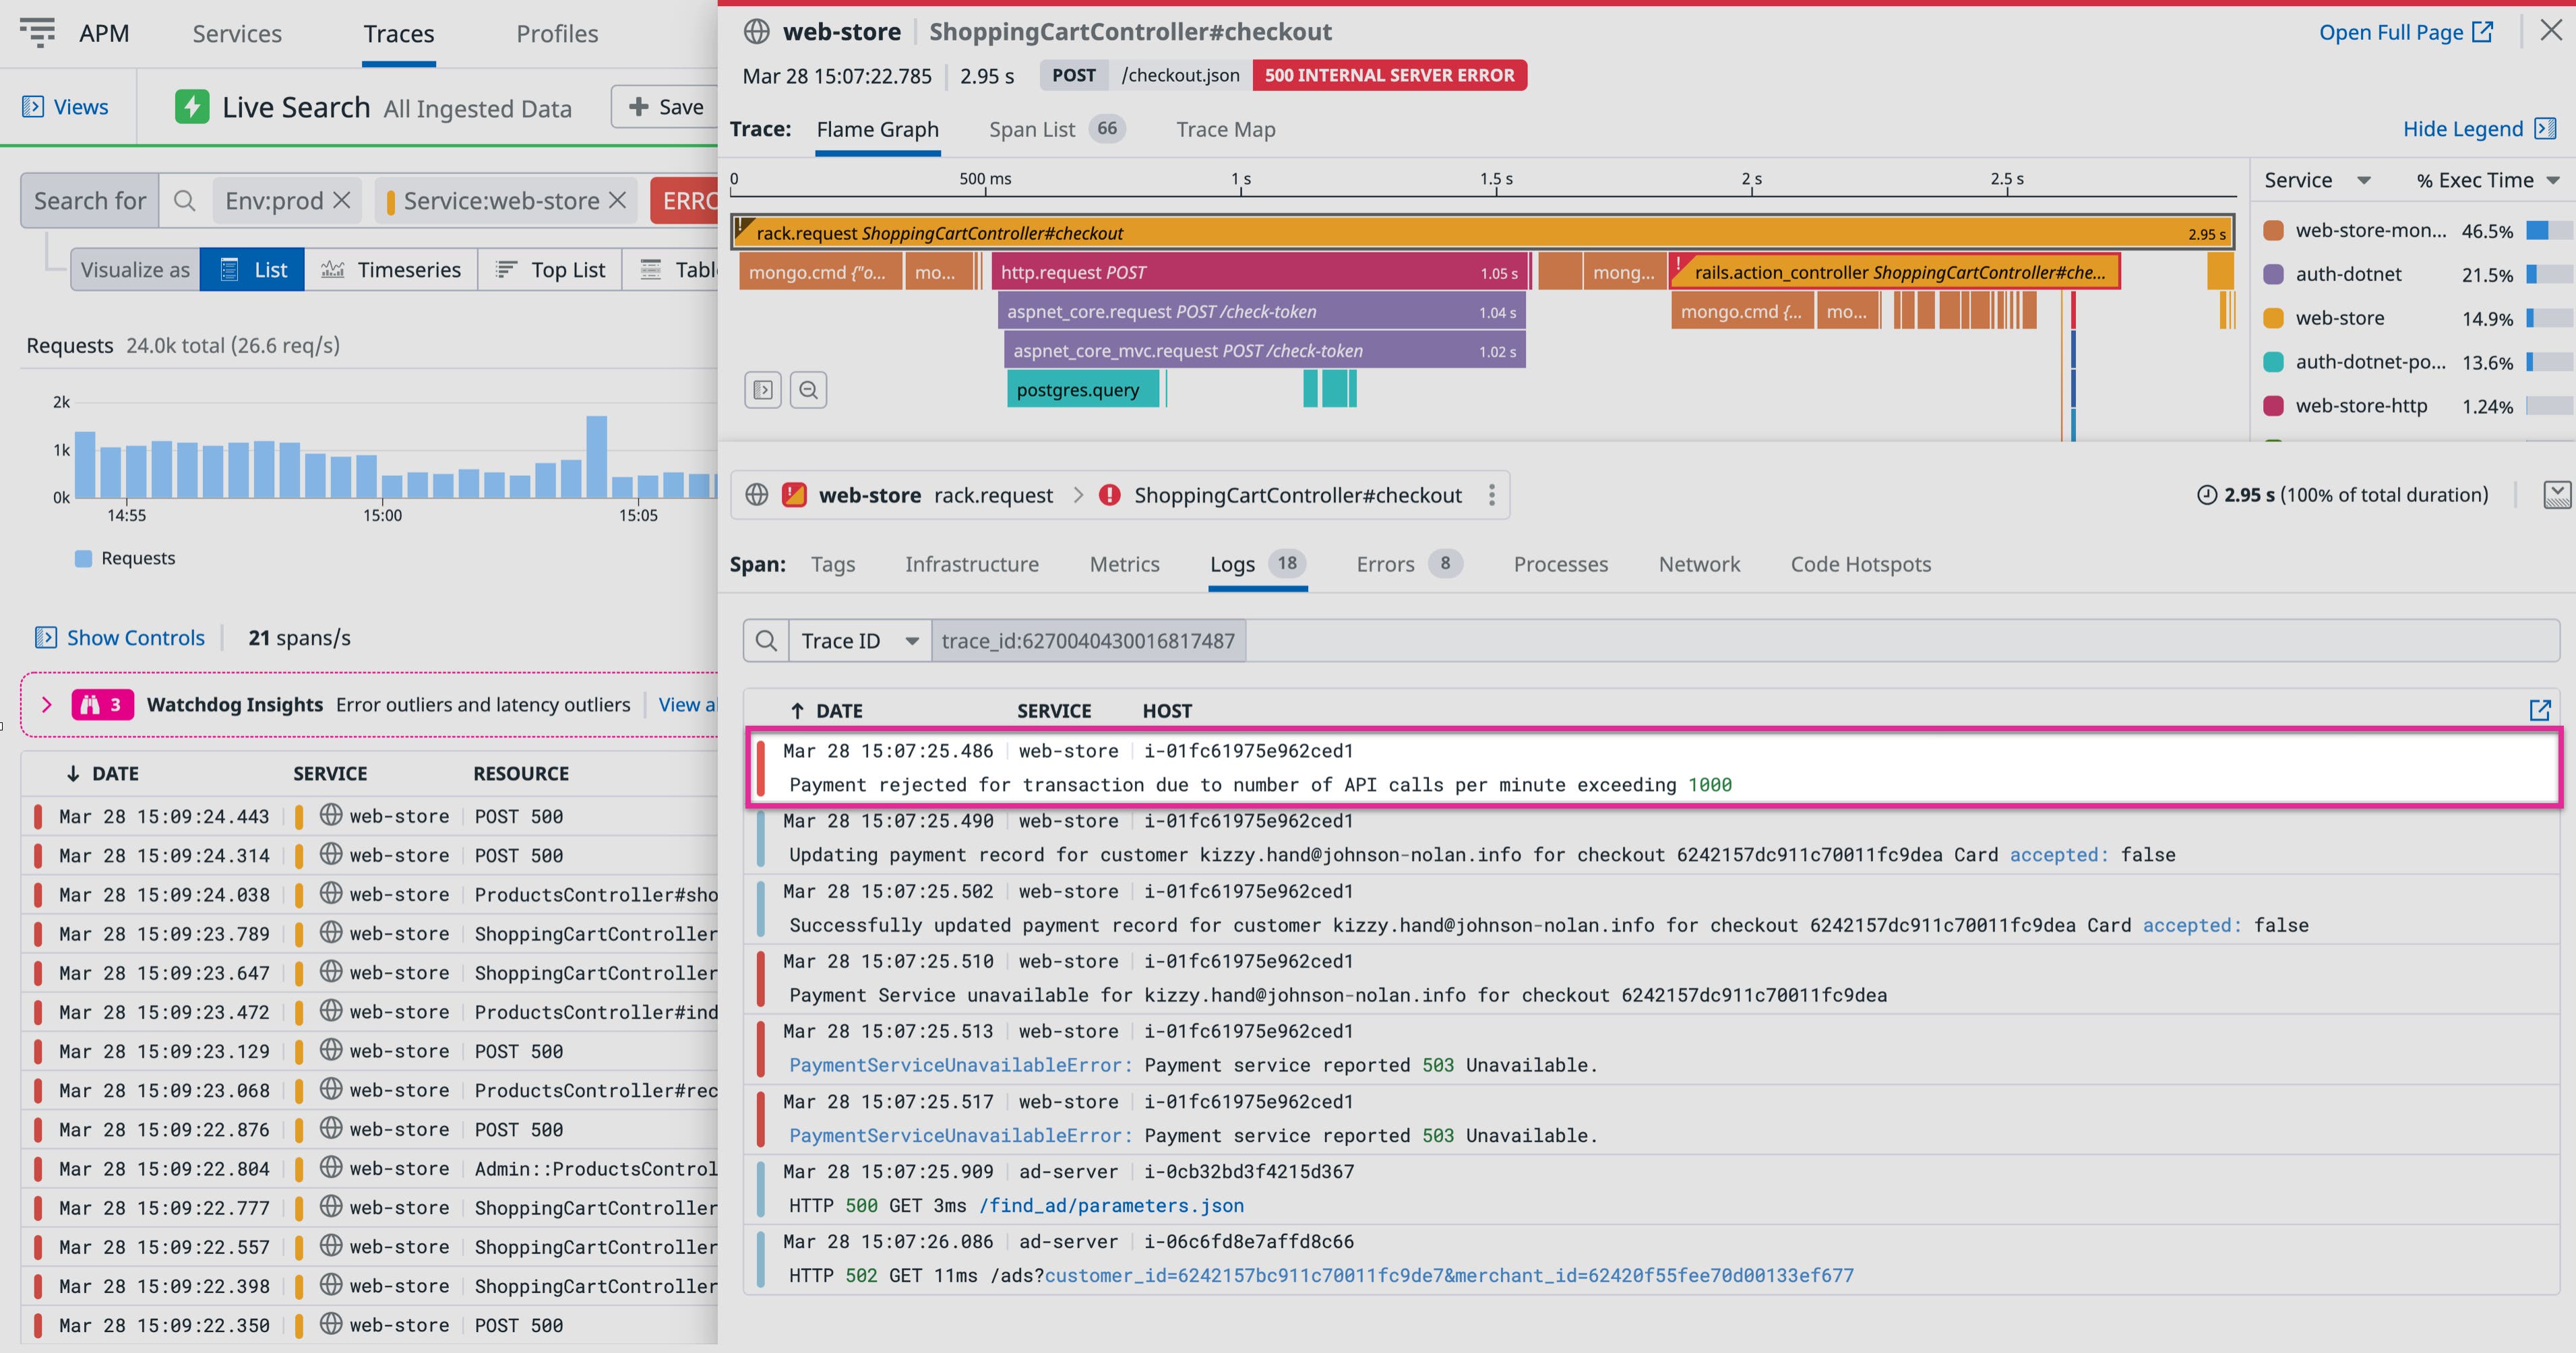
Using the flamegraph, you can investigate any span to determine if the errors were related to application code, another dependent service, or an API call, and then seamlessly pivot to related logs for further investigation—providing a single, unified platform for resolving application issues. As you can see in the associated log stream below, the payment service was unavailable because the payment API exceeded its rate limit.
Determine how widespread an issue is with Live Analytics
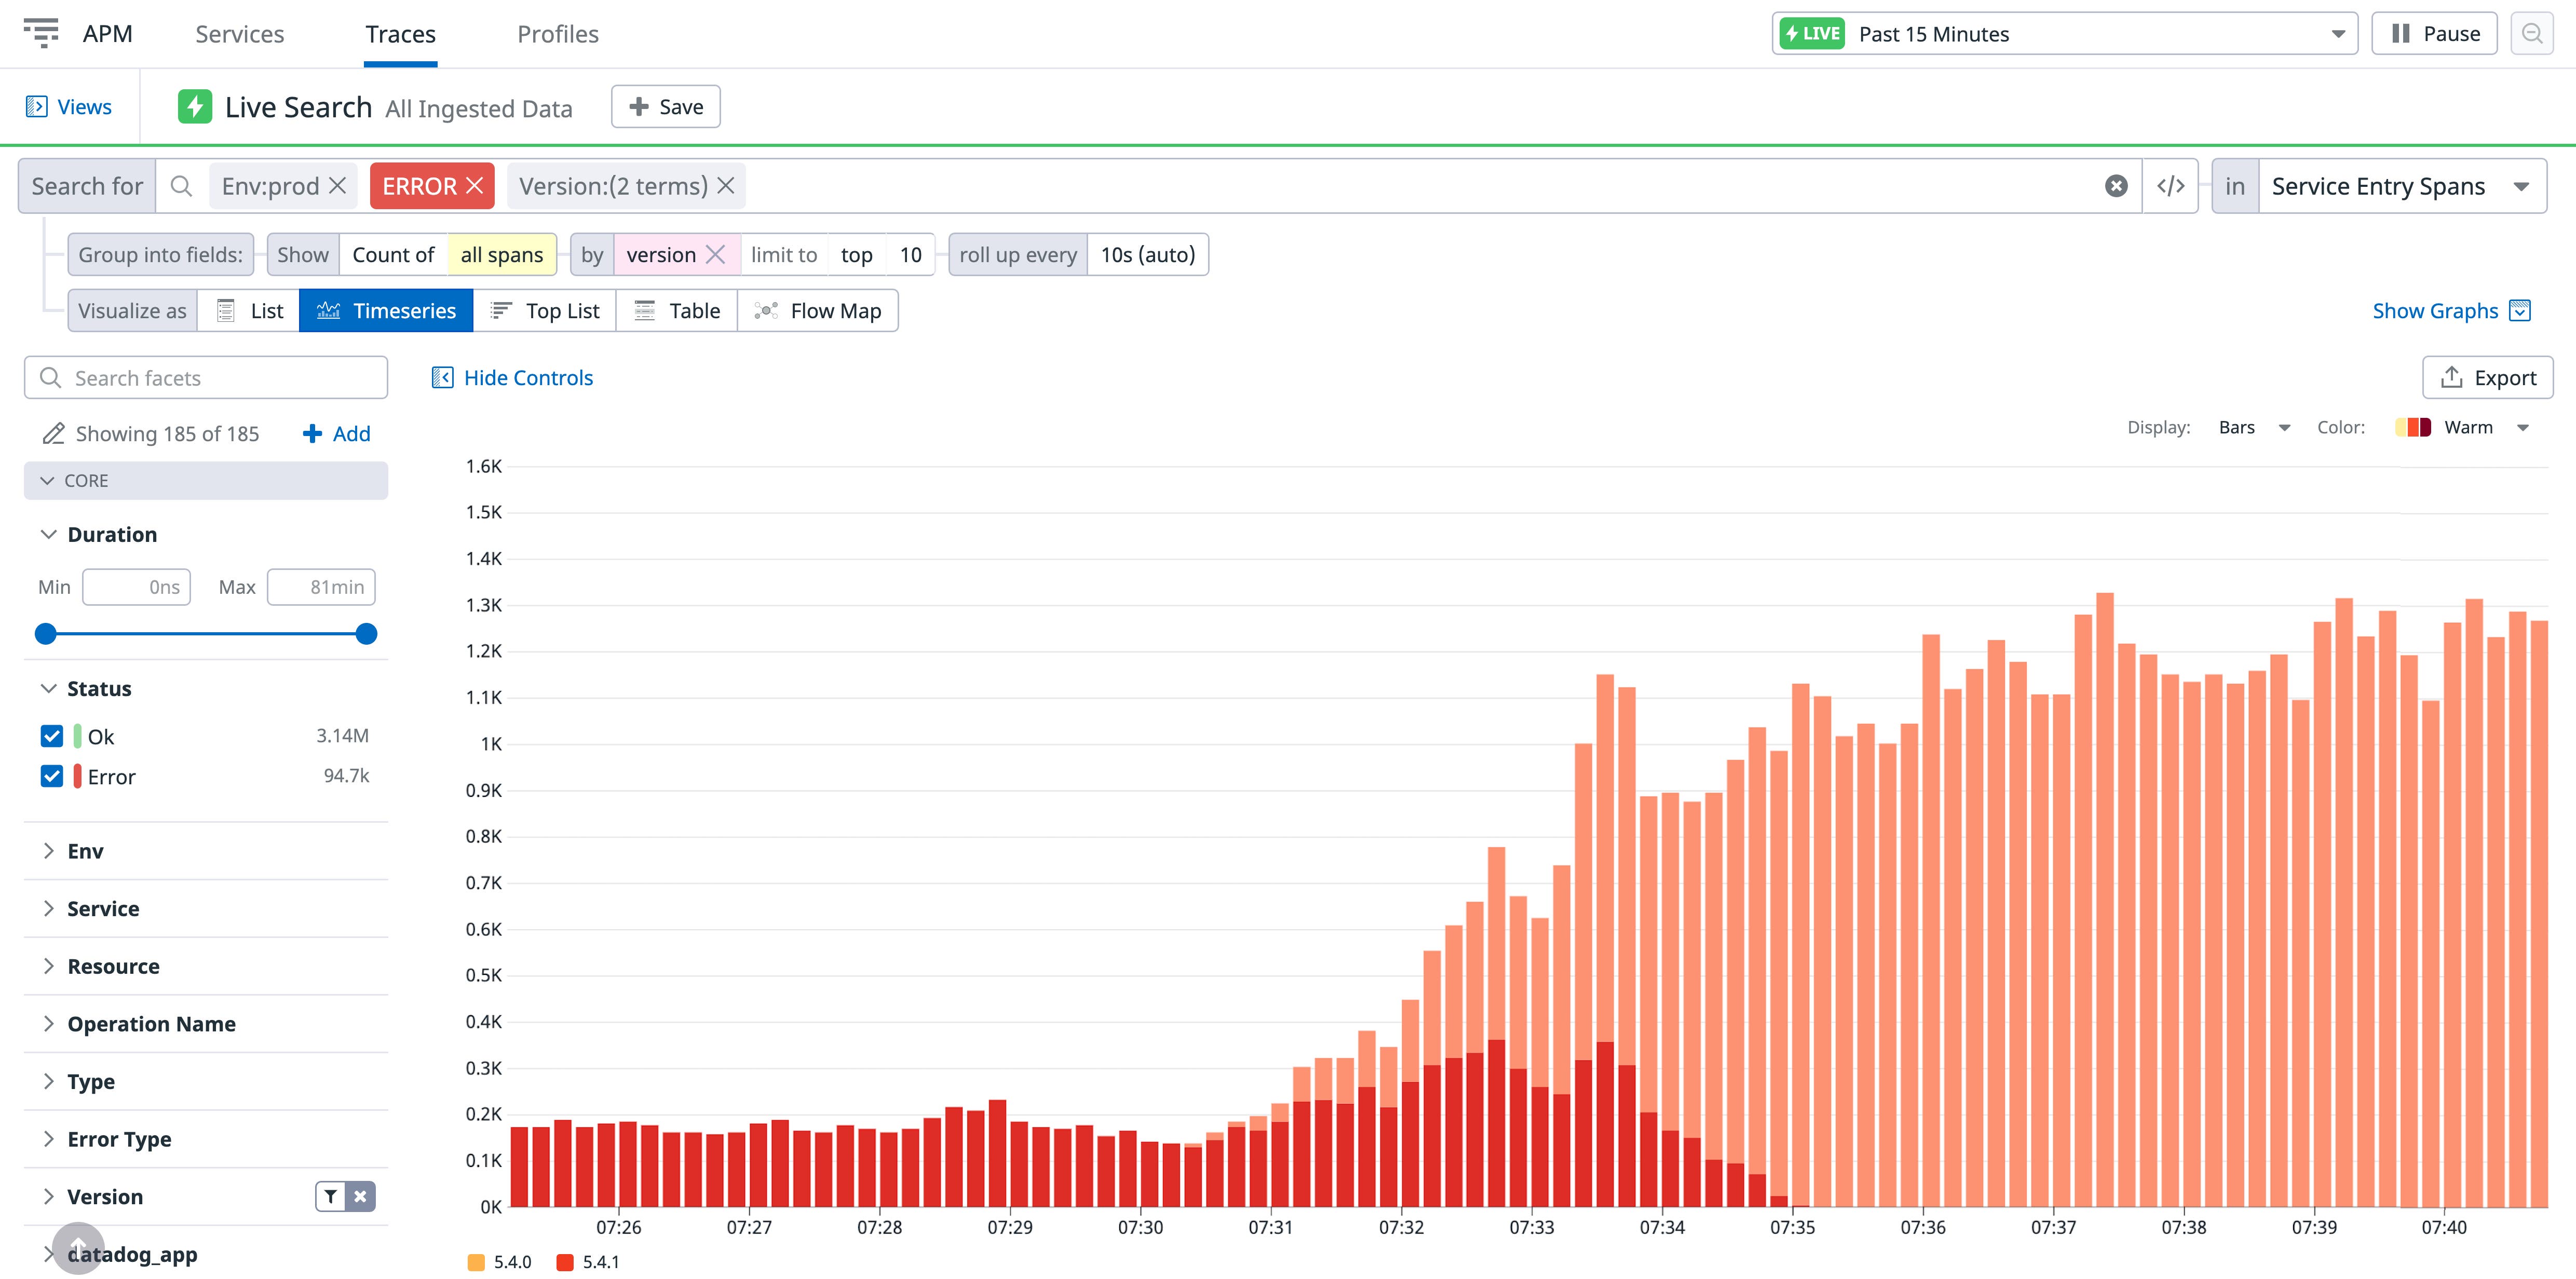
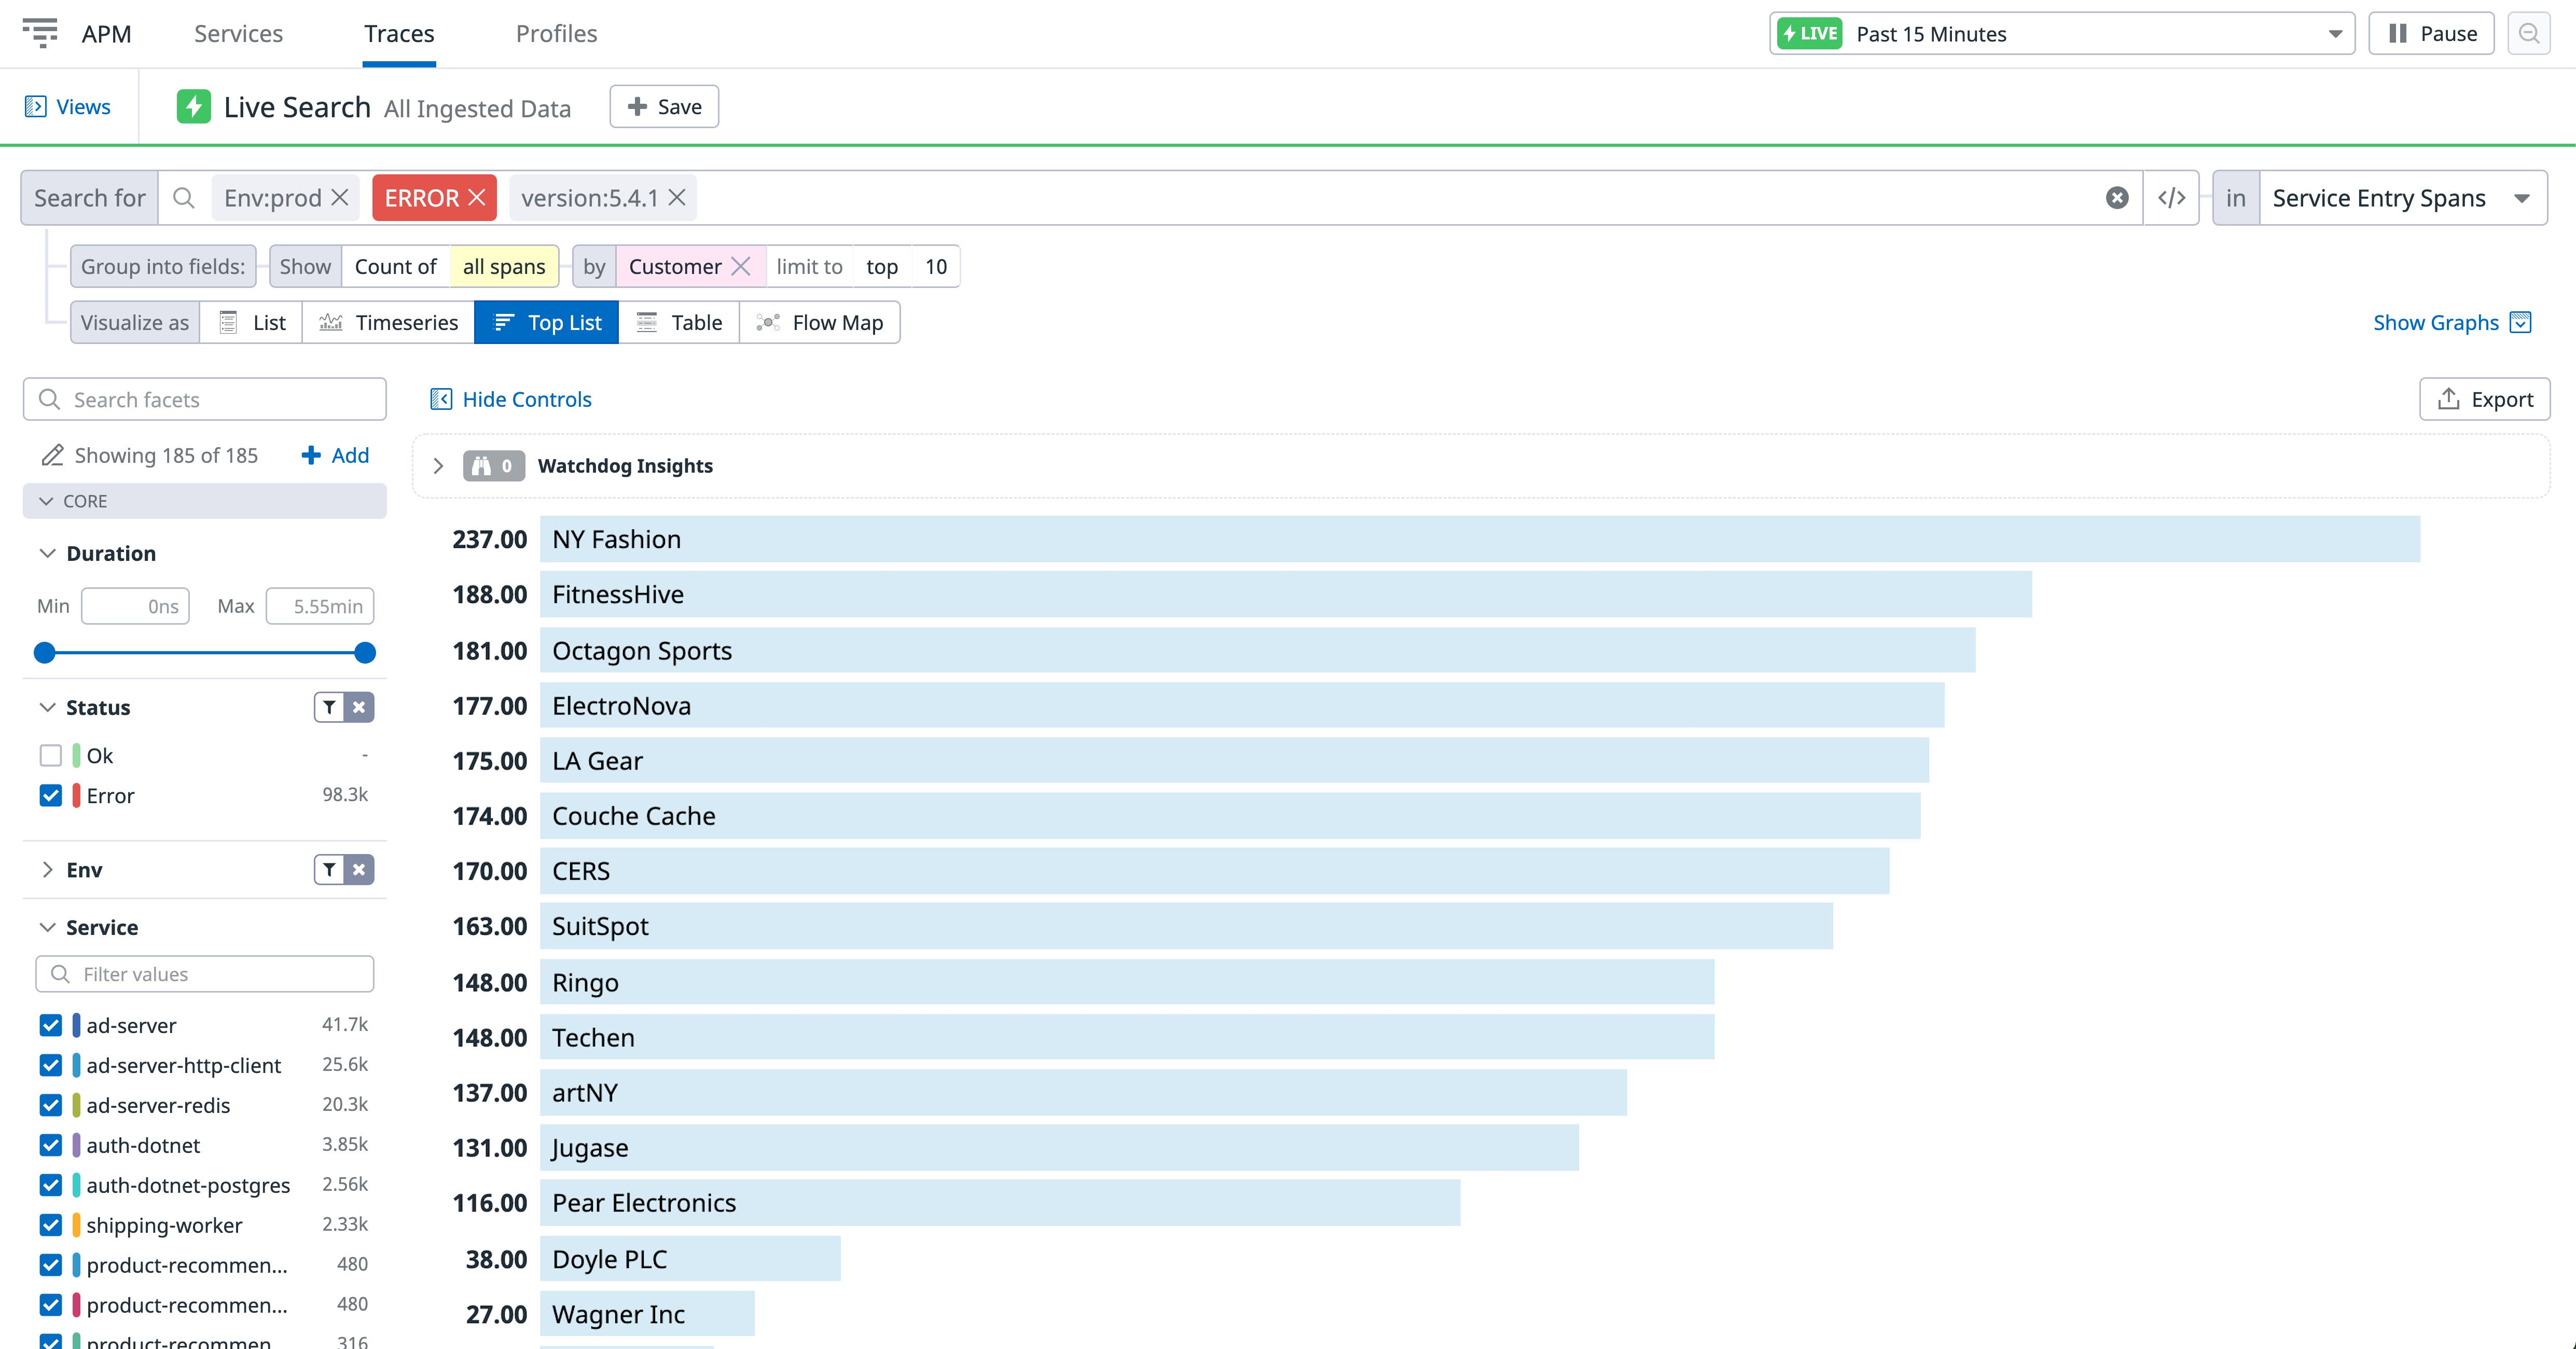
Once you identify the source of a reported issue, it’s important to assess how widespread it is. For example, you need to be able to quickly determine if a recent deployment introduced the problem to a larger subset of your customers. With Live Analytics and Datadog’s unified ‘version’ tag, you can analyze all traces for the last 15 minutes to correlate the error in question with a recent version release. The graph below shows a recent increase in error counts for both the “5.4.0” and “5.4.1” versions, with a significant spike in the latter as it gets rolled out to production.
Drilling further into version “5.4.1”, you can see the customers that were affected the most by the errors so you can follow up with them after you resolve the issue—you will see every customer in your search, regardless of trace volume.
If you have Continuous Profiler enabled, you can easily correlate the increases in error counts with code-level performance to confirm if they were caused by events such as a resource-intensive query or too many stop-the-world pauses.
Retain only the traces that are important to your business
Applications can generate large volumes of traces, making it more difficult to not only manage the costs of keeping traces long term but also find the exact traces you need to pinpoint the root cause of a problem. To efficiently resolve application issues for your customers, you need greater control over the traces you keep while ensuring you never miss the traces critical to diagnosing application errors or service latency.
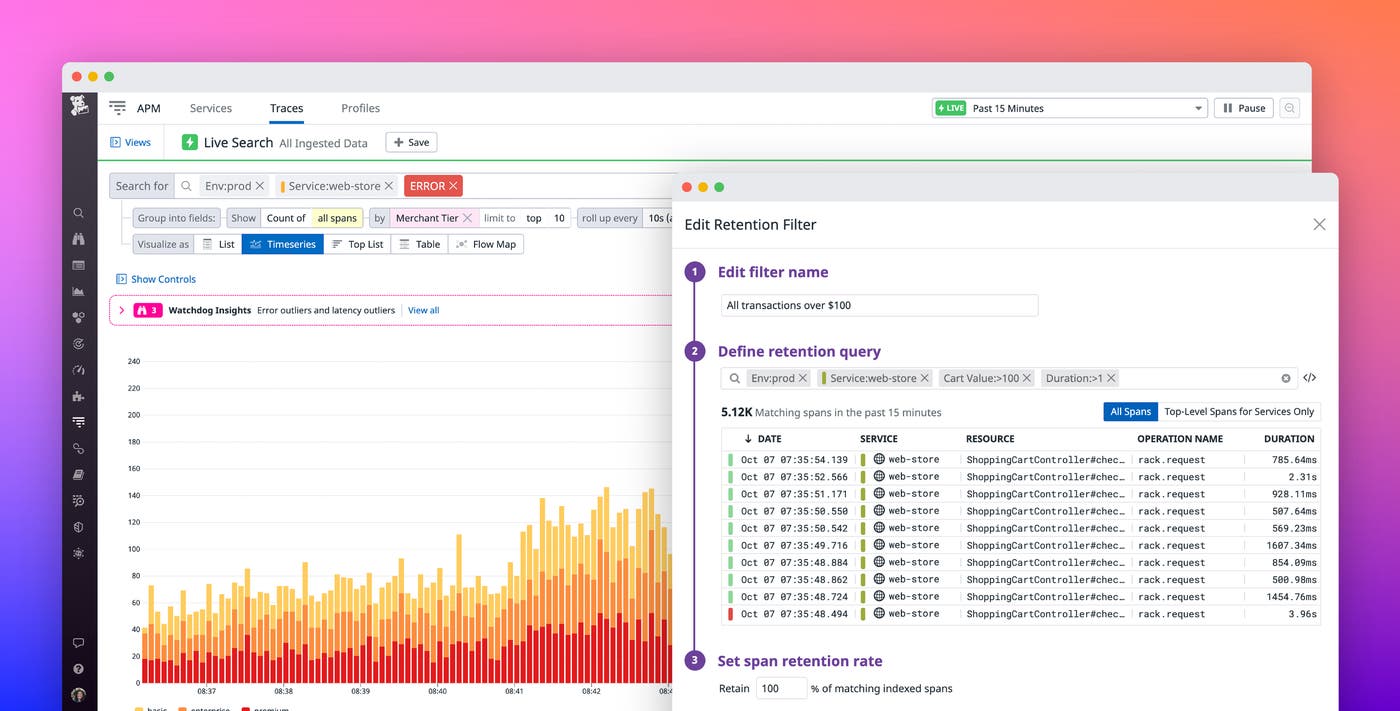
To solve this problem, Datadog enables you to create tag-based retention filters to keep only the high-value traces you need by leveraging tail-based decisioning.
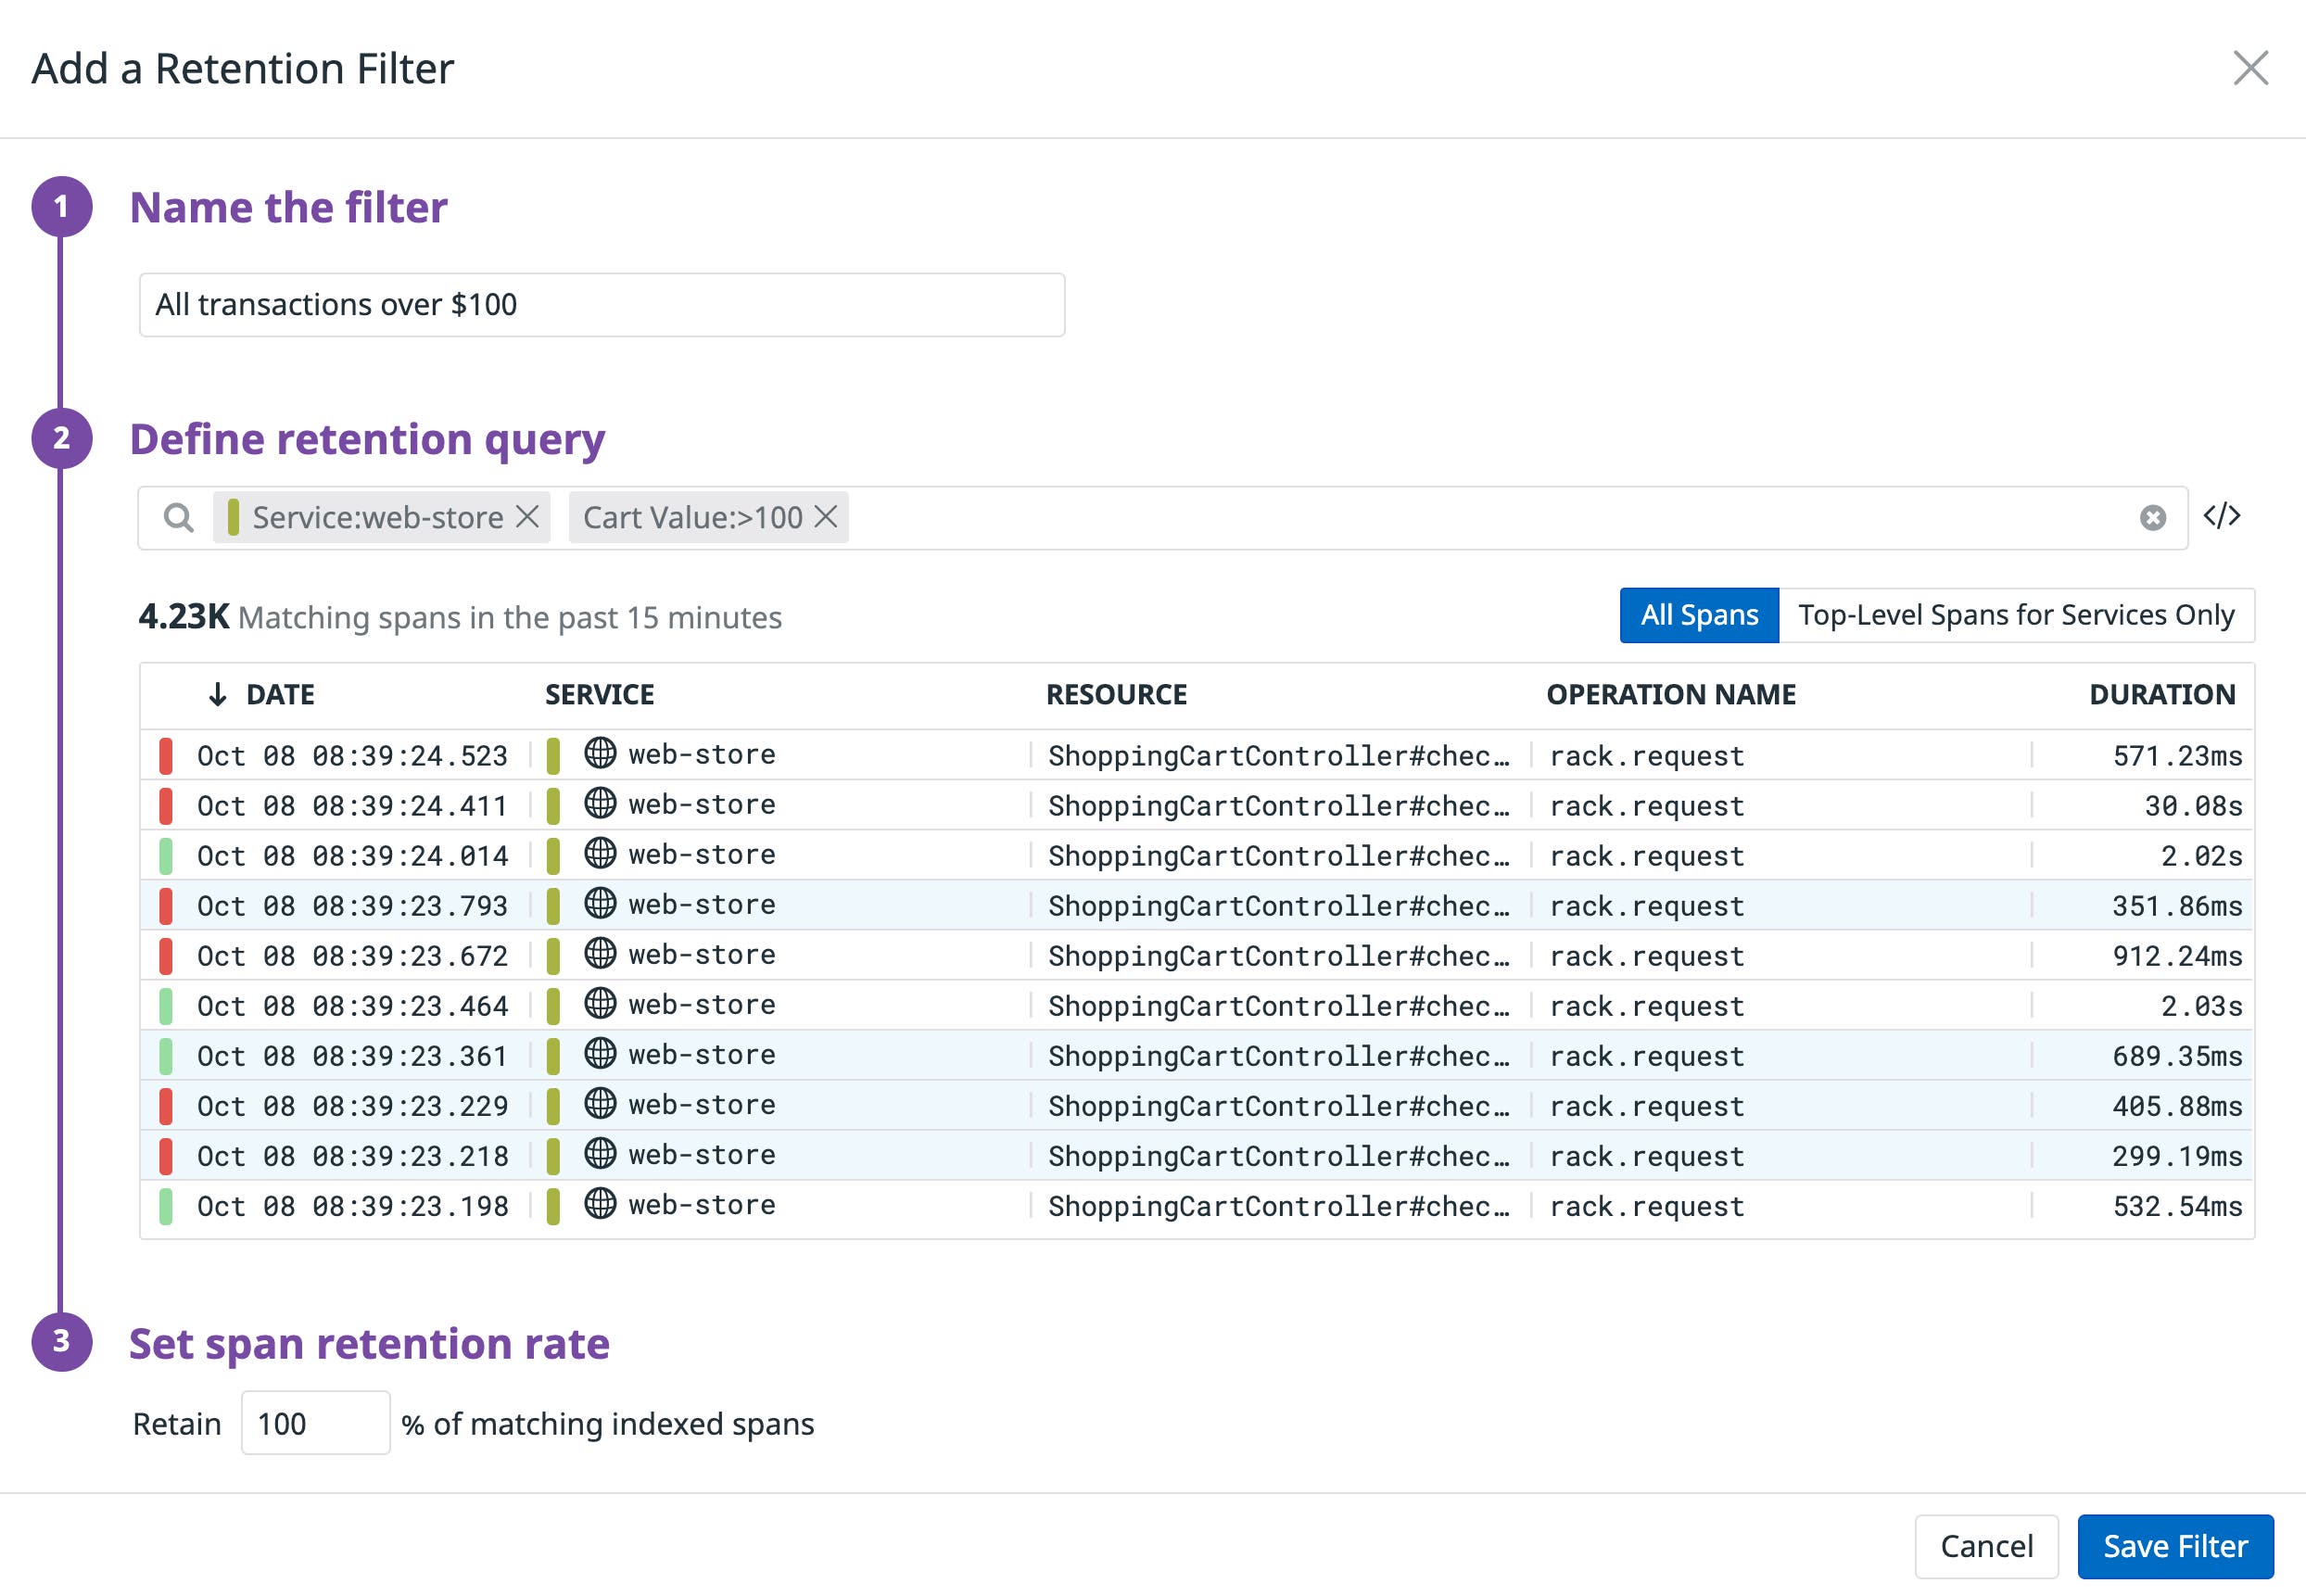
Retention filters can easily tie in important business context to traces, ensuring that you have all of the telemetry data needed to debug an issue. Your filters also enable you to decide which traces you don’t need, so you never have to pay to store traces that do not add value to your application performance monitoring.
For instance, you can create filters to keep all traces for:
- all credit card transactions over $100
- high-priority customers using a mission-critical feature of your SaaS solution
- a canary deployment of a critical application update
- specific versions of an online delivery service application
- traces from the latest version of your iOS application in a specific geography
Retention filters help you sift through the large volumes of traces your applications generate, giving you complete control over the cost of retaining them and allowing you to add the necessary context for faster troubleshooting.
Flexible and controllable tracing
With Datadog Distributed Tracing, you can search and analyze your error, high-latency, and high-value traces in real time to debug application performance issues and better understand customer impact. Datadog enables you to control the ingestion rate per instrumented application, ensuring that you have complete transparency into service performance. You also have full control over the traces you keep (and the cost of keeping them) with retention filters. Check out our documentation to learn more about tracing and Datadog APM. If you don’t have a Datadog account, you can sign up for a free trial.
