
Paul Gottschling

Addie Beach

Anjali Thatte
While the output of certain RabbitMQ CLI commands uses the term “slave” to refer to mirrored queues, RabbitMQ has disavowed this term, as has Datadog.
When collecting RabbitMQ metrics, you can take advantage of RabbitMQ’s built-in monitoring tools and ecosystem of plugins. In this post, we’ll introduce these RabbitMQ monitoring tools and show you how you can use them in your own messaging setup.
| Tool | What you get | Metrics it collects |
|---|---|---|
| Built-in CLI | Status snapshots of RabbitMQ’s core application objects | Node resource use, Queue performance |
| Management plugin | A built-in web server that reports metrics via UI and API | Exchange metrics, Node resource use, Connection performance, Queue performance |
| Tracing tools | Exchanges that report events from messages and application objects | Events |
The built-in CLI
For a quick scan of your application’s vital signs, you can turn to RabbitMQ’s CLI: rabbitmqctl. This tool, which comes installed with RabbitMQ, lets you perform management tasks (check server status, add nodes to a cluster, etc.) and exposes metrics about RabbitMQ objects such as queues, exchanges, and nodes. The RabbitMQ CLI was designed to be used with the management plugin. For more information about the two integration plugins supported by RabbitMQ, see The RabbitMQ Plugins section later in this post.
Values of RabbitMQ metrics are snapshots from the moment you run the rabbitmqctl command. Since the only configuration this command requires is a set of command-line options, the tool is a quick way to get a high-level view into key metrics. rabbitmqctl lets you access many of the metrics we cover in Part 1, including node-level resource metrics, connection performance metrics, and detailed breakdowns of message counts within queues. A full list of rabbitmqctl metrics is here.
You can collect most metrics from the CLI by running
rabbitmqctl list_<item>The <item> might be a kind of application object, such as queues or exchanges, or other sources of data like users or permissions. You can specify which RabbitMQ metrics to collect, and rabbitmqctl returns them as a series of columns.
For instance, we might use rabbitmqctl to check for bottlenecks in an application that queries an API for data about New York City. The application retrieves raw data from the API and passes it to a queue. The queue’s consumer processes the data, aggregates it by borough, and sends it to another queue. To query RabbitMQ for queue names, total messages, messages ready for consumption, state (running, idle…), and consumer utilization, we can run:
sudo rabbitmqctl list_queues name messages messages_ready state consumer_utilisationA full list of columns for queues is here. “Utilisation” uses the British spelling. The resulting data looks like this:
Listing queuesstaten_island_queue 426 426 runningbronx_queue 0 0 running 1.0brooklyn_queue 0 0 running 1.0queens_queue 0 0 running 1.0manhattan_queue 0 0 running 1.0raw_data 1 0 running 1.0all_events 0 0 running 1.0tracer 0 0 running 1.0Though each queue is running, staten_island_queue has two metrics with especially high values: messages_ready and messages. Messages are entering the queue and not leaving. As it turns out, staten_island_queue has no consumer_utilisation. While the other queues report the maximum value of 1.0, this one shows a blank. The queue’s consumers are not available to receive messages. One next step could be to investigate our consumers for exceptions.
Another use of rabbitmqctl is to get a quick set of metrics about your RabbitMQ environment. The command rabbitmqctl status lists statistics about the runtime of your RabbitMQ server. Here you’ll find a number of node-level resource metrics, including usage for file descriptors, sockets, and disk space. You’ll also find, as shown here, a breakdown of memory usage in bytes:
{memory, [{connection_readers,255008}, {connection_writers,81400}, {connection_channels,189272}, {connection_other,694920}, {queue_procs,382048}, {queue_slave_procs,0}, {plugins,3236488}, {other_proc,19575592}, {metrics,260224}, {mgmt_db,2080600}, {mnesia,79832}, {other_ets,1970600}, {binary,29566616}, {msg_index,44360}, {code,24918337}, {atom,1041593}, {other_system,9716726}, {allocated_unused,24424144}, {reserved_unallocated,1347584}, {total,119865344}]}The RabbitMQ plugins
RabbitMQ provides two plugins for collecting telemetry data from its nodes and clusters: the management plugin and Prometheus plugin. The management plugin was the original version of RabbitMQ supported by Datadog—as of February 2022, Datadog now also supports the Prometheus plugin. While the plugins have different designs and endpoints, they provide much of the same data. You can use either to monitor the performance of your RabbitMQ cluster, with metrics for your nodes and queue pipelines as well as system overviews. However, the Prometheus plugin also enables you to receive data in the OpenMetrics format, which is not possible with the management plugin.
The management plugin
The RabbitMQ management plugin extends its host node with a web server, which reports metrics from the host node and any nodes in its cluster. It comes with an HTTP API, an interactive web UI, and an extended set of command line tools. The API and web interface report the same metrics as rabbitmqctl, and add statistics of their own.
For example, the RabbitMQ management plugin exposes the message_stats object, which gives you counts and rates of traffic through your messaging setup. This is where you’ll find the metrics related to exchanges and message rates in Part 1. Do note that the management plugin only stores up to one day of metrics. Depending on your needs, you may opt to query the API and store the return values yourself.
Like rabbitmqctl, the management plugin ships with an installation of RabbitMQ. To set it up, run the following command:
rabbitmq-plugins enable rabbitmq_managementHTTP API
The RabbitMQ management plugin reports metrics from a web server. One way to gather the metrics is through an API. The API is useful for three reasons. First, it returns JSON, letting you work with RabbitMQ metrics in your own scripts. Second, it provides data as rates, complementing the snapshots you get in rabbitmqctl. Third, it gives you detailed information about the components of your application (see a list of stats here).
To access the API, direct an HTTP GET request to localhost:15672/api/<endpoint> (or 55672 for versions before 3.0). API endpoints are organized around RabbitMQ abstractions: nodes, connections, channels, consumers, exchanges, queues, and so on. You can narrow your query to a specific virtual host or component of your application. To choose the default virtual host, /, you need to include the encoding %2F in the API endpoint.
Message rates are useful if you want to know how smoothly traffic moves through a given part of your system. For example, you can see whether messages leave a queue as quickly as they arrive. In our demo application, we’ll compare rates for messages with two statuses: those published into an exchange and routed to the raw_data queue, and those delivered to consumers. To start, this query returns information about the queue raw_data:
http://localhost:15672/api/queues/%2F/raw_data?msg_rates_age=300&msg_rates_incr=100We’ve set msg_rates_age=300 to constrain our data to the last five minutes, and msg_rates_incr=100 to check our queue for samples every 100 seconds. Both query parameters are necessary for obtaining averages, which the web server calculates from the samples. You’ll find averages, samples, and rates in publish_details.
"publish_details":{ "avg":2730.5, "avg_rate":1.3833333333333333, "samples":[ {"timestamp":1513276900000,"sample":2939}, {"timestamp":1513276800000,"sample":2795}, {"timestamp":1513276700000,"sample":2664}, {"timestamp":1513276600000,"sample":2524}], "rate":1.44}In this object, avg is the average count of messages across the samples. Since message counts are cumulative, the average includes all messages of this type over the lifetime of the queue. samples are collected at the interval we specify, yielding an avg_rate. rate is per second, showing the change since the last sample.
There’s a similar set of statistics in deliver_get_details, again taking samples every 100 seconds across our five-minute interval.
"deliver_get_details":{ "avg":2731.0, "avg_rate":1.3866666666666667, "samples":[ {"timestamp":1513276900000,"sample":2940}, {"timestamp":1513276800000,"sample":2796}, {"timestamp":1513276700000,"sample":2664}, {"timestamp":1513276600000,"sample":2524}], "rate":1.44}In the last five minutes, published messages have roughly kept pace with deliveries. Messages are moving through the queue with no bottlenecks.
If you plan to query the API from within your application, you’ll need to make sure that you’ve configured the RabbitMQ management plugin. You’ll want to adjust the cors_allow_origins setting to permit requests from your application’s domain. And if your application uses HTTPS, you’ll want to make sure that the API does so too (by default it does not).
The web UI
Once you’ve started the broker and installed the RabbitMQ management plugin, you’ll have access to a built-in metrics UI. Point a browser to the root of the web server, e.g., localhost:15672, to see a number of dashboards. These correspond roughly to the endpoints of the HTTP API. There’s an overview page as well as links to pages for connections, channels, exchanges, and queues.
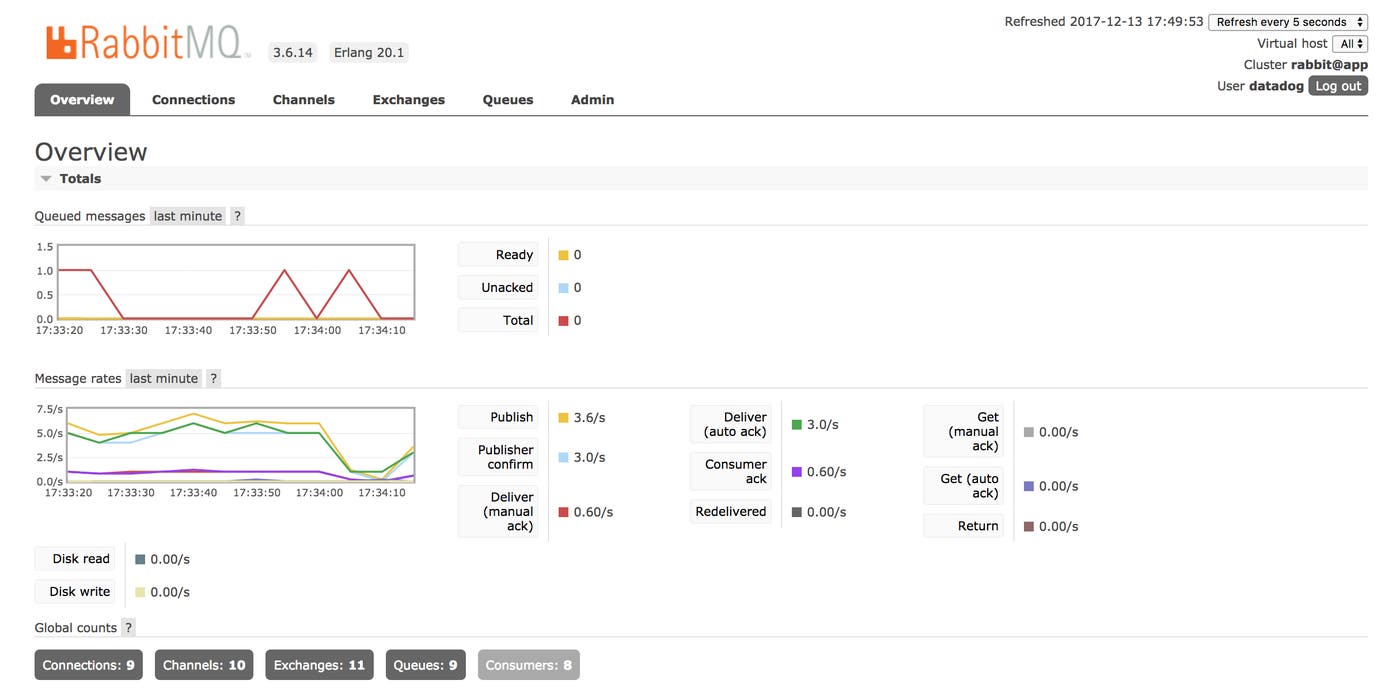
The UI updates in real time and displays data from several sources at once. The overview tab includes timeseries graphs of queue depths and message rates. Pages for individual connections, channels, exchanges and queues include their own timeseries graphs. You can check the web interface and know at a glance whether any part of your RabbitMQ application has become unavailable. And by clicking a tab for connections, channels, exchanges, and queues, you can compare key work metrics for message and data traffic throughout your application.
The RabbitMQ management UI can also graph your memory usage. You’ll find this graph under the “Memory details” section of the page for a given node. Explanations for categories within the graph are here.

While less customizable than rabbitmqctl or the HTTP API, the web UI gives you quick visibility into the health of your RabbitMQ setup.
rabbitmq_top
For monitoring the memory use of your RabbitMQ application, rabbitmqctl and the management plugin give you a breakdown by application component: connection_readers, queue_procs, binary, and so on. For a breakdown by RabbitMQ process, you can use another plugin, rabbitmq_top, which extends the management web server with a top-like list. As with the management plugin, it’s built into RabbitMQ (as of version 3.6.3 and later). Since rabbitmq_top is resource intensive, Pivotal advises that you run it only when needed.
To enable rabbitmq_top, run this command:
rabbitmq-plugins enable rabbitmq_topAfter you enable the management plugin and rabbitmq_top, you’ll find another tab in the management UI and another endpoint in the API. Both report memory consumption by process. In the “Admin” tab of the management UI, find the sidebar on the right and click “Top Processes.”
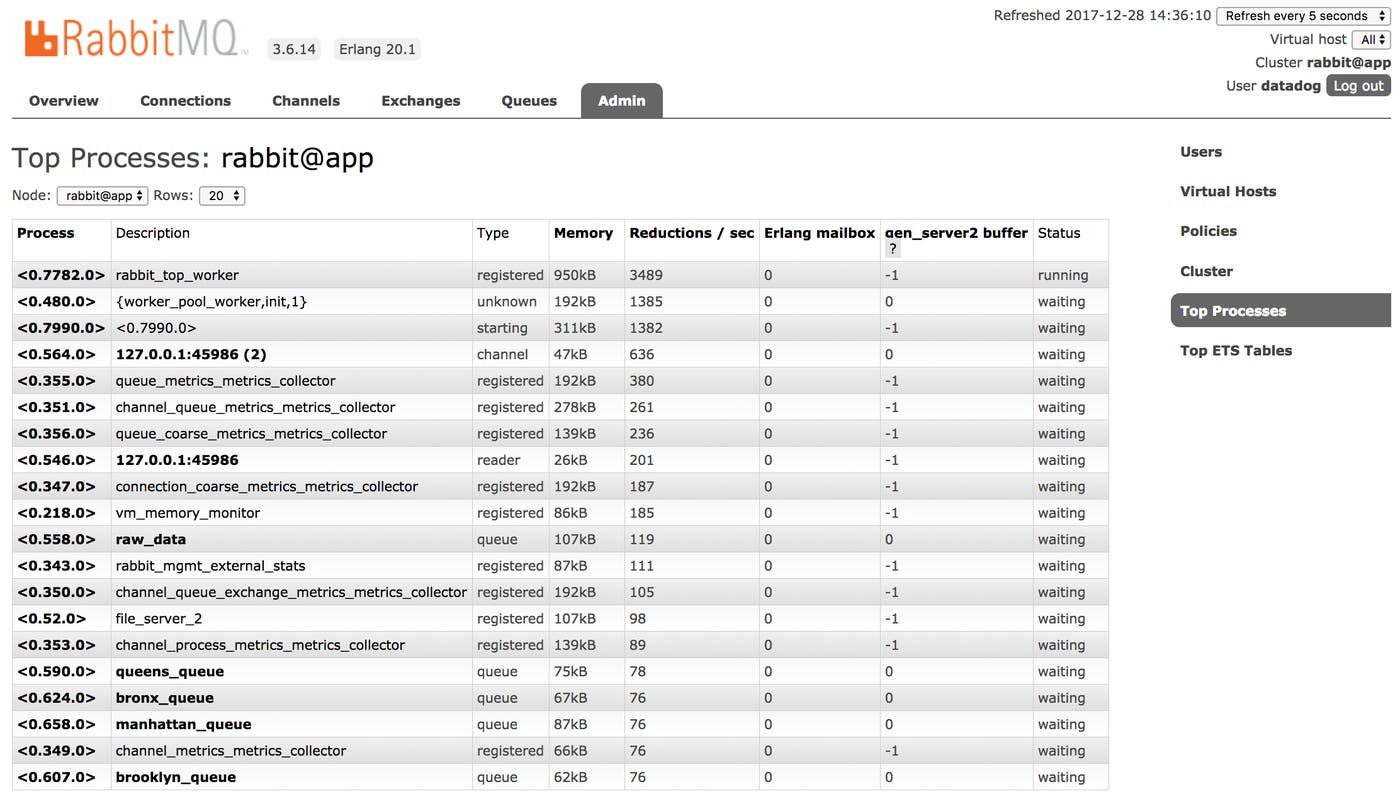
To access a similar breakdown through the API, send a GET request to /api/top/<node-name>, such as http://localhost:15672/api/top/rabbit@app.
If a process looks interesting, you can find out more within a dedicated web page. Either click the PID in the “Top Processes” page or access the API endpoint /api/process/<pid>. <pid> includes leading and trailing zeroes as well as angle brackets, as in <0.513.0>. Whether you use the UI or API, rabbitmq_top reports the same metrics, letting you choose the format that fits your needs.
Unlike other parts of the RabbitMQ management UI, the “Top Processes” page does not include a timeseries graph, but reports a static count of memory consumption with each refresh.
rabbitmqadmin
The RabbitMQ management plugin also ships with rabbitmqadmin, a CLI that combines the visual simplicity of a UI with the ability to enter commands in a terminal. To download it, enable the management plugin and visit http://localhost:15672/cli/ (adjust the host protocol, domain, and port based on your configuration settings). While rabbitmqadmin does make data available on the command line, the RabbitMQ documentation advises using the more fully featured HTTP API if you’d like to automate your monitoring.
The Prometheus plugin
Prometheus is an open source monitoring toolkit that uses a dimensional data model to organize timeseries metrics. Third-party applications like RabbitMQ can easily expose their monitoring data to Prometheus by using its text-based exposition format, which includes details about metric names, values, and metadata. The popular OpenMetrics project began as a way to standardize this exposition format.
RabbitMQ provides a Prometheus plugin that enables users to leverage
OpenMetrics for granular system monitoring. To use the Prometheus plugin with RabbitMQ, you must already have Prometheus installed. You can then enable the rabbitmq_prometheus plugin by running the following command:
rabbitmq-plugins enable rabbitmq_managementPrometheus endpoints
Prometheus can return data in two modes: aggregated or per-object. Aggregated groups your metrics together by name and comes with a low performance overhead. Meanwhile, per-object mode returns individual metrics for every object-metric pair, providing better data fidelity at the cost of heavier resource consumption.
You can select which mode you want to use by configuring different Prometheus endpoints:
/metrics: returns aggregated metrics. This is the default endpoint.
/metrics/per-object: returns all per-object metrics for every RabbitMQ entity.
/metrics/detailed: returns per-object metrics only from the metric groups and virtual hosts listed as query parameters, lowering resource usage.
Events and Tracing
To connect the swings of your performance metrics with events in the life of the message broker, RabbitMQ offers two plugins and one built-in tool.
- The event exchange: Receives messages when application objects are created and destroyed, policies are set, and user configurations are changed.
- The firehose: Re-publishes every message in your RabbitMQ setup to a single exchange for fine-grained debugging of your messaging activity.
rabbitmq_tracing: Lets you decouple tracing from your application code by controlling the firehose through the management UI.
Event exchange
When the RabbitMQ server undergoes changes, these are silent by default. Exchanges are created. Permissions are granted. Consumers go offline. To observe these events, you can use a plugin. The event exchange ships with RabbitMQ version 3.6.0 and later. To enable it, run the following command:
rabbitmq-plugins enable rabbitmq_event_exchangeWith the event exchange, events are published as messages, with the bodies empty and the routing keys conveying data: queue.deleted, consumer.created, user.authentication.success, and so on. Events are routed to a single exchange,amq.rabbitmq.event, leaving your application to pass them into queues.
Because events are broadcast as messages, working with events is a matter of handling the exchange as you would any other. This example uses Ruby’s AMQP client, bunny, to declare the event exchange and its queues, bindings and consumers.
require 'bunny'
conn = Bunny.newconn.startch = conn.create_channel
q = ch.queue('all_events')
x = ch.topic( 'amq.rabbitmq.event', :durable => true, :internal => true)
q.bind(x, :routing_key => "#")
q.subscribe do |delivery_info, properties, body| # Process the messages (not shown)endThe routing keys in the event exchange include two or three words. You can route all events to a single queue with the routing key # (as above). You can also declare separate queues for events that belong to different kinds of objects, for instance queue.# or alarm.#. When declaring the exchange inside your application, you’ll need to make sure that the options durable and internal are set to true, matching the plugin’s built-in configuration.
The firehose
While the event exchange follows changes in your messaging setup, you’ll need another tool for events related to messages themselves. This is the firehose, which routes a copy of every message published in RabbitMQ into a single exchange. The tool is built into the RabbitMQ server, and does not require any RabbitMQ plugins. The firehose is one way of debugging your messaging setup by achieving visibility at a fine grain. It’s important to note that since the firehose publishes additional messages to a new exchange, the bump in activity will impact performance.
To enable the firehose, run this command:
sudo rabbitmqctl trace_onYou will need to run this command every time you start the RabbitMQ server.
One advantage of the firehose is the ability to log messages without touching your application code. Rather than instrument each producer to publish to an exchange for logging, you can simply handle messages from the firehose, which are re-published to that exchange automatically. Just declare the exchange amq.rabbitmq.trace, along with its queues, bindings, and consumers, and set the exchange’s durable and internal properties to true.
You can identify the position of a message inside your application by its routing key within the firehose: publish.<exchange name> when it enters the broker, deliver.<queue name> when it leaves. Messages in the firehose have the same bodies as their counterparts elsewhere.
rabbitmq_tracing
RabbitMQ makes it possible to log your messages at an even greater remove from your application code than the standard firehose. Rather than handling messages from the firehose by declaring exchanges, queues, and consumers within your code, you instead use the management UI to route the firehose into a log file. The tool for this is a plugin, rabbitmq_tracing, which extends the RabbitMQ management plugin’s web server. rabbitmq_tracing is especially useful for obtaining traces quickly, avoiding the need to instrument any application code at all.
You can enable the rabbitmq_tracing plugin with this command:
rabbitmq-plugins enable rabbitmq_tracingThen, when you start the RabbitMQ server, run
sudo rabbitmqctl trace_onIn the management UI, click the “Admin” link on the top menu, then click “Tracing” on the right to view your data.
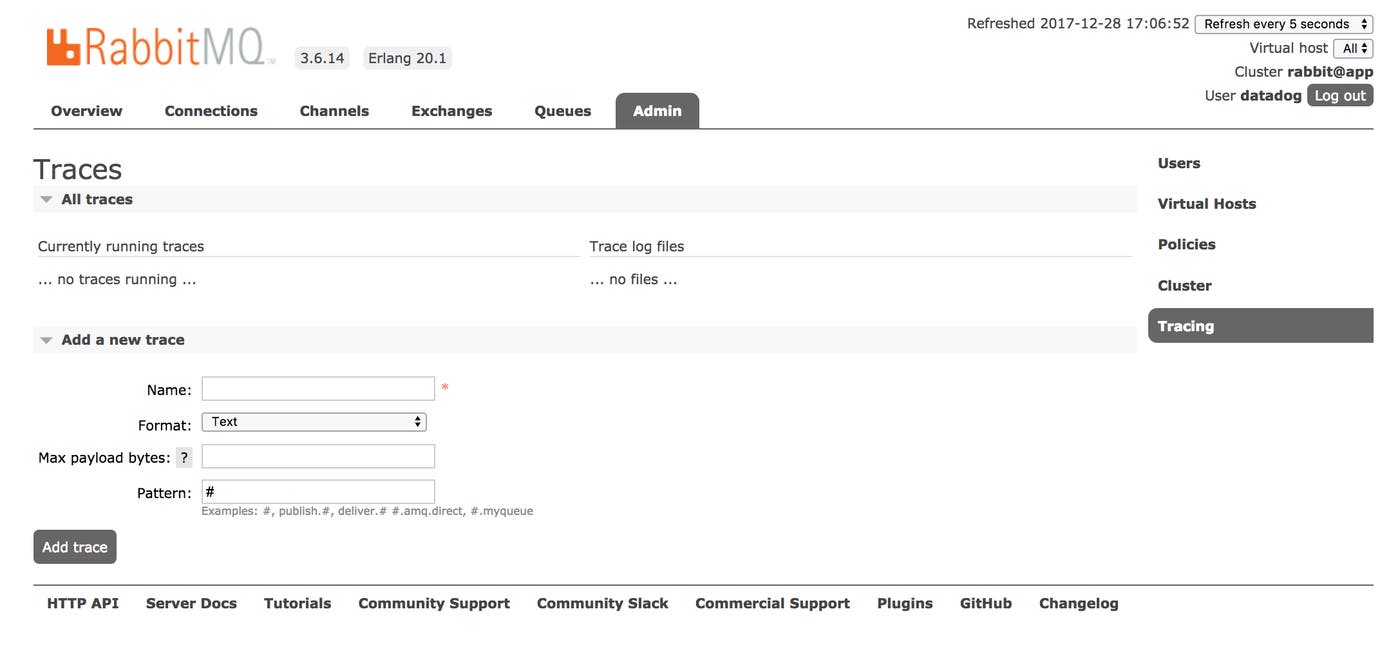
Making a log file available to the firehose may take some extra configuration. Within the “Overview” page, click the name of a node. In the page that follows, look for the location of the RabbitMQ configuration file, rabbitmq.config.
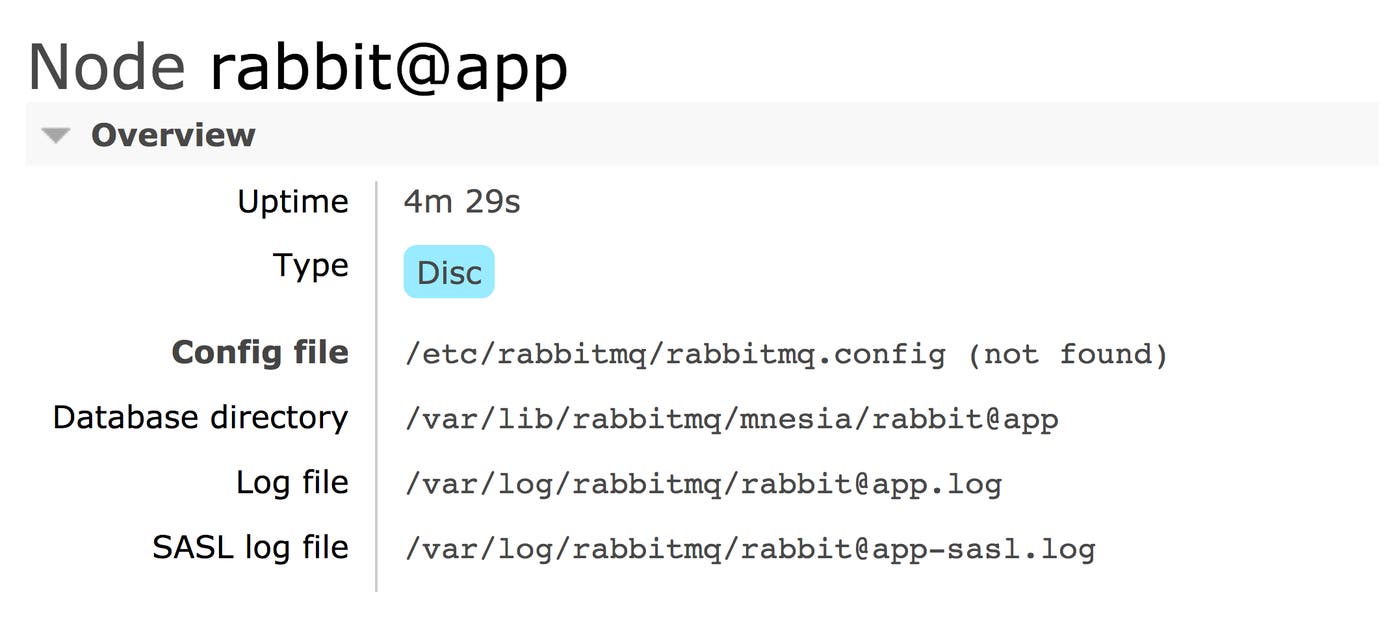
If the configuration file does not exist, create it at this location. Once you’ve done this, you can configure the tracer, setting the directory, username and password properties of the rabbitmq_tracing section. The file uses Erlang’s configuration syntax.
[ {rabbitmq_tracing, [ {directory, "/shared/src/log"}, {username, "username"}, {password, "password"} ]}].You will need to create the files in which RabbitMQ outputs the firehose. In rabbitmq.config, you will have assigned a folder location to the directory property. Place files with the .log extension here, and make sure that RabbitMQ has permission to read them. In the Tracing page within the management UI, you can now point the firehose to one of your log files. Set the “Name” of the trace to one of your files without the extension .log. The server will add the extension.
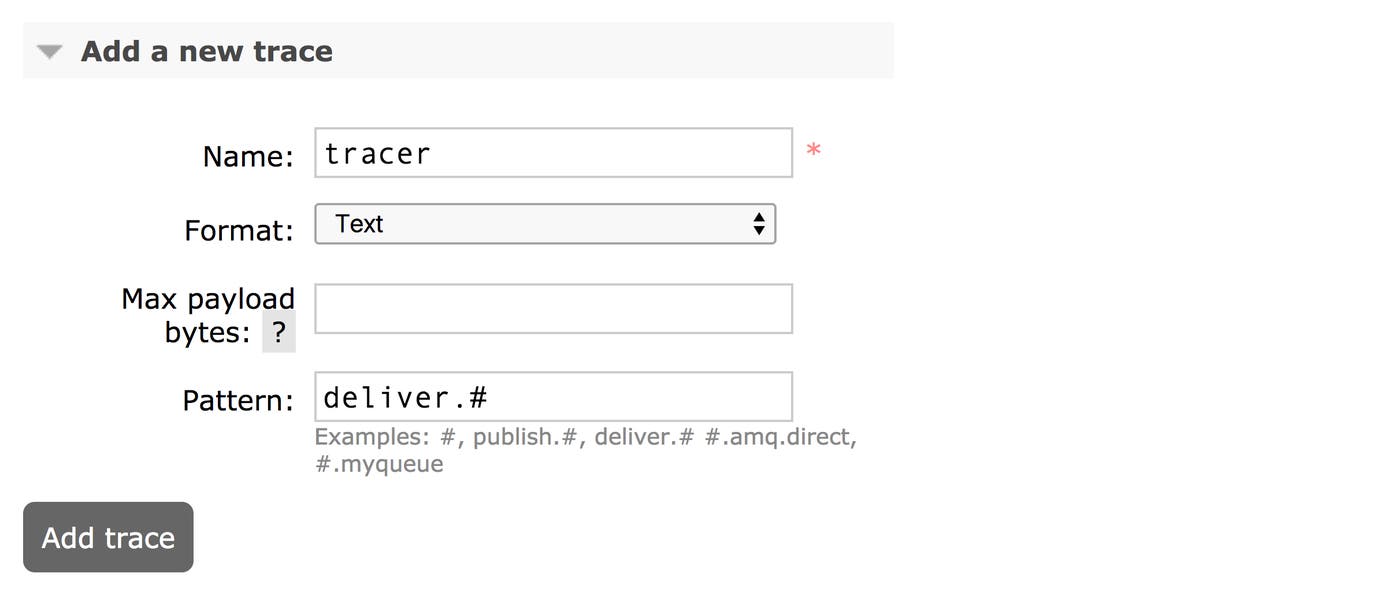
When setting the pattern for your log, you can name a routing key using the same syntax you use to bind queues and exchanges. An example log might look like this:
2017-12-14 19:36:20:162: Message received
Node: rabbit@appConnection: 127.0.0.1:55088 -> 127.0.0.1:5672Virtual host: /User: guestChannel: 1Exchange: boroughRouting keys: [<<"manhattan">>]Queue: manhattan_queueProperties: [{<<"priority">>,signedint,0}, {<<"delivery_mode">>,signedint,2}, {<<"content_type">>,longstr,<<"application/octet-stream">>}]Payload:<message data would be here>You can also format the log file as JSON. In the “Add a new trace” form, set the value of the “Format” dropdown. The fields displayed will remain the same.
The name of your log file becomes an endpoint for the management API. In our example, this would be http://localhost:15672/api/trace-files/tracer.log.
It’s important to know that rabbitmq_tracing has a performance cost, using both memory and CPU, and isn’t recommended for systems that log more than 2,000 messages per second. Like the firehose, rabbitmq_tracing is a debugging tool to run only when needed.
RabbitMQ monitoring tools: Beyond one-at-a-time
In this post, we’ve covered a number of RabbitMQ monitoring tools. Each measures its own slice of performance. rabbitmqctl gives you metrics as at-the-moment counts. The management plugin and the Prometheus plugin go one step further, adding rates. With the event exchange and firehose, you get logs, both for messages and events.
You can go tool by tool, monitoring each level on its own. When using the management plugin, this process is a manual one, requiring deliberate commands and API calls. And there is no built-in, automatic method for comparing data between tools. While the Prometheus plugin can streamline this process a bit, you still need to connect it to a separate platform for organizing and visualizing metrics. As your messaging infrastructure scales, you’ll want a monitoring solution that does more work for you.
With Datadog’s RabbitMQ integration, you can get a unified view of data that, with your suite of RabbitMQ monitoring tools, you would need to piece together on your own. You can receive alerts, traces, and logs in a single place. We’ll show you how this works in Part 3. If you’d like to jump straight into Datadog, get started right away with a free trial.
Source Markdown for this post is available on GitHub. Questions, corrections, additions, etc.? Please let us know.


