Jean-Mathieu Saponaro
You probably know that you can monitor your aggregate host-level resource consumption with Datadog: CPU, memory, I/O, etc., but did you know that you can also monitor the resources used by each of your processes?
Datadog is for processes, too
Our Process Check feature has been designed to show you which processes (or group of processes) are hogging resources so that you can take appropriate action. While you were able to be notified when specific processes stopped running via process monitors, with the Process Check integration you can also analyze and set alerts on metrics such as CPU and memory usage, number of threads, and I/O.
As with all Datadog integrations, you can slice your process metrics by any tag you want so you can examine the exact set of metrics that matter to you.

Turn it on
To start using Process Check on your hosts, all you need to do is enable the integration, and enumerate the processes you want to monitor (name globbing is supported).
Get automated alerts

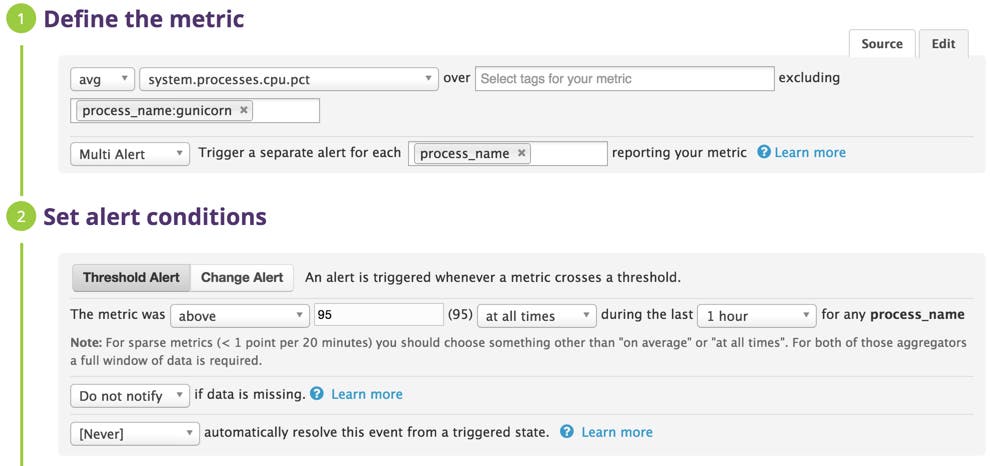
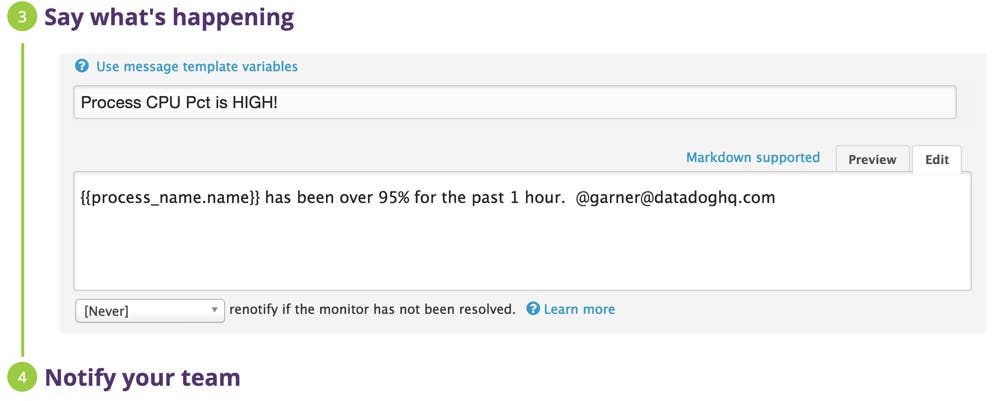
You can also set up Datadog to send alerts when any of your processes (or groups of processes) exceed specified thresholds. This lets you quickly identify and correct runaway processes, and those processes that are leaking memory or not terminating threads.


If you are already a Datadog customer, you can monitor process resource consumption by setting up Process Check here. Otherwise, try it out in your own environment by signing up for a free trial of Datadog.


