Prashant Rathi
This is a guest post by Prashant Rathi, Director of Product Management at [Portworx].
About Portworx
[Portworx] provides solutions for Kubernetes storage as well as other leading container schedulers, dramatically reducing storage, compute, and infrastructure costs for running mission-critical, multi-cloud applications with zero downtime or data loss. With Portworx, you can manage any database or stateful service on any infrastructure using any container scheduler. Portworx is trusted by many of the world’s most sophisticated IT organizations including Comcast, GE, Lufthansa Systems, the U.S. Department of Homeland Security, and Verizon.
Portworx has CLI and UI tools to manage and monitor the health of a running cluster. For production use cases, Portworx also provides timeseries monitoring and log analytics that can be integrated with dedicated monitoring services for historical and infrastructure-wide context. We are pleased to announce a new integration between Portworx and Datadog, so you can correlate performance, throughput, and latency metrics from Portworx with data from infrastructure and application components to help pinpoint performance bottlenecks and provision resources appropriately.
Monitor the health of Portworx clusters and nodes

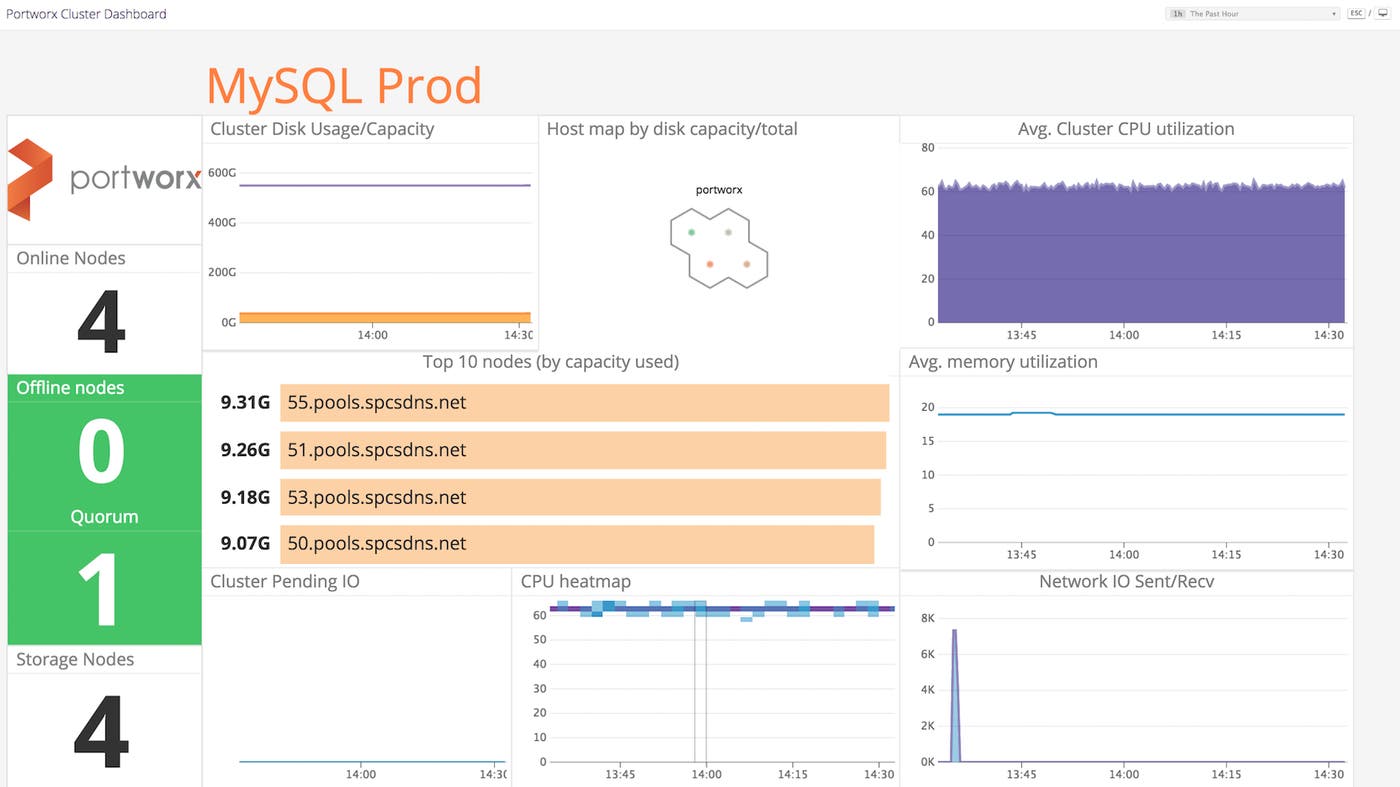
Customers deploy Portworx on hundreds of nodes and across multiple clusters. In these distributed environments, you need a traffic-light dashboard that helps you monitor each cluster’s health and resource usage. In Datadog, you can build a single dashboard to monitor all your clusters, and then use template variables to drill down to a specific cluster using built-in tags. For more focused troubleshooting, you can drill down to metrics from individual nodes in seconds.
With the new integration, Datadog collects cluster-level metrics from Portworx such as capacity usage, pending I/O, and more. You can use that data to set Datadog alerts for indicators like quorum or capacity used, enabling you to proactively prepare for maintenance events. With machine learning features like outlier detection, you can be notified automatically if a single node is behaving different than others.
Understand usage for capacity planning
As more workloads and users onboard, capacity planning becomes crucial for continued operations. Measuring overall usage against available resources and ranking nodes by usage are simple ways to track capacity. With the host map, Datadog provides a quick and intuitive way to segment usage and identify heavily utilized resources. In a cluster dashboard like the one pictured in the section above, you can use the overall size of the hexagons in a host map to denote the node's capacity, and the color-coding to indicate the ratio of usage to capacity.
And as shown below, Datadog [forecasts] can help extrapolate usage trends into the future to trigger an alert when the usage is predicted to cross a predefined threshold (1.5 TB in this case) within a given interval.

Monitor usage, latency, and I/O performance metrics in context
Cluster-wide monitoring is important for daily operations, but when it comes to troubleshooting performance issues, you need to go deeper. Application developers often seek to answer questions such as: Why is my application slow? What changed between yesterday and today? At this point, metrics from individual data paths become invaluable for connecting application performance to the underlying storage layer.
With Portworx volume metrics in Datadog, it is easy for developers to understand per-volume I/O, throughput, and latency. By visualizing these metrics in conjunction with other infrastructure and application performance data, you can create custom dashboards tailored to a specific scenario. For example, you can build a dashboard tracking service-level performance alongside metrics from the volumes used by the application, so you can see at a glance whether any slowdowns are due to capacity issues, or abnormally high CPU utilization or I/O on the app hosts.

Additionally, anomaly detection in Datadog can compare performance data against expectations based on recurring patterns and trends, which is not possible with static threshold–based monitoring. By defining the evaluation window, the alerting and recovery threshold, and the allowable deviations from the prediction, you can monitor for anomalies in the 95th-percentile latency on any given volume, as shown above.
Get started
To start monitoring your Portworx clusters and nodes alongside the rest of your infrastructure and applications, check out the documentation on the new integration.

