
Bill Meyer
There are various strategies for deploying OpenTelemetry (OTel) in your environment. If you want to use OpenTelemetry Protocol (OTLP) to send signals to an observability backend, a key decision is whether you should deploy the OTel Collector, and if so, how.
In this post, we’ll take an introductory look at various deployment strategies with respect to the OTel Collector. We’ll start by looking at the simplest implementation designs, including the no-collector and agent-based deployments. Then, we’ll discuss the more advanced gateway collector deployment and when to use this design pattern.
The no-collector deployment pattern
When it comes to designing the architecture for sending OTLP signals to your backend, the most basic OTel deployment strategy is one that doesn’t use a collector at all. The no-collector deployment pattern sends telemetry signals from the application directly to the backend, as illustrated in the following diagram:
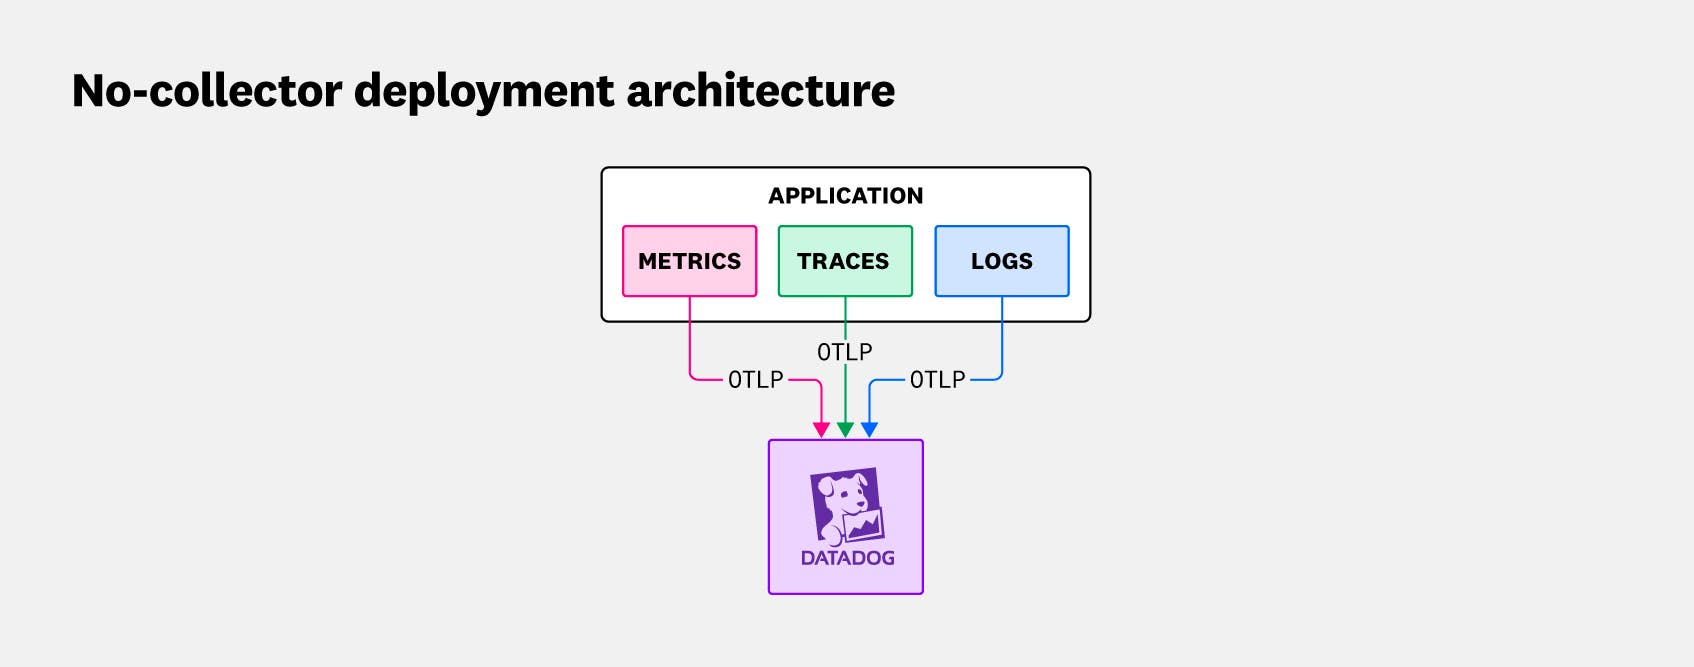
This type of deployment is particularly useful in cloud environments where serverless functions send signals directly to an endpoint, or where the backend observability platform consumes OTLP natively. In these situations, there is no need for the OTel Collector, and you can provide observability for your application with minimal configuration and management overhead.
The approach is not without tradeoffs. With this pattern, the application is tightly coupled to the backend. This means that if the backend becomes unavailable, the application can no longer send the telemetry data it has queued up, which effectively halts the application and causes service interruption. Directly sending telemetry data to a remote backend also has higher round-trip latency than offloading to a locally running OTel Collector has.
Another drawback to this approach is that it removes any centralized point you can use to consistently enrich, redact, transform, and route telemetry data—a function normally provided by the Collector. You can build some pipelining functionality by using the OTel SDK to build functions that transform signals at the source (where the application is running). With this option, however, making configuration changes requires a development team and a completely different workstream that is often less convenient than what’s needed to change a Collector configuration.
The agent collector deployment pattern
In the agent collector deployment pattern, a single instance of the OTel Collector (i.e., the agent collector) is deployed between an application and the backend. This agent collector is configured to determine where and how it can receive metrics, traces, and logs from the application. It also contains a set of configured exporters that enable it to send this data to one or more backend consumers. For more information on selecting or customizing an OTel Collector, read our blog on choosing the right OTel Collector distribution.
The agent collector pattern overcomes some of the limitations of the no-collector pattern. For example, one benefit of using the agent collector deployment is that it provides a local, temporary cache for storing telemetry data if the backend consumers become unavailable. Another advantage is that the OTel Collector can transform the telemetry data by using pipeline processors to enrich, filter, or reformat signals.
For this deployment pattern, the agent collector is normally deployed as close to the application or service as possible—for example, on the same host or within the same pod. The purpose of this close placement is to offload telemetry data quickly and efficiently from the application to minimize interruption.
A typical agent collector deployment architecture consists of a single application, which sends telemetry data to a single instance of the OTel Collector. The OTel Collector, in turn, sends these signals to any number of backends. This common deployment is illustrated below:
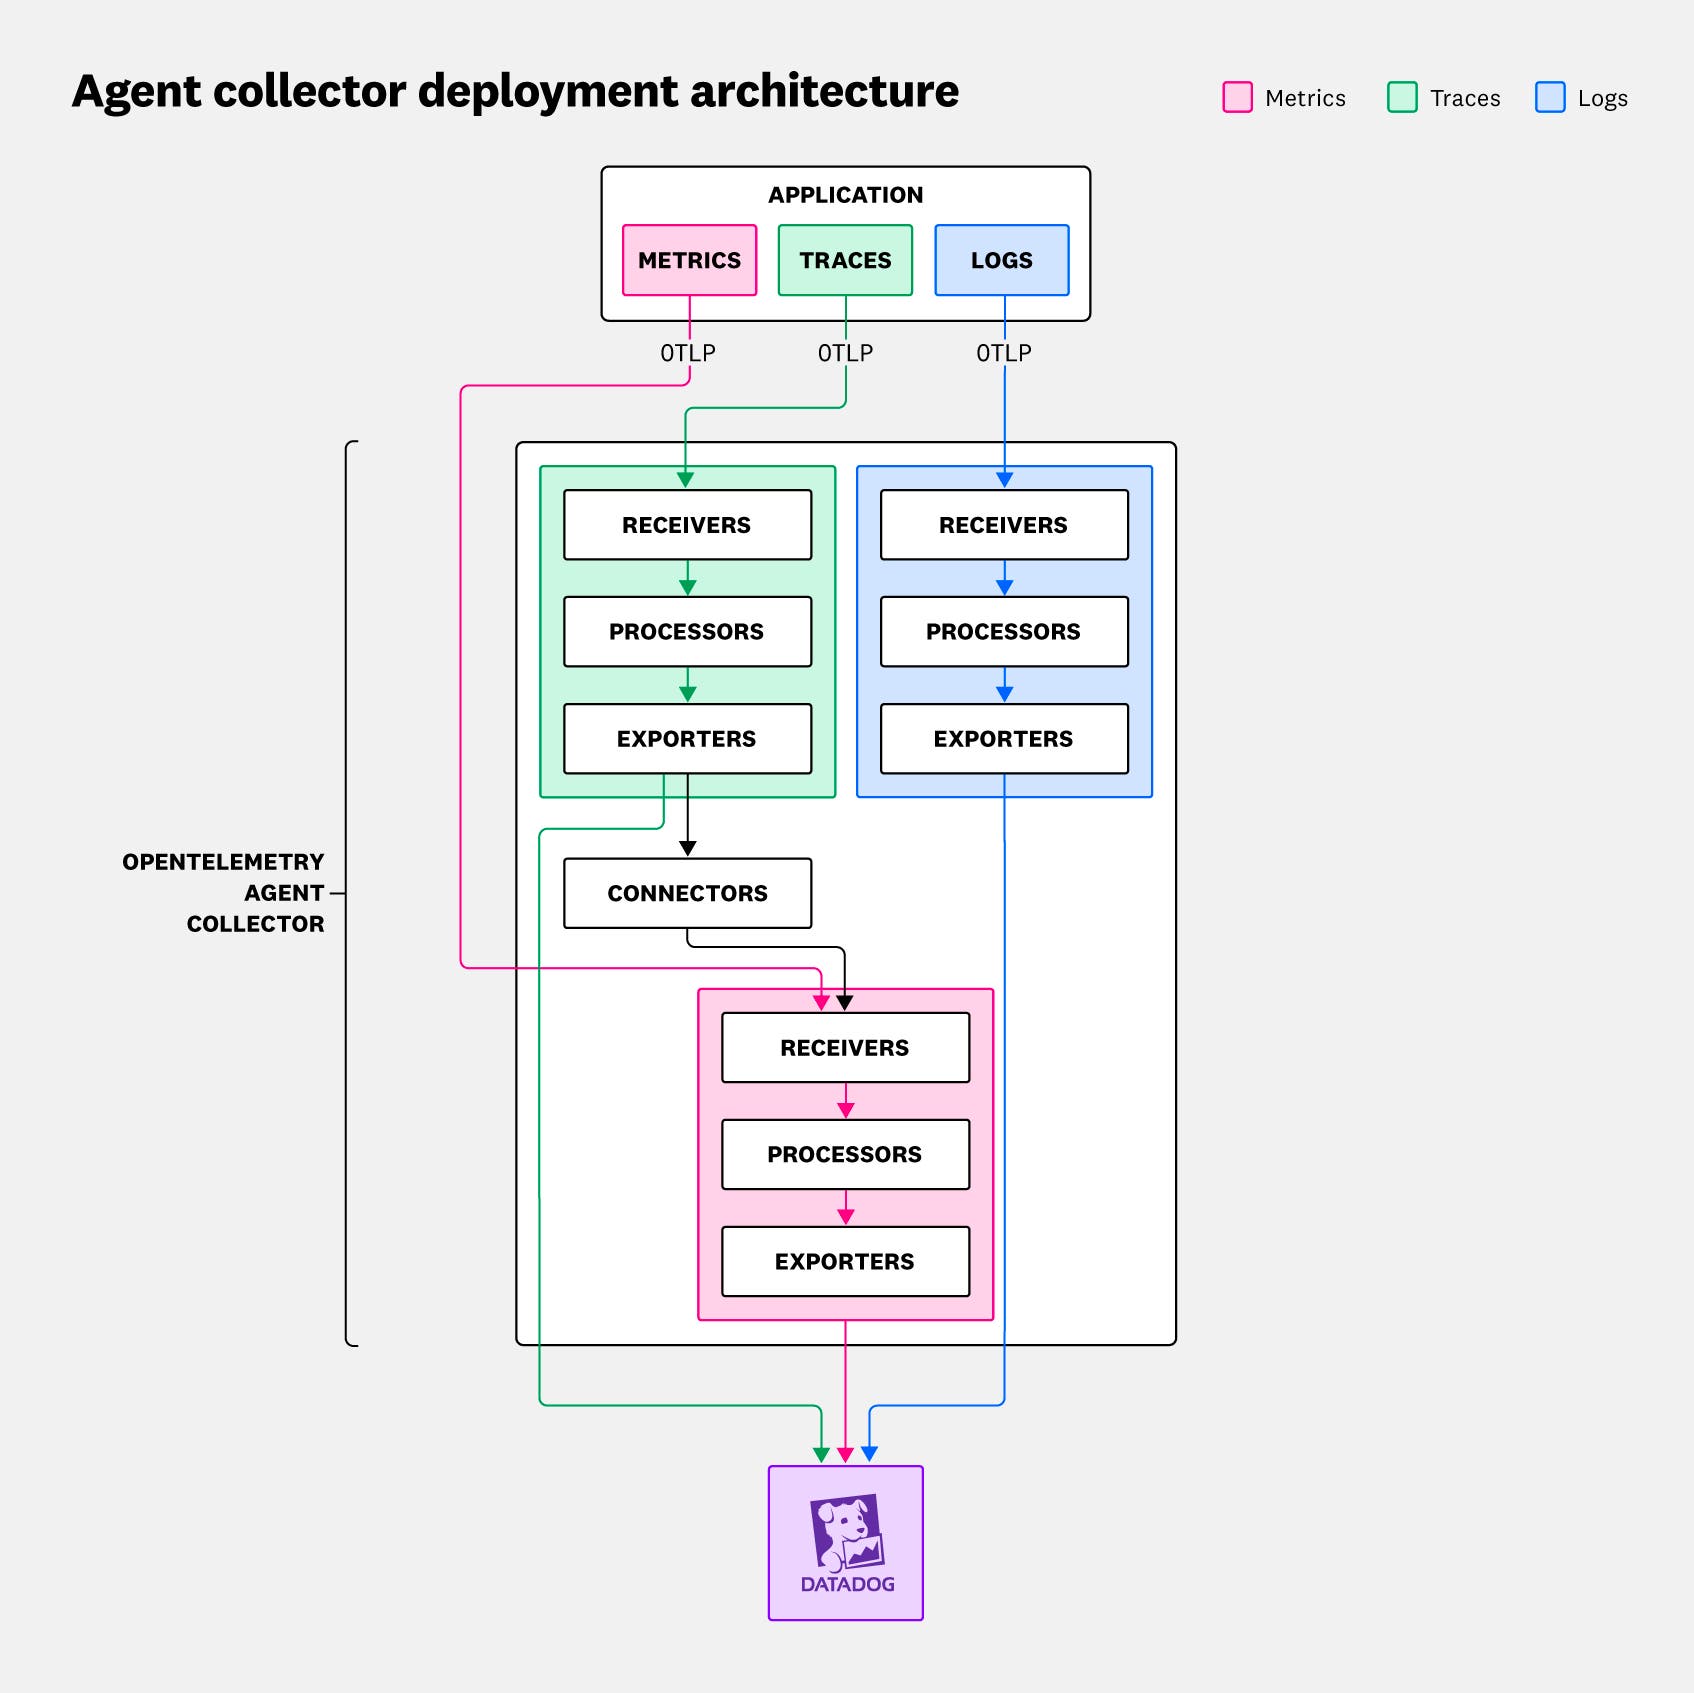
Because of its flexibility and simplicity, as well as the stability it provides, this pattern is attractive in many different use cases and scenarios. For example, it allows you to make configuration changes to the OTel Collector configuration without needing to modify your code or redeploy the application—unlike in the no-collector deployment.
The limitations of this scenario, however, can appear as organizations attempt to scale up their deployment of OTel Collector instances. Maintaining a fleet of configurations that consistently enrich, redact, transform, and route telemetry data across separate OTel Collector installations is a complex and error-prone process. Beyond these scaling issues, other situations may also arise that a standalone agent collector can’t handle. For example, tail-based sampling requires a complete trace with all spans collected from all sources to make a sampling decision. If spans belonging to the same trace are collected by multiple agent collectors without ever being consolidated, then a single view of the entire trace is never assembled, and tail-based sampling is not possible. This is where the gateway collector deployment pattern comes in.
The gateway collector deployment pattern
The gateway collector deployment pattern introduces a secondary layer of telemetry data collection. In this scenario, the secondary layer performs an aggregation function, with multiple agent collectors forwarding signals downstream to an OTel Collector instance acting as a gateway collector. The gateway then forwards the aggregated telemetry data to the backend, as illustrated below:
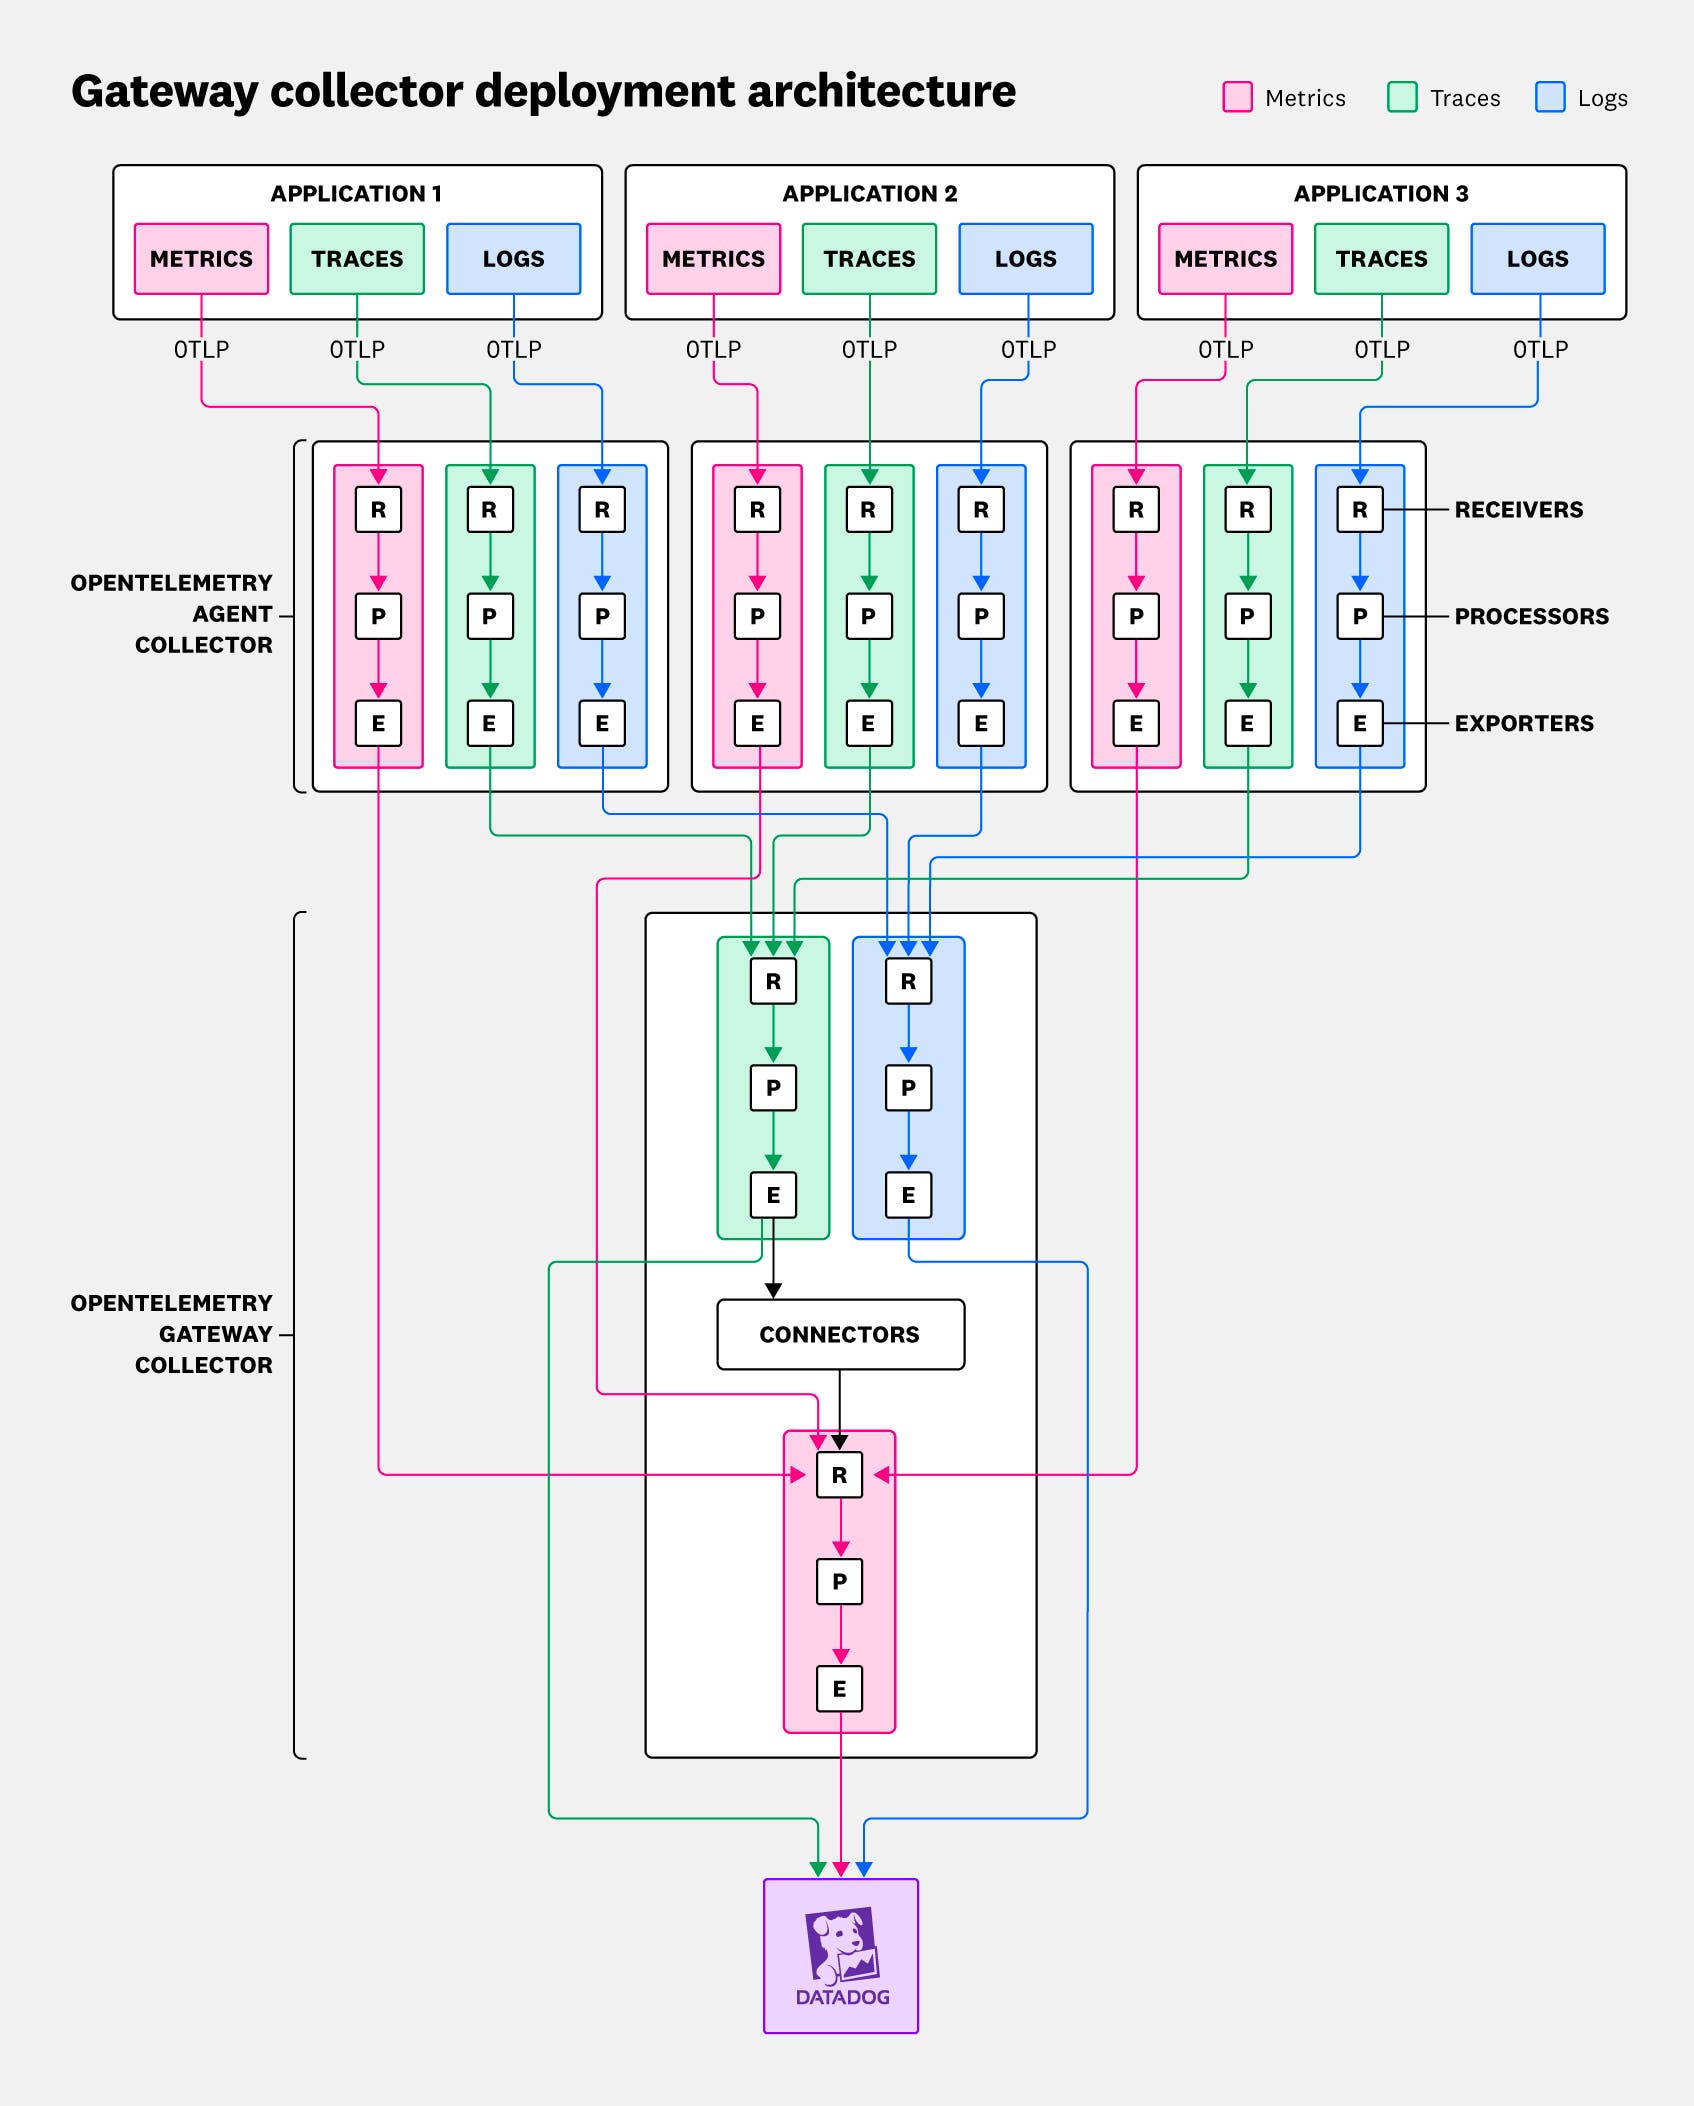
In reality, the previous diagram is simplified because it depicts an architecture with only a single gateway collector instance. More often, multiple gateway collector instances are deployed together with a load balancer, as shown in the following diagram:
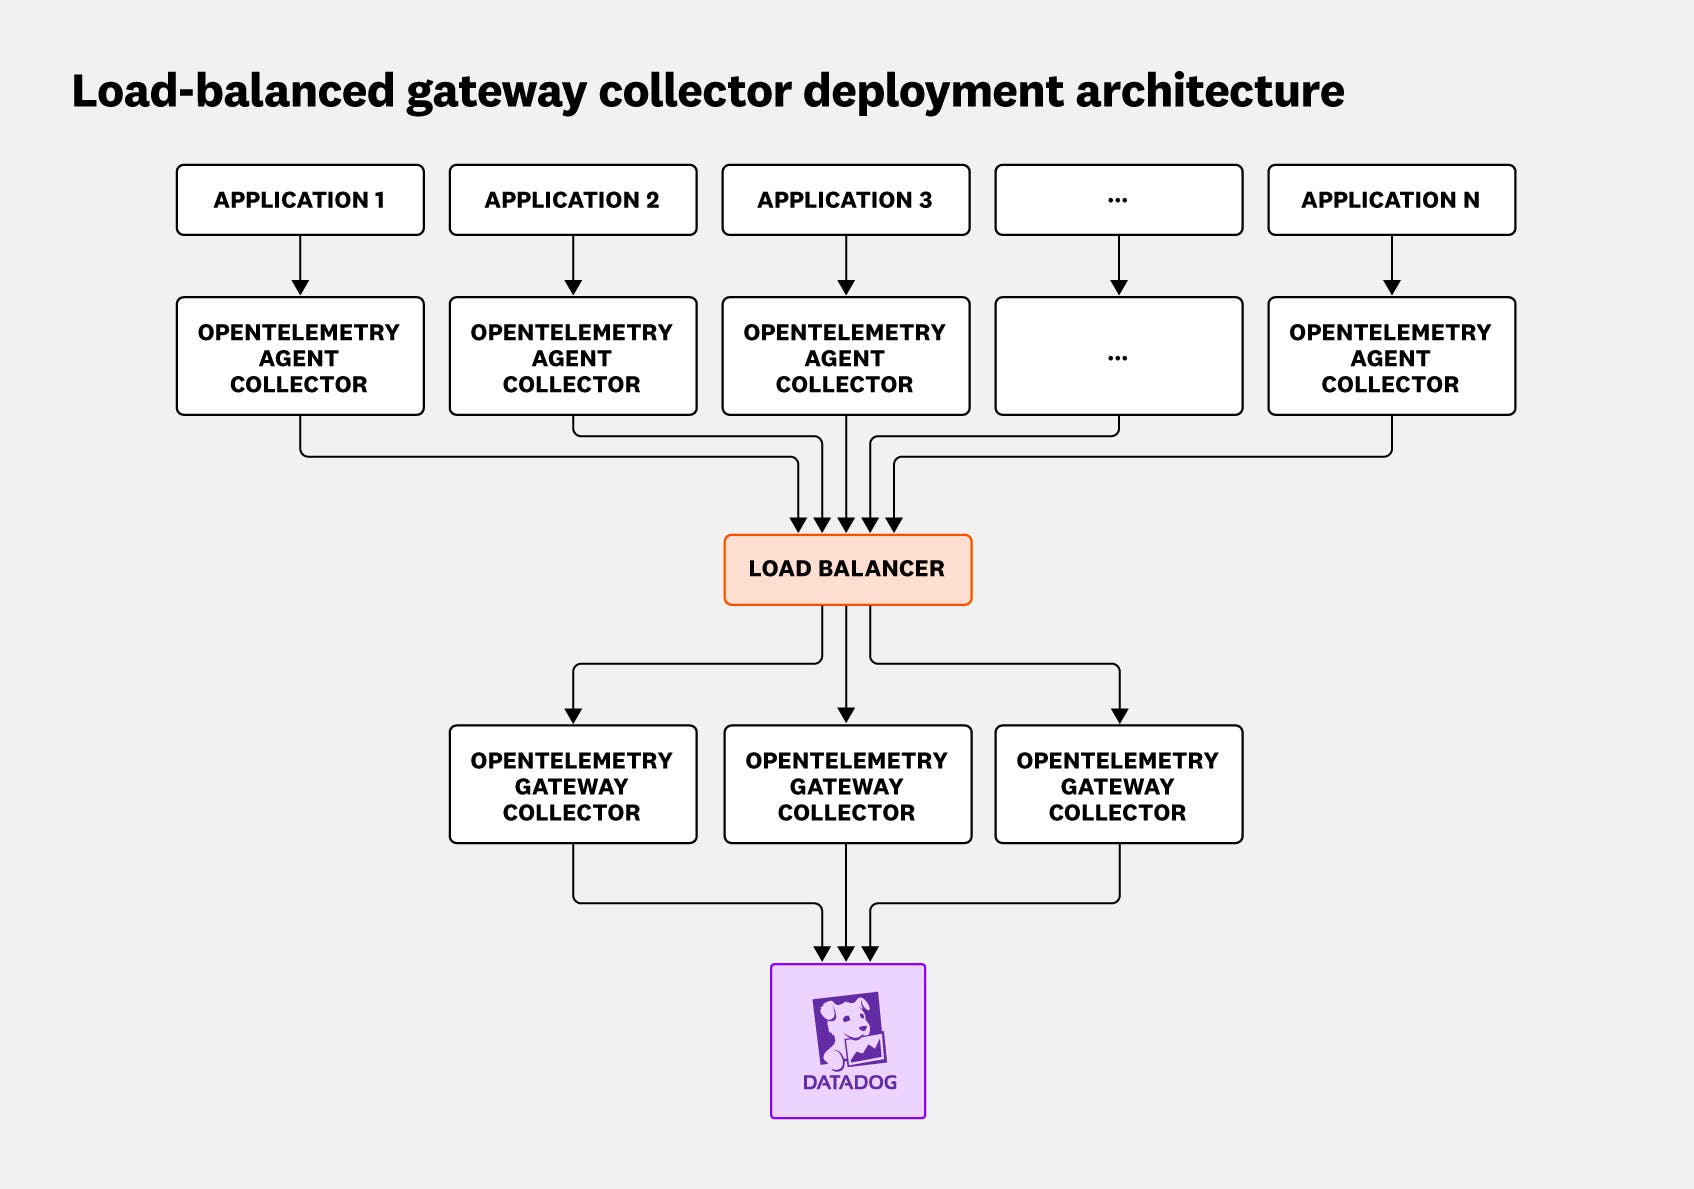
Using a load balancer with multiple gateway collectors offers a number of advantages. First, this design enables you to scale gateway instances up or down to accommodate demand. It also provides high availability for your gateway collectors and avoids reliance on a single point of failure.
Whether you use one gateway or many, the gateway collector deployment pattern also offers a security benefit for organizations whose policies forbid internal applications from accessing the internet directly. In these scenarios, gateway deployments are a great option because they consolidate the number of possible egress points to a manageable size, which simplifies enforcement of the policy.
When to use the gateway collector deployment pattern
In this section, we’ll go through some use cases for deploying a gateway instance. A common theme you’ll see among these use cases relates to the need for identical data pipelines throughout your architecture. Accordingly, if you are planning to deploy multiple instances of the OTel Collector, think through the telemetry processing needs for your applications: Are the requirements universal to all your OTel Collector deployments, or (for example) is your architecture supporting different applications with different telemetry processing needs? If it’s the former, your scenario is likely a candidate for a gateway collector deployment because processing can be unified. If it’s the latter, your needs are probably best handled by multiple agent collectors without a gateway.
With those guidelines in mind, here are some typical use cases that are best served by using a gateway collector:
-
You want to consistently enrich the telemetry signals such that all applications and services deployed in a particular environment are tagged with the same environment identifier (such as
dev,qa,stage, orprod).For this situation, you can use an attributes processor deployed to the gateway to always upsert the
deployment.environment.nameattribute as follows:
processors: attributes: actions: - key: deployment.environment.name value: stage action: upsert-
You want to implement tail-based sampling to control your span egress.
A fully assembled trace containing all spans is necessary in this case to apply sampling policies. As such, you need to apply the sampling policies on a gateway instance, as follows:
processors: tail_sampling: decision_wait: 1s expected_new_traces_per_sec: 100 policies: # Policy #1 - name: env-based-sampling-policy type: and and: and_sub_policy: - name: env-prefix-policy type: string_attribute string_attribute: key: env values: - dev - qa - name: env_sample-policy type: always_sample-
You need to compute request, error, and duration (RED) metrics from span data.
This is a perfect candidate for a gateway deployment, for a couple of reasons. First, it limits the configuration requirements of a
spanmetricsconnector to just the gateway deployments. Second, you need to compute span metrics before applying tail sampling policies. Because tail sampling policies must be deployed to a gateway instance, it makes sense to collocate these two different processing steps on the same instance.
connectors: spanmetrics: namespace: span.metricsservice: pipelines: traces: receivers: [otlp] exporters: [spanmetrics, datadog] metrics: receivers: [spanmetrics] exporters: [datadog]-
You want to use processing pipelines to look for sensitive data in the telemetry stream before egressing the data externally.
For example, you might want to scan for protected health information (PHI) in health care data, payment card industry (PCI) in financial data, or even bearer tokens in HTTP headers. Because you want scanning rules to be applied universally across all telemetry data, using a gateway will make this task easier.
processors: transform/replace: log_statements: - context: log statements: - set(attributes["pci_present"], "true") where IsMatch(body, "\"creditCardNumber\":\\s*\"(\\d{4}-\\d{4}-\\d{4}-\\d{4})\"") - replace_pattern(body, "\"creditCardNumber\":\\s*\"(\\d{4}-\\d{4}-\\d{4}-\\d{4})\"", "\"creditCardNumber\":\"***REDACTED***\"")redaction: allow_all_keys: false allowed_keys: - description - group - id - name ignored_keys: - safe_attribute blocked_values: # Regular expressions for blocking values of allowed span attributes - '4[0-9]{12}(?:[0-9]{3})?' # Visa credit card number - '(5[1-5][0-9]{14})' # MasterCard number summary: debugWhen not to use a gateway
Some tasks cannot be performed on the gateway instance. Typically, these tasks involve collecting attributes about the host where the Collector is running.
Here are two examples:
hostmetricsreceiver: You want to collect host metrics from where the agent collector (not the gateway collector) is running, so this component needs to be deployed on the agent collector host.
k8sattributesandresourcedetectionprocessors: As in the previous example, you want to use these processors to enrich telemetry attributes on the host or pod that the application is running on. For this reason, you should keep them on the agent collector.
Three deployment strategies to suit all your OTel needs
To collect telemetry data via OpenTelemetry and send signals to your preferred backend, three deployment architectures are primarily used: the no-collector, agent collector, and gateway collector patterns. The no-collector option, which sends telemetry data from your applications straight to your observability backend, is best suited for reliable, OTLP-ready backends that don’t require any data pre-processing. The agent collector deployment relies on an OpenTelemetry Collector instance between the application and the backend to improve reliability and allow for signal pre-processing. Finally, the gateway collector deployment pattern introduces a second level of aggregation and is best suited for large-scale environments where it’s advantageous to consolidate data streams before pre-processing telemetry data or applying policies.
For more information about using OpenTelemetry with Datadog, see our documentation. And if you’re not yet a Datadog customer, get started with a 14-day free trial.


