Barry Eom

Jordan Obey
Businesses deploying LLM workloads increasingly rely on LLM proxies (also known as LLM gateways) to simplify model integration and governance. Proxies provide a centralized interface across LLM providers, govern model access and usage, and apply compliance safeguards for smoother operations and reduced complexity—making LLM usage more consistent and scalable. But while proxies make LLM usage easier, consistent, and scalable, they introduce new monitoring and visibility challenges for both development teams building LLM-powered applications and infrastructure teams maintaining the central LLM proxy.
For application teams, proxies can create visibility gaps that make it difficult to determine whether an issue stems from the LLM itself or the proxy logic. For example, a prompt might trigger a guardrail implemented within the proxy, but without end-to-end tracing, teams have a blindspot on whether the rejection came from that guardrail or the model. Teams may also struggle to verify that personally identifiable information (PII) is redacted before requests are forwarded to the LLM provider, or that model fallback behavior is functioning as intended.
For infrastructure teams, proxies can introduce new single points of failure and create security vulnerabilities by mishandling sensitive data. Without proper monitoring and usage controls, it is difficult to track LLM usage by environment or service, leading to unexpected overages and spike in costs.
In this post, we’ll go over a few common challenges to optimizing the performance and cost efficiency of an AI proxy.
Monitor LLM proxy requests to optimize performance
Without effective monitoring, the same proxy features that simplify LLM usage—such as guardrail enforcement, fallback handling, or request routing—can introduce hidden performance risks. An overly strict guardrail might block valid prompts, while fallback logic could silently switch to a lower-tier model, reducing output quality. Even request routing—deciding which LLM to use for each task based on factors like cost, speed, or accuracy—can backfire if misconfigured, leading to delays or routing traffic to premium models unnecessarily. Load balancing issues can also cause uneven distribution, leaving some models overloaded while others sit idle. Without visibility into these internal behaviors, teams are left guessing about the root cause of degraded performance or unexpected behavior.
Get end-to-end visibility into your LLM and AI proxy activity
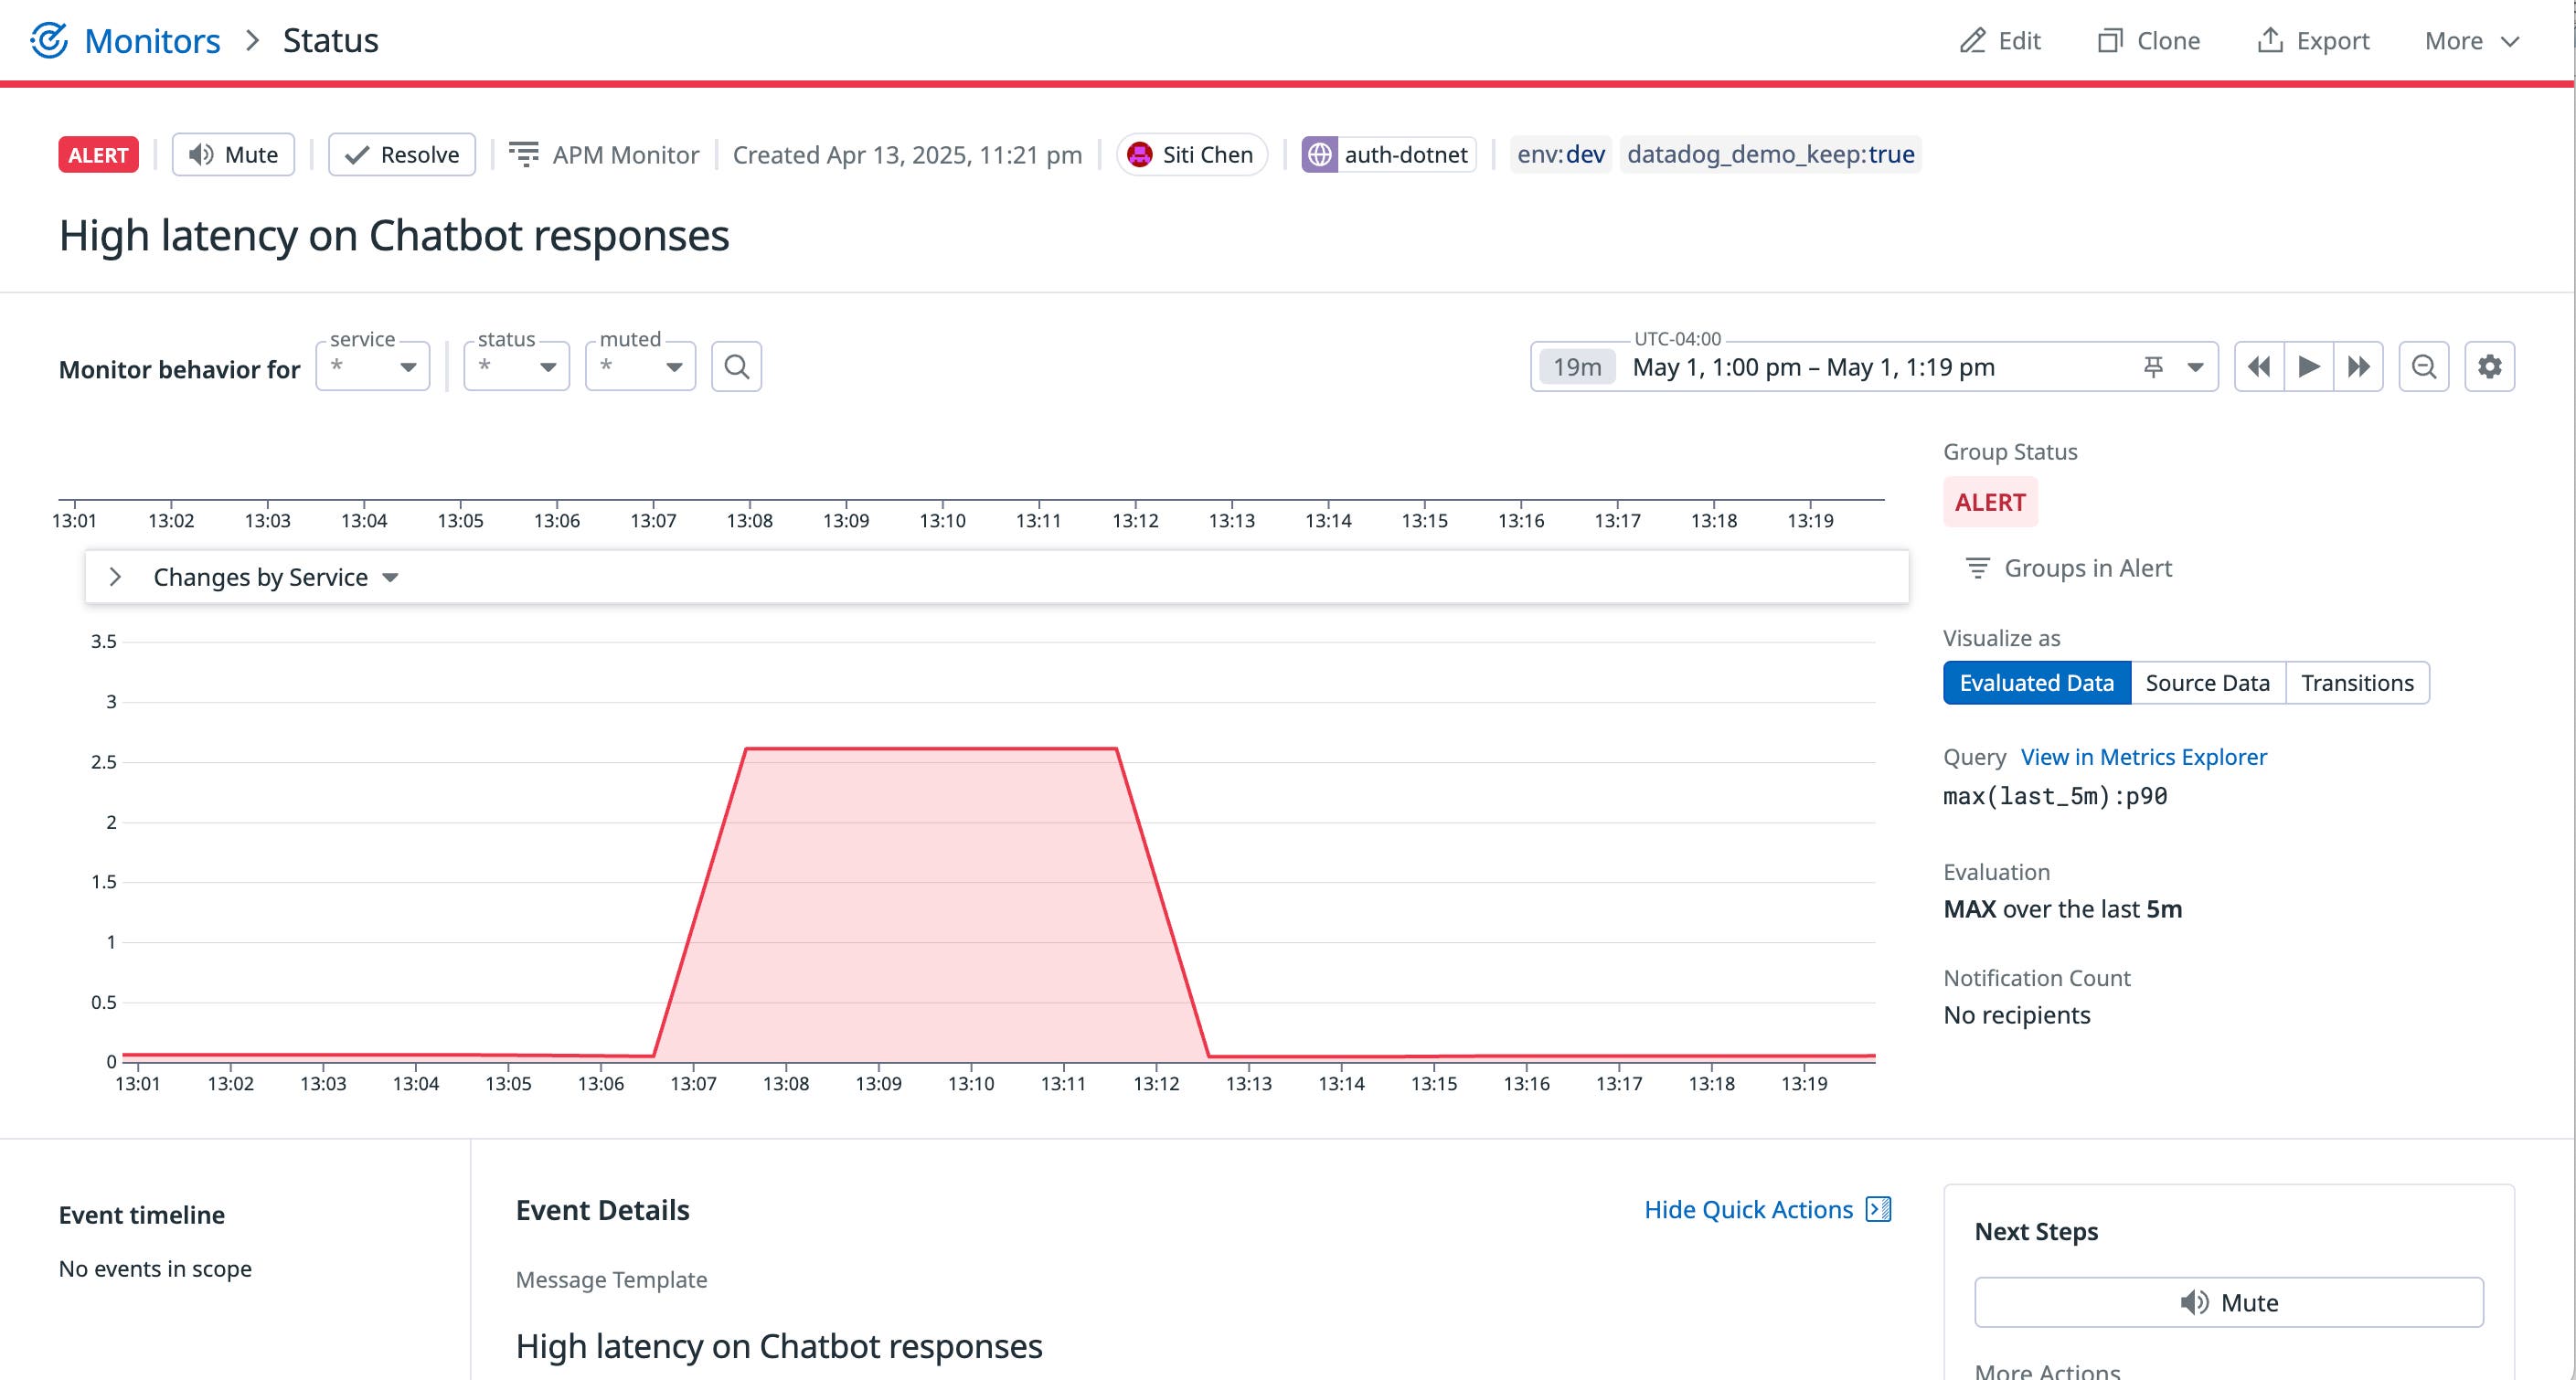
You can use Datadog LLM Observability to avoid these pitfalls and see which models are being used and in what context. Let’s say, for instance, you get alerted to a latency spike in a critical customer-facing chat assistant.

With distributed tracing, you can follow a request as it flows through your entire system—from the initial application service, through proxy and router services, to downstream model endpoints and back—in a single, end-to-end view. This end-to-end view helps you pinpoint any issues, whether it be a latency bottleneck or identifying where an unexpected behavior originates. For example, tracing might reveal that a request was routed to a larger, slower model like GPT-4, rather than a lightweight model such as Claude 3 Haiku, which is typically used for that workload. With that insight in mind, your team can adjust and optimize your routing rules or load balancing rules to prefer faster models for that feature. Such a configuration might look like the following.
routes: - match: task_type: summarization input_tokens_lt: 1000 route_to: claude-3-haiku # Fast and low-cost - match: task_type: general_chat user_priority: low route_to: gpt-3.5-turbo # Good balance of speed + performance - match: task_type: general_chat user_priority: high input_tokens_gt: 2000 route_to: gpt-4 # Use premium model only when neededAdjusting your routing rules to prioritize faster, lightweight models can help you improve your application’s performance and ensure response times remain within your SLOs.
Control LLM costs with trace-level visibility
Another major pain point for monitoring AI proxies is keeping LLM costs under control across different internal teams. AI proxies can obscure which models are being used, making it difficult to track LLM costs by application, team, or environment. Without usage breakdowns by team, application, or environment, it’s difficult to allocate costs, enforce model usage policies, or detect spending anomalies. Developers may unknowingly route traffic to premium models like GPT-4, or routing logic may shift usage toward more expensive options over time. Even small misconfigurations—like missing a usage cap—can lead to large, unexpected overages at scale.

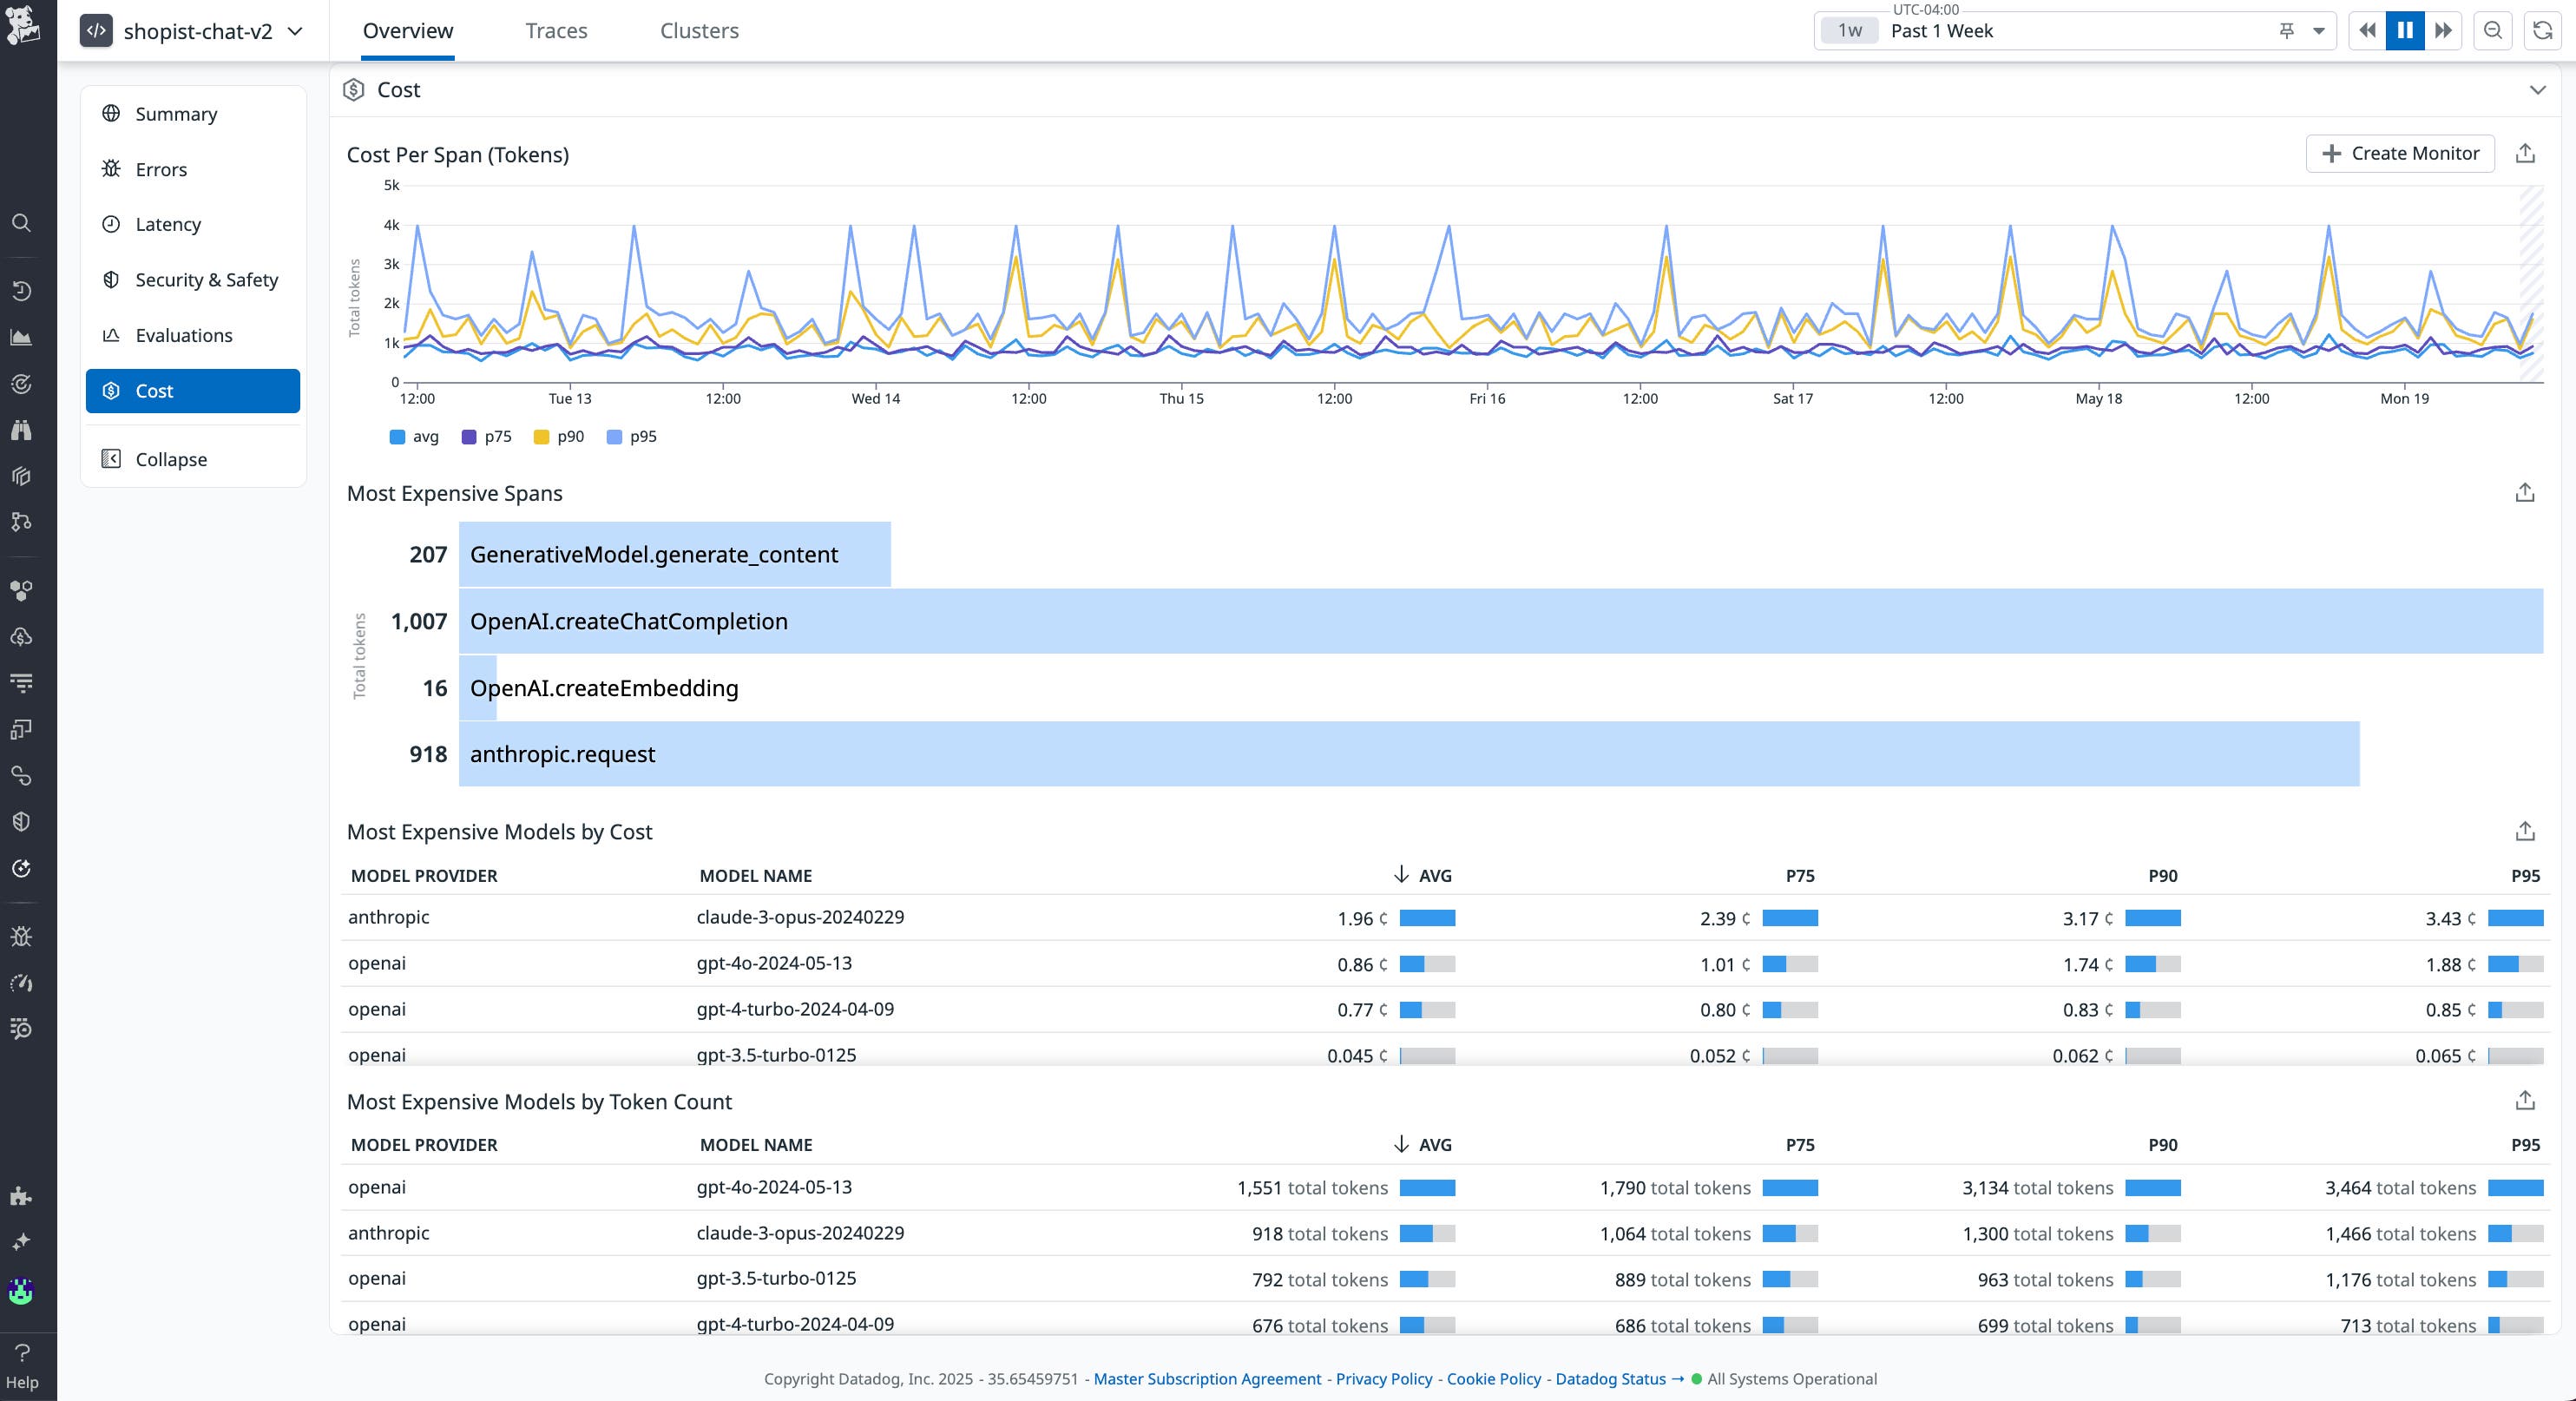
With Datadog LLM Observability, you can break down token usage and cost trends by application, team, or model. Distributed traces let you drill into specific requests to see which model was used and why—so you can quickly identify expensive behavior, fine-tune routing rules, and set usage alerts to prevent future overages.
LLM Observability also provides you with a “Cost Overview” and application-level token usage insights so that you can keep an eye on your spend, showing you total cost trends over time and breaking down usage and costs by LLM application. If costs rise unexpectedly, you can use LLM Observability to pinpoint the most expensive spans, which you can then click on to reveal the associated traces and confirm whether GPT-4 or another expensive model is being used unnecessarily. If so, you can revert the routing rule to a faster, cheaper model and set alerts to catch future regressions. Teams can also configure token usage alerts—for example, setting a “soft” quota that triggers a notification at 80% of the limit, and a “hard” quota to prevent any overage. By tying proxy behavior directly to cost data, LLM Observability makes it easy to catch and correct expensive trends early.
Monitor your AI proxies today
In this post, we looked at some challenges that come with monitoring AI proxies, including performance bottlenecks, inefficient model routing, and uncontrolled LLM costs. We also looked at how Datadog LLM Observability can help you gain end-to-end visibility into which models are being used and why, and what you can do to help control costs. For more information about LLM Observability check out our documentation here. If you’re not already using Datadog, sign up today for a 14-day free trial.


