Shanel Huang

Evan Pandya
OpenTelemetry (OTel) is emerging as the industry standard for collecting and transmitting observability data. Datadog supports several ways to send and accept OTel-native data, while also continuing to support its own native telemetry format. To provide a consistent monitoring experience, Datadog now supports using OTel-native metrics alongside Datadog-native metrics across dashboards, queries, and core visualizations in the Datadog platform. This results in a unified observability experience whether you’re sending data via OpenTelemetry, the Datadog Agent, or a combination of both, allowing teams the flexibility to adopt OTel at their own pace without disrupting their existing monitoring workflows.
In this post, we’ll explore how you can:
- View OTel-native metrics in out-of-the-box Datadog integration dashboards
- Write your own queries to monitor across Datadog and OTel data
View OTel-native metrics in out-of-the-box integration dashboards
Teams using OTel-native telemetry for integrations like Kafka, Docker, NGINX, and more can now view their data in Datadog’s out-of-the-box (OOTB) dashboards, providing the same onboarding experience as with telemetry data collected by the Datadog Agent.
The OOTB integration dashboards offer immediate visibility into system health and performance with minimal setup. They highlight the most important metrics to monitor, giving you a quick start to troubleshooting as soon as an integration is enabled. Now, with support for OTel-native formats and semantics, these dashboards make it easy for OTel-native users to use the same integration dashboards with no additional configuration or manual metrics mapping required.
For example, the “Kafka, Zookeeper and Kafka Consumer Overview” dashboard is now compatible with metrics sent from both the Datadog Agent-based Kafka integration and OTel-based sources, including kafkametricsreceiver. This makes it easier for SREs to monitor critical Kafka metrics, regardless of how Kafka telemetry is collected. With unified metric semantics, you can use a single dashboard to detect issues like rising consumer lag without needing to maintain separate queries or manually normalize metrics.
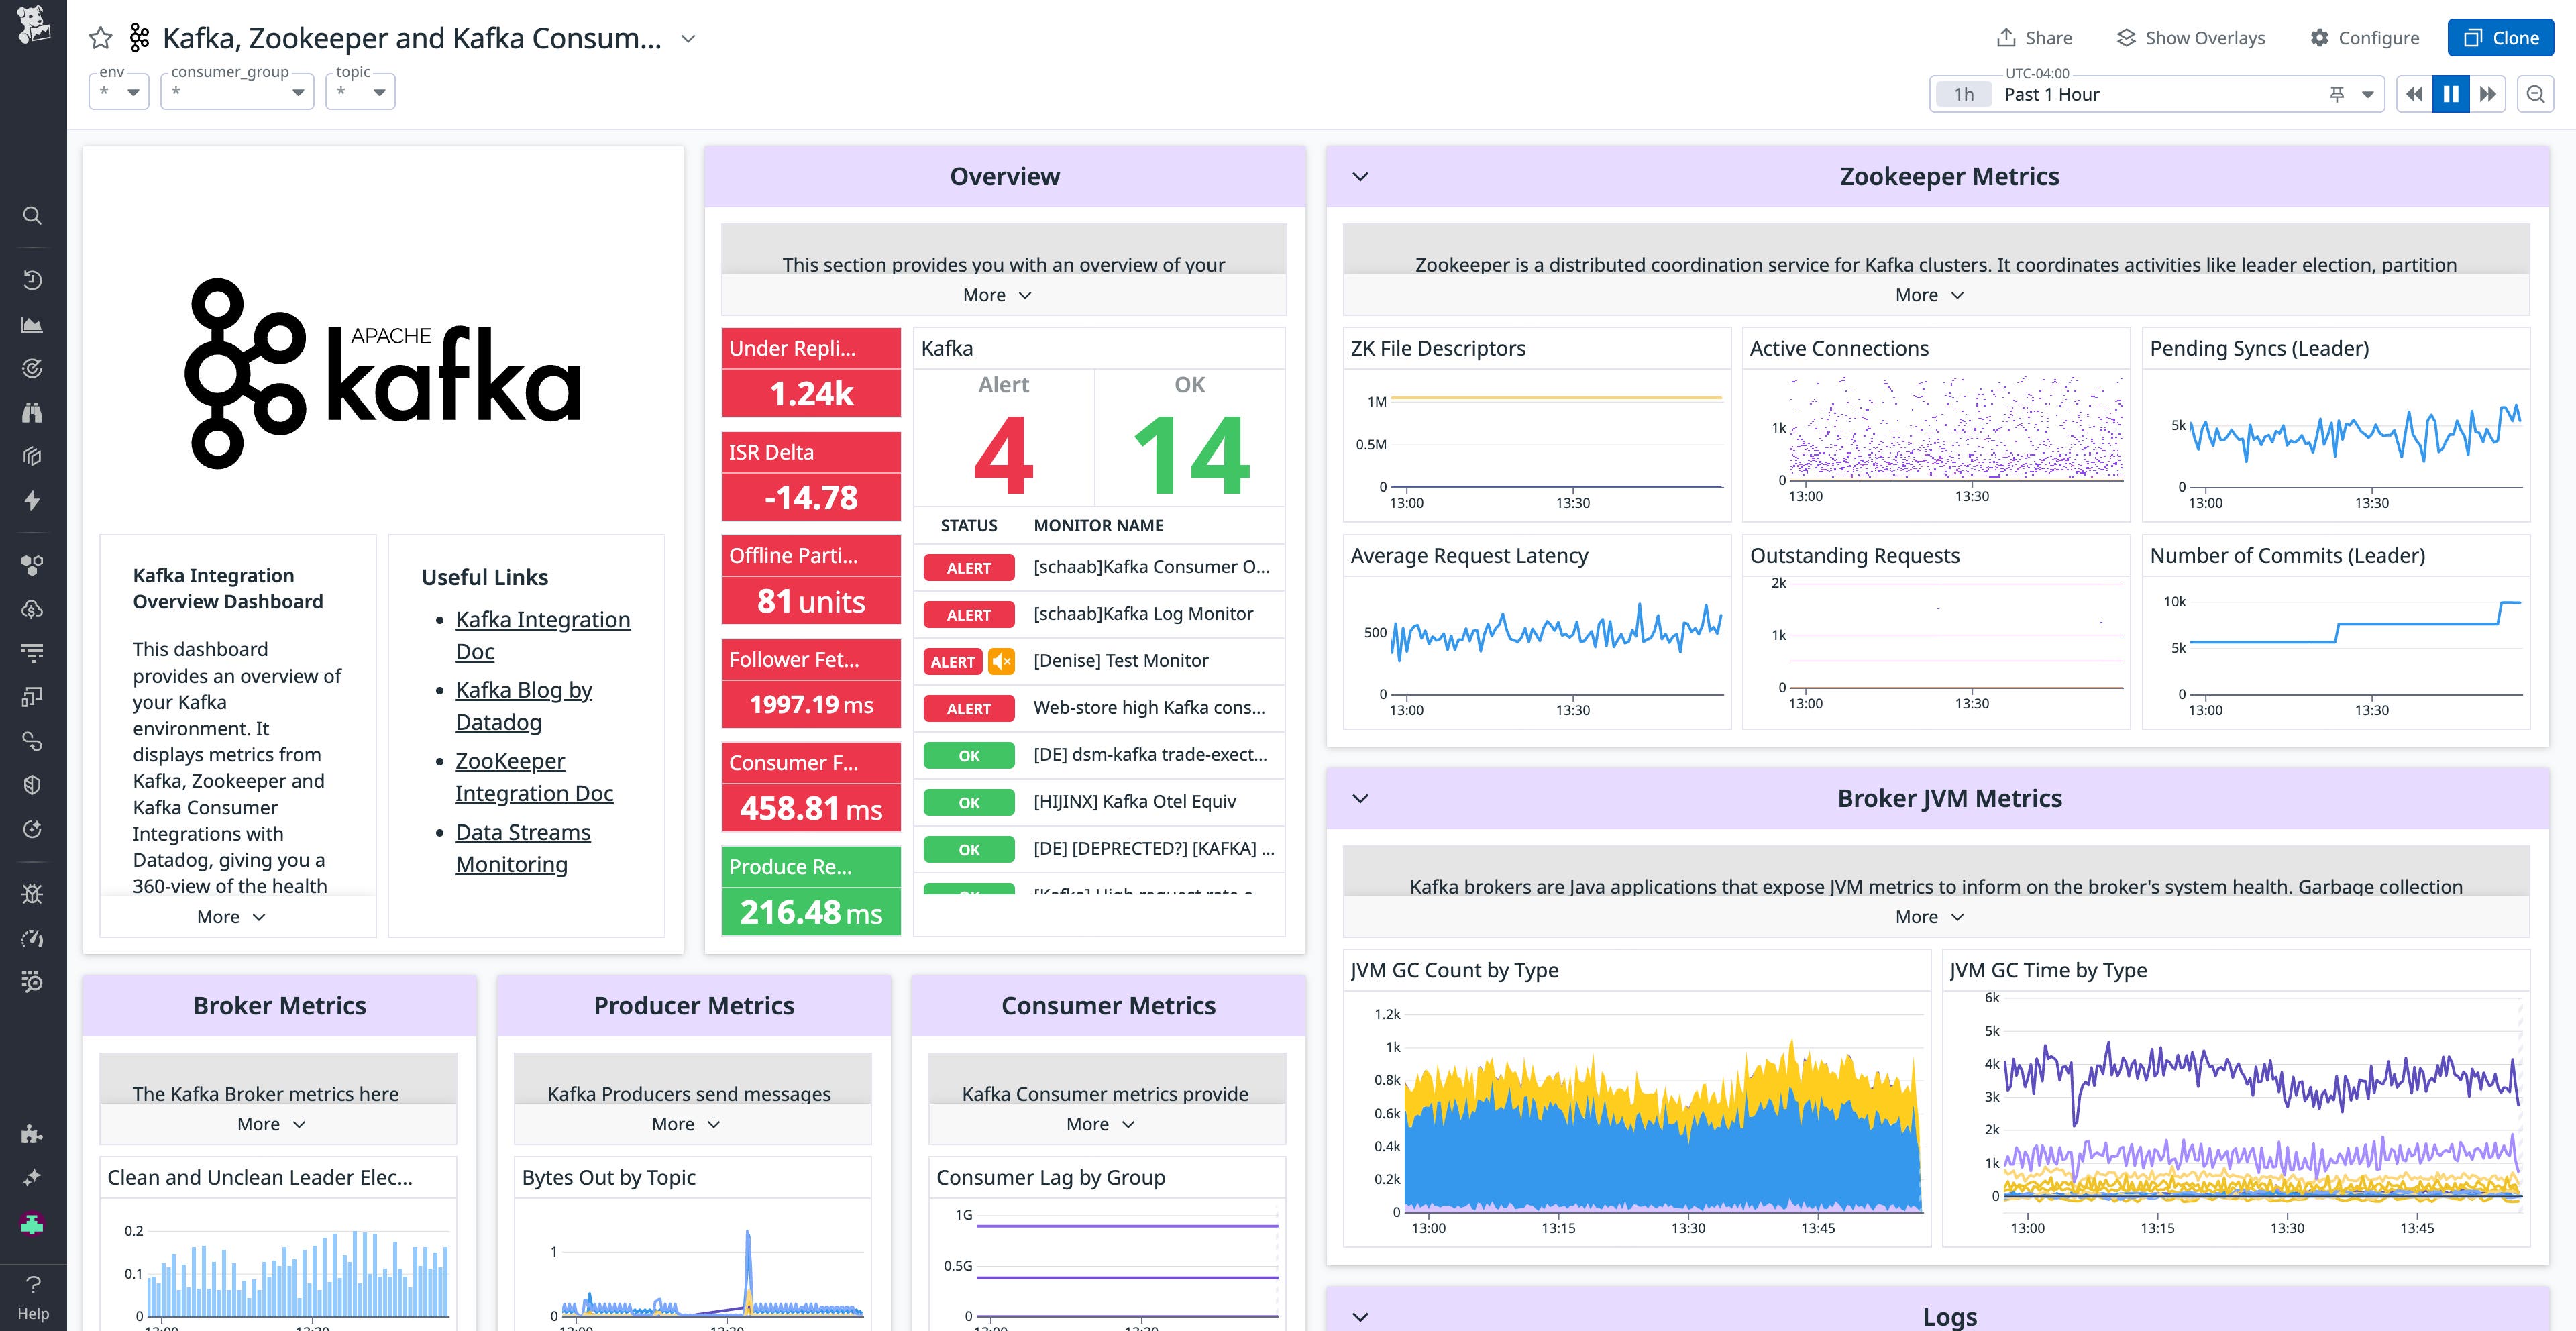
See our documentation for configuring OTel Kafka metrics. Datadog also supports dashboard compatibility for metrics sent from integrations such as Docker, MySQL, and NGINX receivers, and continues to add support for other integrations.
Query across Datadog and OTel metric semantics
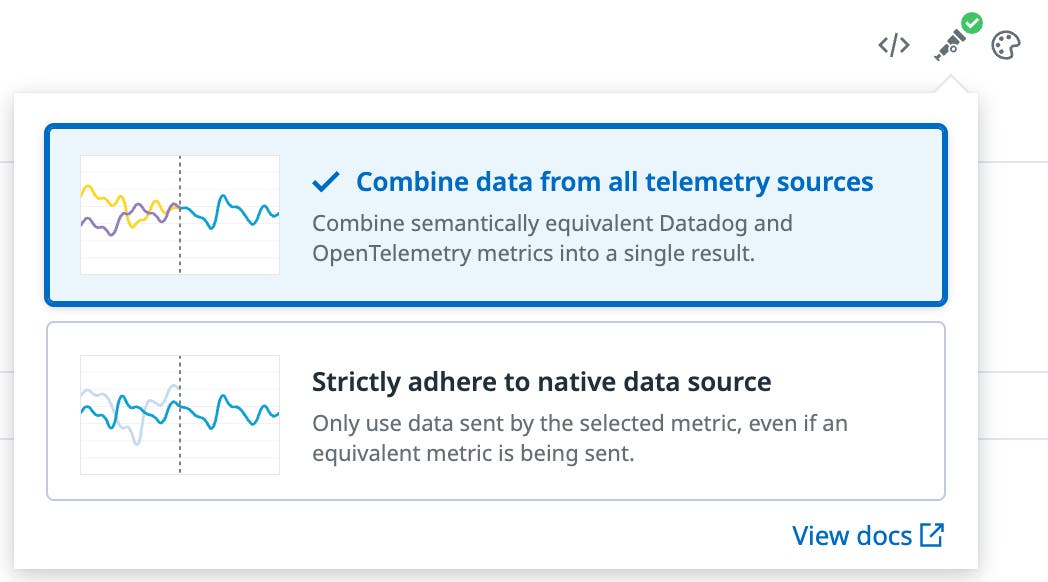
Datadog now also supports OTel-native data outside of OOTB dashboards, enabling customers with OTel and Datadog metrics in their deployments to query across both data sources with one query using the Semantic Mode selector. Within any metrics query editor in the Datadog platform, including in Metrics Explorer, dashboards, and monitors, you can easily adjust queries to “Combine data from all telemetry sources”, including OpenTelemetry.
Setting the Semantic Mode to “Combine data from all telemetry sources” automatically detects and includes equivalent metrics collected via both OTel-native and Datadog-native tooling, ensuring your queries are comprehensive and accurate with minimal configuration. Rather than renaming metrics or enforcing a single naming scheme, Datadog relates semantically equivalent metrics behind the scenes. This means you can write a single query to include relevant data from both formats without needing to manually map names or rewrite your queries, allowing you to save time and focus on more meaningful monitoring and analysis.
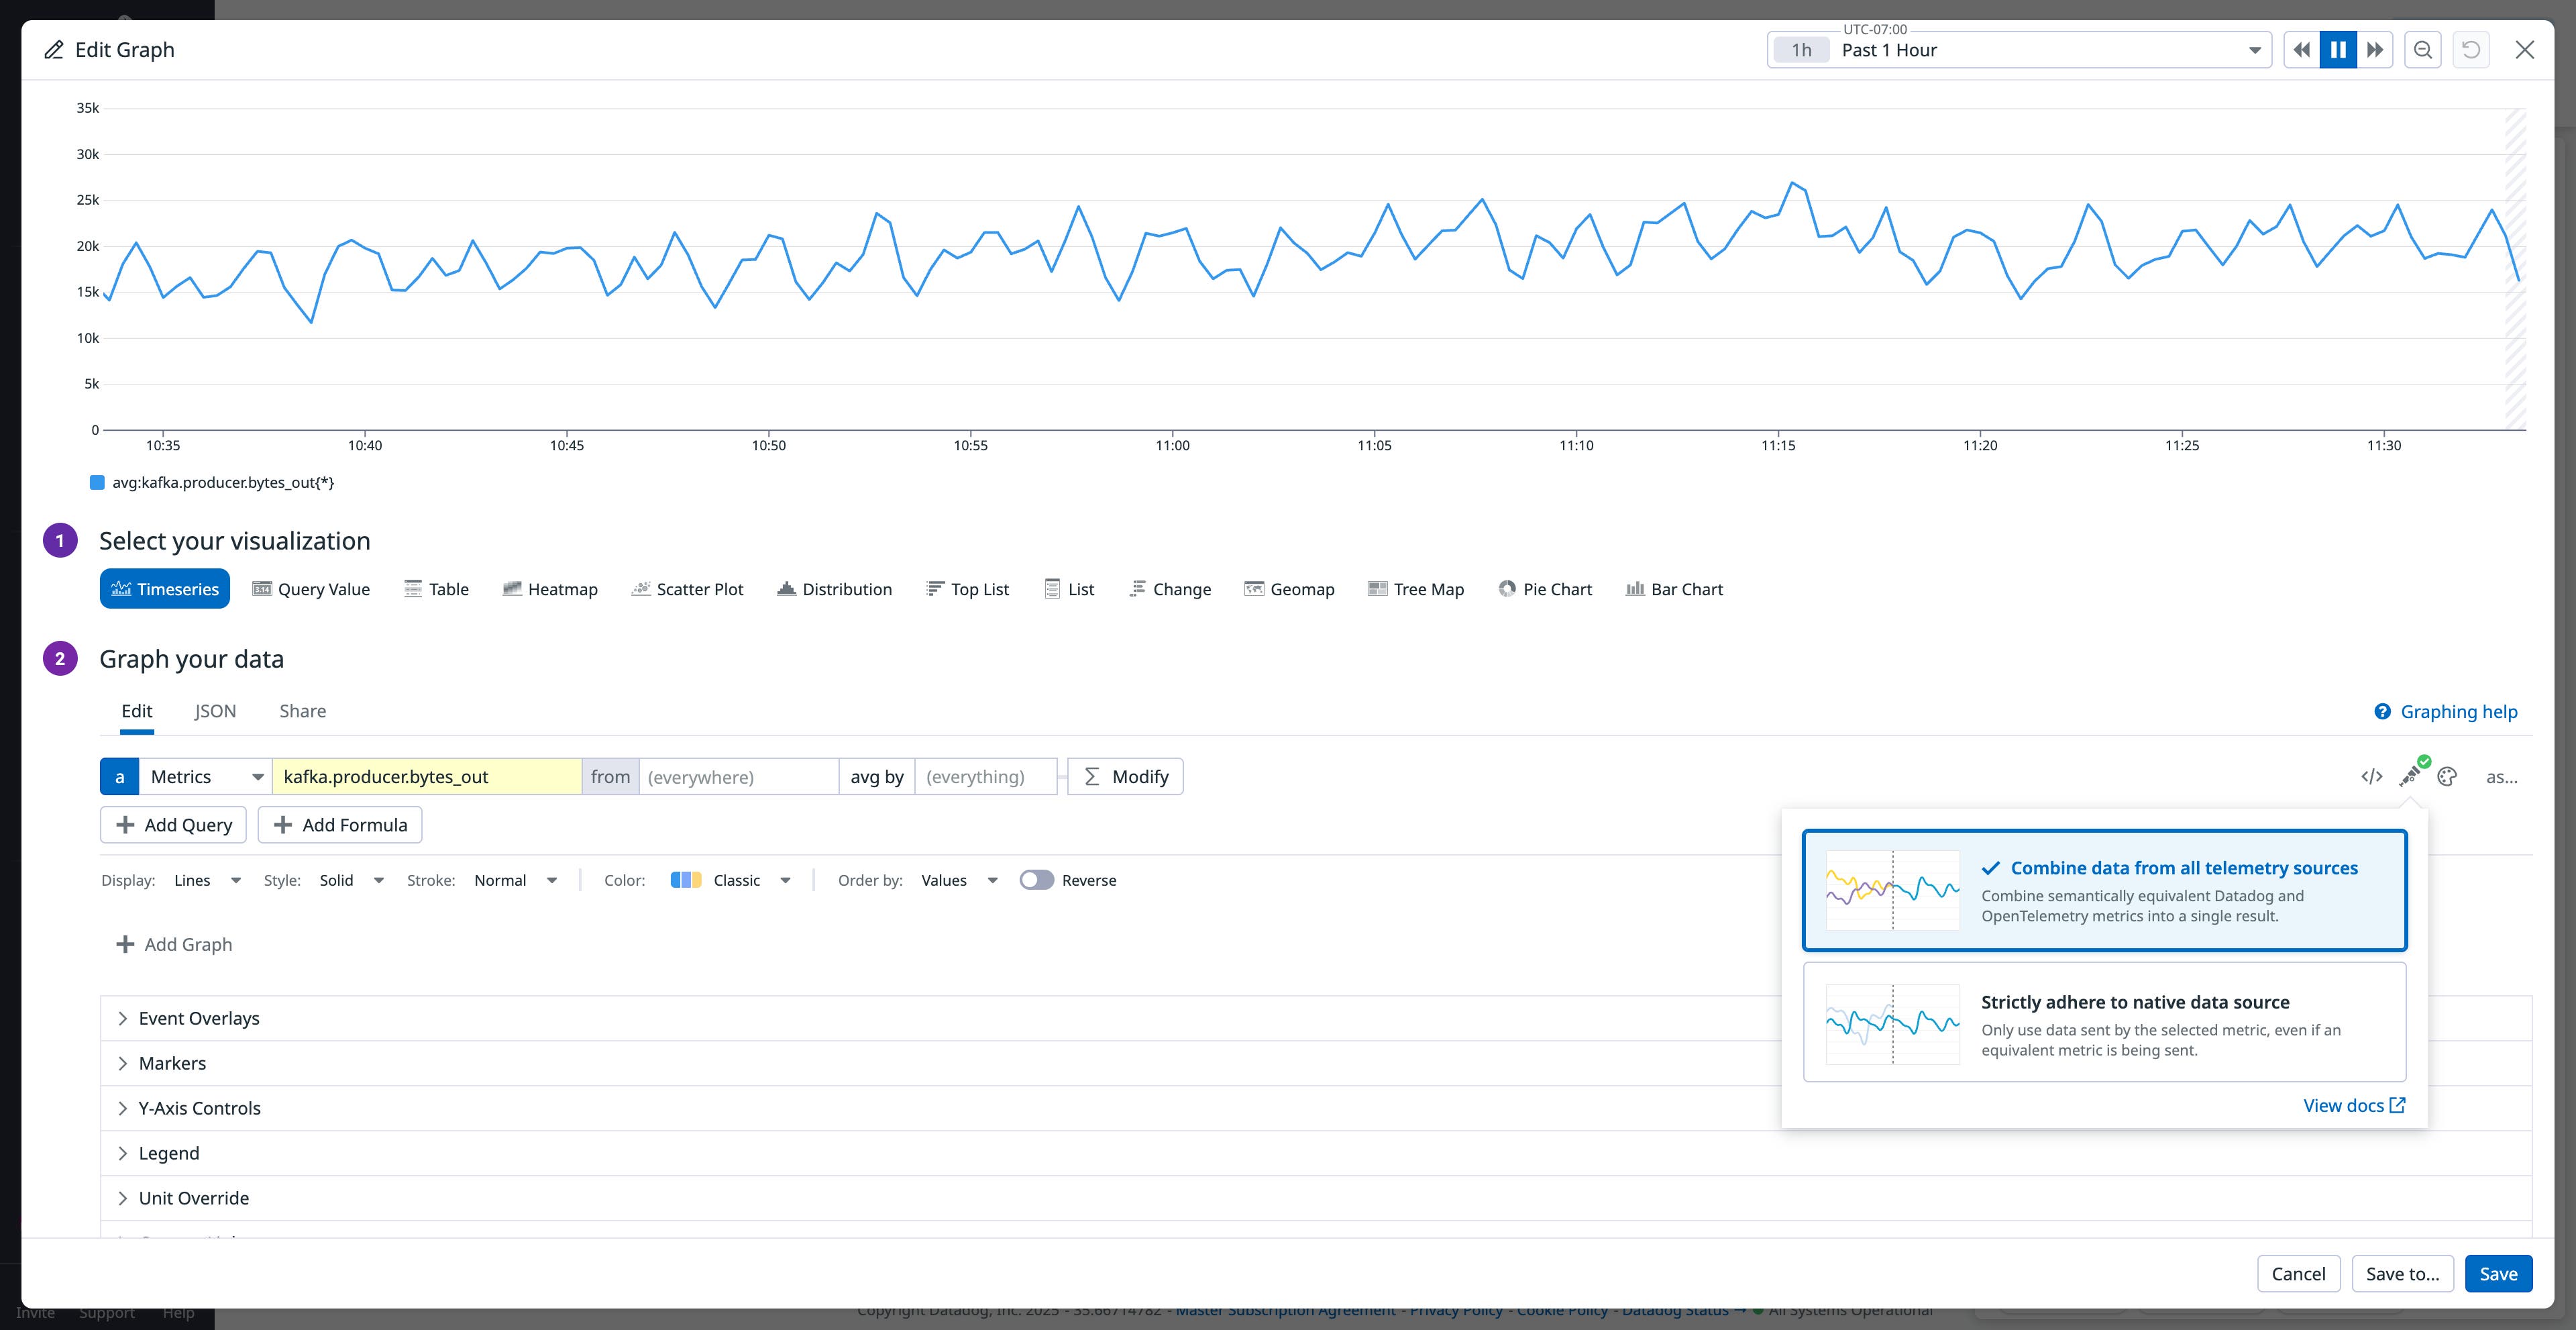
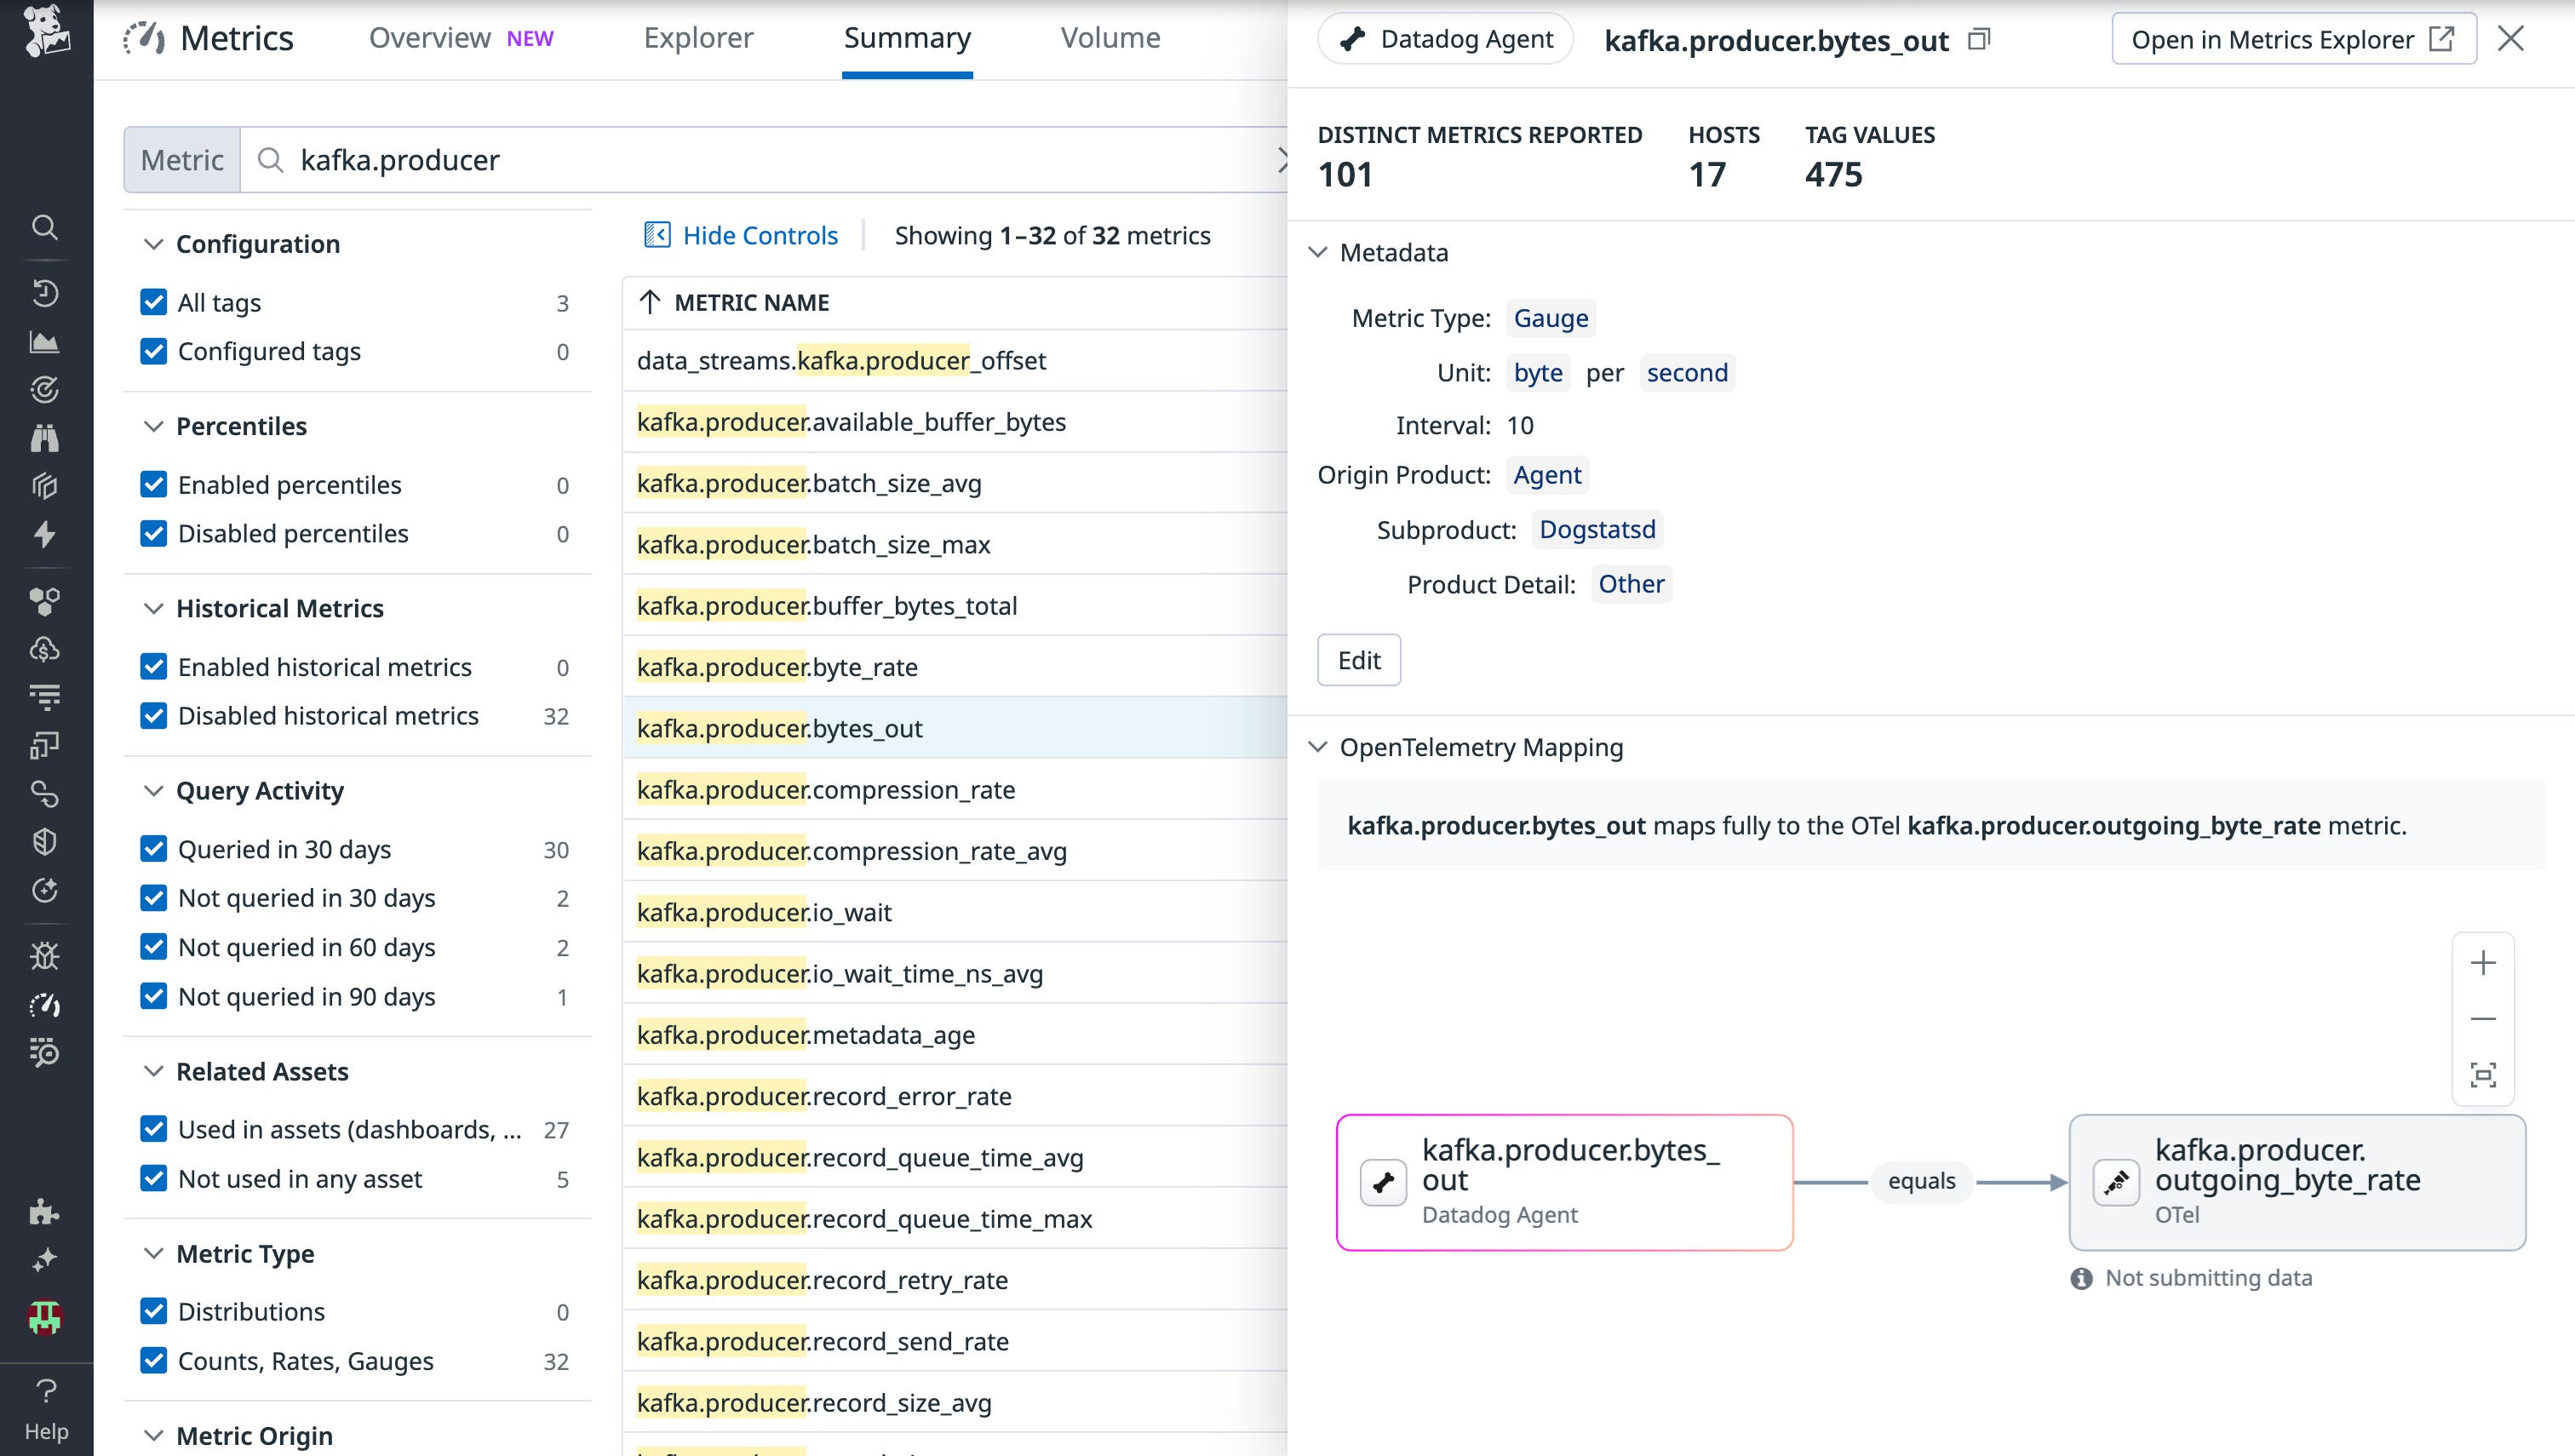
For example, both OTel and Datadog have a metric to measure the total number of bytes sent out by a Kafka producer to the Kafka brokers. However, they have different names:
- OTel-native metric: kafka.producer.outgoing_byte_rate
- Datadog Agent metric: kafka.producer.bytes_out
Selecting the Semantic Mode to combine data from all telemetry sources shows the aggregated results of both metrics across all instances of Kafka producers. Continuing the example, the following query shows the amount of data transferred from all Kafka producer hosts whether they are reporting OTel- or Datadog-native metric data.
To understand the relationship between equivalent Datadog and OTel metrics, visit the Metrics Details page of each metric within the Metrics Explorer. Here you’ll find the details of a metric and its equivalences.
Visualize your Datadog and OTel data together
With OOTB dashboard support for OTel-native data, users can easily monitor OTel-native telemetry using the same powerful dashboards available for Datadog-native data. Paired with the new Semantic Mode selector (available in Preview), users with mixed OTel and Datadog environments can write queries to aggregate, process, and visualize telemetry from both telemetry sources without any manual mapping or complex configuration. These two new capabilities enable faster insights, reduce overhead, and provide a unified observability experience across OpenTelemetry and Datadog.
For more on Datadog’s compatibility with OpenTelemetry, read our blog post on the Datadog Distribution of the OpenTelemetry Collector (DDOT), which provides an enterprise-ready, OTel-native Collector distribution that enables users to adopt OTel flexibility while taking full advantage of Datadog’s advanced monitoring and security features. And if you’re new to Datadog, get started with a 14-day free trial.


