Candace Shamieh

Shanel Huang
OpenStack is an open source cloud platform that enables customers to provision and manage compute, storage, and networking resources via web-based dashboards or APIs. OpenStack offers a range of services beyond standard infrastructure-as-a-service functionality, including orchestration, fault management, and service management components. These components help customers build, maintain, and scale high-availability applications.
As you add OpenStack components to your environment, you need extensive monitoring capabilities to detect and resolve issues efficiently. That’s why we’ve partnered with OpenStack and Rackspace Technology to expand our OpenStack Controller integration, allowing you to monitor more OpenStack components and increase visibility into your OpenStack resource deployment. In addition to Nova and Neutron, our OpenStack Controller integration now works with the Ironic, Cinder, Octavia, Keystone, and Glance services.
In this post, we’ll discuss how the OpenStack Controller integration enables you to:
Gain ample visibility into your OpenStack resource deployment
Identify connection issues and detect anomalies with service checks and alerts
Gain ample visibility into your OpenStack deployment
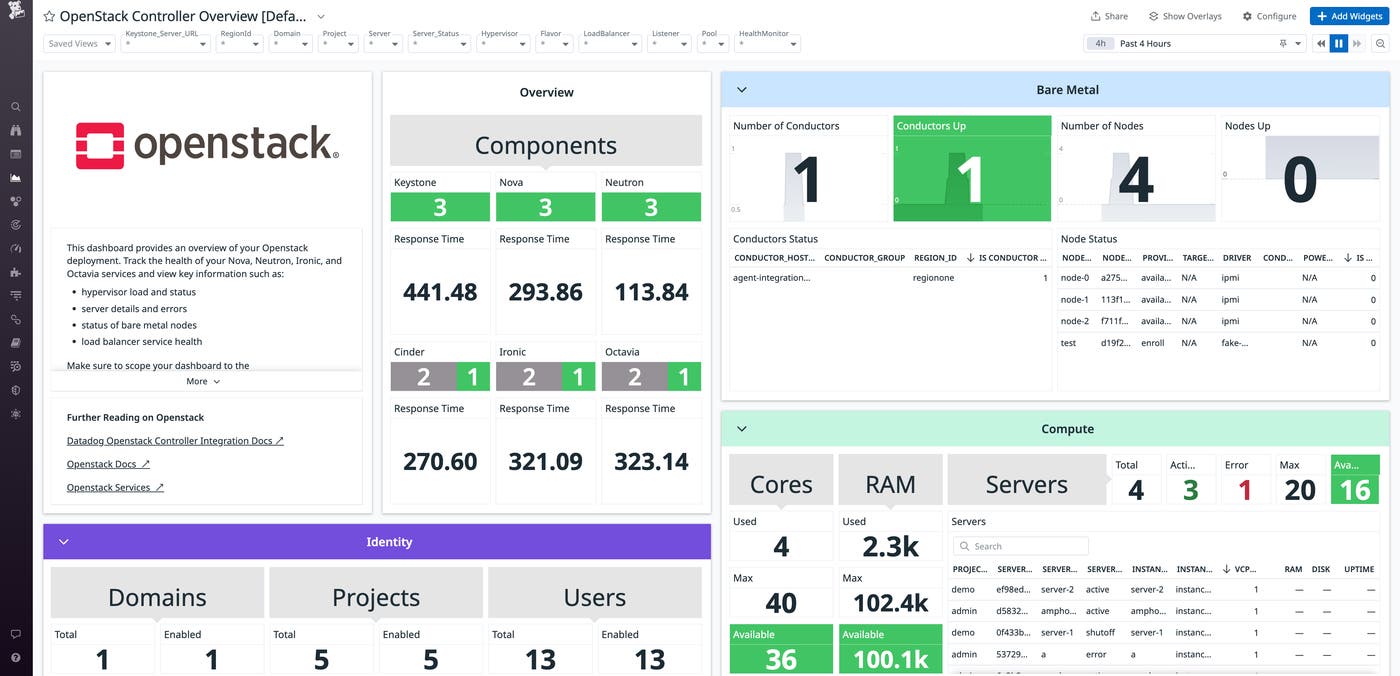
Once you’ve installed and configured the OpenStack Controller integration, you’ll automatically start collecting metrics from your OpenStack deployment. Our preconfigured OpenStack Controller Overview dashboard visualizes your metrics for a high-level overview of your deployment.

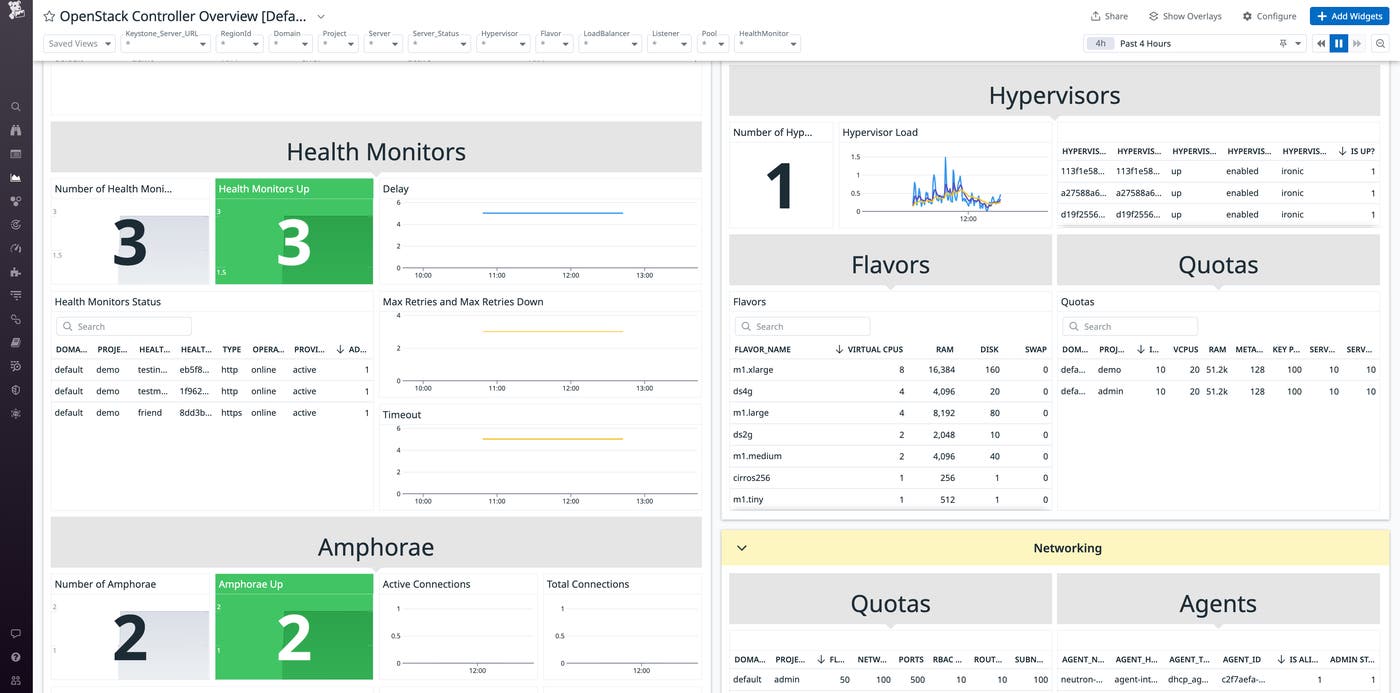
The dashboard shows the status of service checks, response times, and specific metrics regarding your OpenStack components. You can see Ironic bare metal nodes, Nova compute instances, Keystone identity resources, Octavia load balancers, Neutron agents and quotas, Cinder response times, and more.
The dashboard serves as a first point of reference for troubleshooting errors or identifying opportunities for optimization. For example, you can verify the status of your Nova service, see if any resources are in maintenance mode, review the hosts they’re running on, and pinpoint the best place to start an investigation. You can also monitor the utilization of your Ironic bare metal resources and reallocate them when needed, ensuring efficient usage and potentially reducing costs.
Identify connection issues and detect anomalies in your OpenStack deployment
Our OpenStack Controller integration contains service checks that report the health of your OpenStack components, verifying that your API endpoints, network, and hypervisors are running properly. For example, openstack.nova.hypervisor.up checks whether the host that corresponds to your hypervisor is up or down, so you can take targeted action steps to troubleshoot if an issue occurs. As referenced in the previous section, the service checks and their status results are also conveniently located on the preconfigured OpenStack Controller Overview dashboard.
You can also set up monitors directly from the dashboard that alert on your metrics or service checks, so you’re promptly notified of any unexpected changes in your deployment. If you’d like, you can add your OpenStack monitors as custom widgets to the preconfigured dashboard, consolidating the information regarding your OpenStack deployment into one centralized location. For example, if you set up a monitor that alerts you on the openstack.nova.service.up metric, you will be notified whenever a Nova service goes down, such as the nova-scheduler.

You can still leverage Datadog’s monitors and dashboard if you’re working with a managed service provider for your OpenStack deployment, like Rackspace OpenStack Private Cloud. As one of the founders of OpenStack, Rackspace is uniquely positioned to help you implement, scale, and operate OpenStack successfully. As you collaborate with Rackspace's team of experts, Datadog's OpenStack Controller integration can provide visibility into resource usage per service, enabling you to estimate costs.
Monitor your OpenStack deployment with Datadog’s integration
Datadog’s OpenStack Controller integration enables you to gain comprehensive visibility into your OpenStack deployment, including hypervisor load and status, server details, bare metal node status, and load balancer health. Monitoring your OpenStack deployment allows you to maintain service health, identify and resolve errors quickly, and optimize your environment to peak performance.
For more information, check out our documentation. If you’re using OpenStack v12 or below, check out our OpenStack integration. If you’re new to Datadog, you can get started now with a free trial.

