Jordan Obey
Senior Technical Content Writer

Alessandro Gallotta
As organizations migrate their legacy web applications from containerized or server-based deployments to serverless environments, they often run into a critical compatibility challenge. Traditional web frameworks like Flask, Express, or SpringBoot are designed to run on persistent HTTP servers, not event-driven, stateless environments like AWS Lambda. The AWS Lambda Web Adapter bridges this gap by allowing teams to run web server-based applications inside Lambda with minimal changes. This setup enables faster modernization of legacy applications and uses Lambda’s scale and cost benefits.
Although the Lambda Web Adapter makes it easier to move legacy web applications to AWS Lambda, it can obscure the request life cycle and make it harder to connect logs, traces, and metrics without additional instrumentation. Now, with Datadog’s Lambda Web Adapter integration, teams can gain full visibility into real-time metrics, traces, and logs generated by web applications that have been replatformed for serverless.
In this post, we'll show you how you can easily set up the Lambda Web Adapter integration and start collecting and visualizing key telemetry data from your Lambda-hosted web applications.
Setting up the Datadog Lambda Web Adapter integration
To instrument the Lambda Web Adapter with Datadog, start by including both the Datadog Lambda Extension and the Web Adapter binary in your Lambda function package. Next, configure the necessary environment variables, including your Datadog API key, service name, and tracing settings. Be sure to set AWS_LWA_LAMBDA_RUNTIME_API_PROXY so the Datadog extension can intercept requests before they reach the adapter. And, if you're using APM, we also recommend excluding readiness probes—such as GET requests to the root path—from tracing to keep your data clean and focused. For detailed setup instructions, refer to our Lambda Web Adapter documentation.
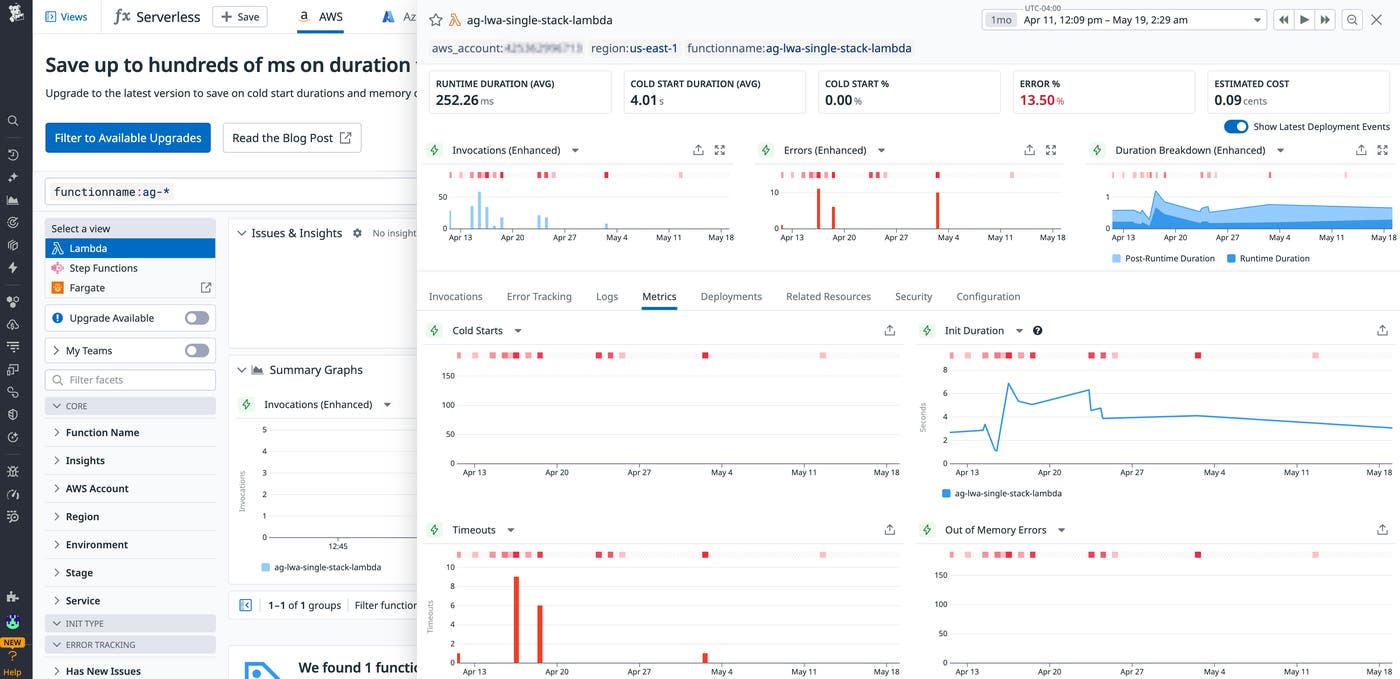
Once the integration is set up, Datadog will automatically begin to capture telemetry data from your application, including end-to-end traces, core metrics such as invocation counts and error rates, and logs from both the Lambda execution environment and your web application. This comprehensive visibility allows you to monitor performance, detect issues, and troubleshoot faster without needing to modify your application code.

Full Lambda visibility with Datadog Serverless Monitoring
By integrating the Lambda Web Adapter with Datadog, you extend the same comprehensive visibility that Datadog Serverless Monitoring already provides for standard AWS Lambda functions, now with full support for web applications running through the Lambda Web Adapter.
In addition to core Lambda metrics, Datadog also captures enhanced metrics like cold start durations, memory usage, and estimated costs, giving you deeper insight into how your application is performing in a serverless environment.
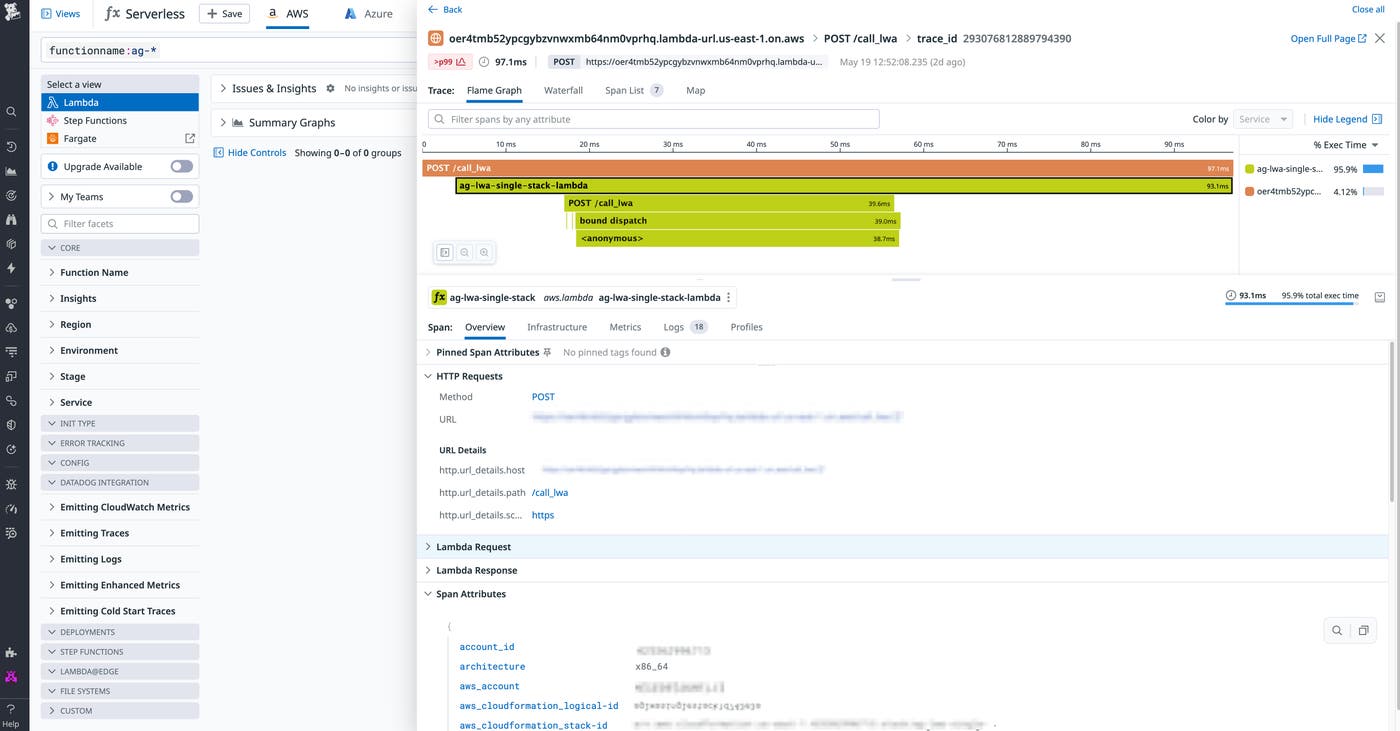
Datadog also automatically traces requests as they move through your infrastructure. These traces are available in the Serverless view, making it easy to identify slowdowns, bottlenecks, or failed requests without any manual instrumentation.

Datadog collects logs from both the Lambda execution environment and your application’s web server, and correlates those logs with traces and metrics, giving you a unified view of runtime activity, request details, and application errors. This makes it easier to troubleshoot issues quickly and confidently.
Start monitoring Lambda-hosted web applications today
In this post, we looked at how the AWS Lambda Web Adapter helps teams run traditional web applications in a serverless environment and how Datadog’s native integration brings full observability to these workloads.
By capturing and correlating metrics, traces, and logs out-of-the-box, Datadog makes it easy to monitor performance, detect issues, and speed up troubleshooting. Whether you're migrating a legacy application or building a new one, Datadog ensures you have visibility into your Lambda-hosted workloads. Check out our documentation on Serverless Monitoring for AWS Lambda for more information.
If you're not already using Datadog, sign up today for a 14-day free trial.

