Mallory Mooney
Firewall systems are critical for protecting your network and devices from unauthorized traffic. There are several types of firewalls that you can deploy for your environment via hardware, software, or the cloud—and they all typically fall under one of two categories: network-based or host-based. Network-based firewalls monitor and filter traffic to and from your network, whereas host-based firewalls manage traffic to and from a specific host, such as a laptop.
Regardless of their type, firewalls can be configured to log valuable information about any and all network traffic in an environment, including operational events in the firewall itself. This enables you to monitor your network and devices not only for signs of malicious activity but also for network performance and configuration issues. In this guide, we’ll look at key firewall logs for surfacing these issues as well as how Datadog can help you collect and monitor them efficiently.
But first, we’ll briefly look at some of the data points that firewalls capture in their logs, which can help you determine the type of traffic in your environment.
Understanding your firewall logs
Firewall systems log data about network traffic based on their standard configuration or your custom rules. While there may be slight variations in what is logged, most firewall systems typically include the following data at a minimum:
- Timestamp: The year, month, day, and local time when a request was received (e.g., “2023-03-08T06:34:36.618-08:00”)
- Action: The operation that the firewall executed on the request, such as ALLOW, DENY, or DROP
- Source and destination IPs: The IP addresses of the source and destination hosts involved in the request
- Source and destination ports: The port numbers of the source and destination hosts involved in the request
- Protocol: The communication protocol that was used for the request, such as TCP, UDP, or ICMP
These data points provide a baseline for determining who is in your network, which resources they want to interact with, and how they are accessing them—we’ll look at a few examples of key firewall logs to monitor in more detail later.
Host-based firewalls, such as Windows Firewall, are critical for monitoring traffic between your local network and the public internet. If you deploy cloud applications, which expand the perimeters of your environment’s network, you will need additional visibility into traffic among all of your underlying cloud resources in order to surface performance issues and threats. Logs generated by a cloud firewall, such as AWS Network Firewall, Azure Firewall, and Google Cloud Firewall, often include other types of information about your cloud environment. For example, AWS Network Firewall captures the availability zone in which it generated a log, which gives you a starting point for investigating activity in large-scale environments.
Key firewall logs to monitor
Regardless of which firewall systems you use for your environment, it’s important to know how to effectively monitor and interpret their logs. For example, a single log entry may not be enough to uncover a performance issue or security threat, whereas examining a group of logs together can reveal traffic patterns that help you understand if and how your resources are being targeted by a malicious host. We’ll take a look at a few examples next.
Port scans on your network
Attackers often attempt to find vulnerable services by using network discovery techniques such as port scanning, which scans a targeted network for open ports. You can detect this kind of activity by looking for a series of requests to a wide range of ports for a single IP address, as seen in the following AWS Network Firewall logs:
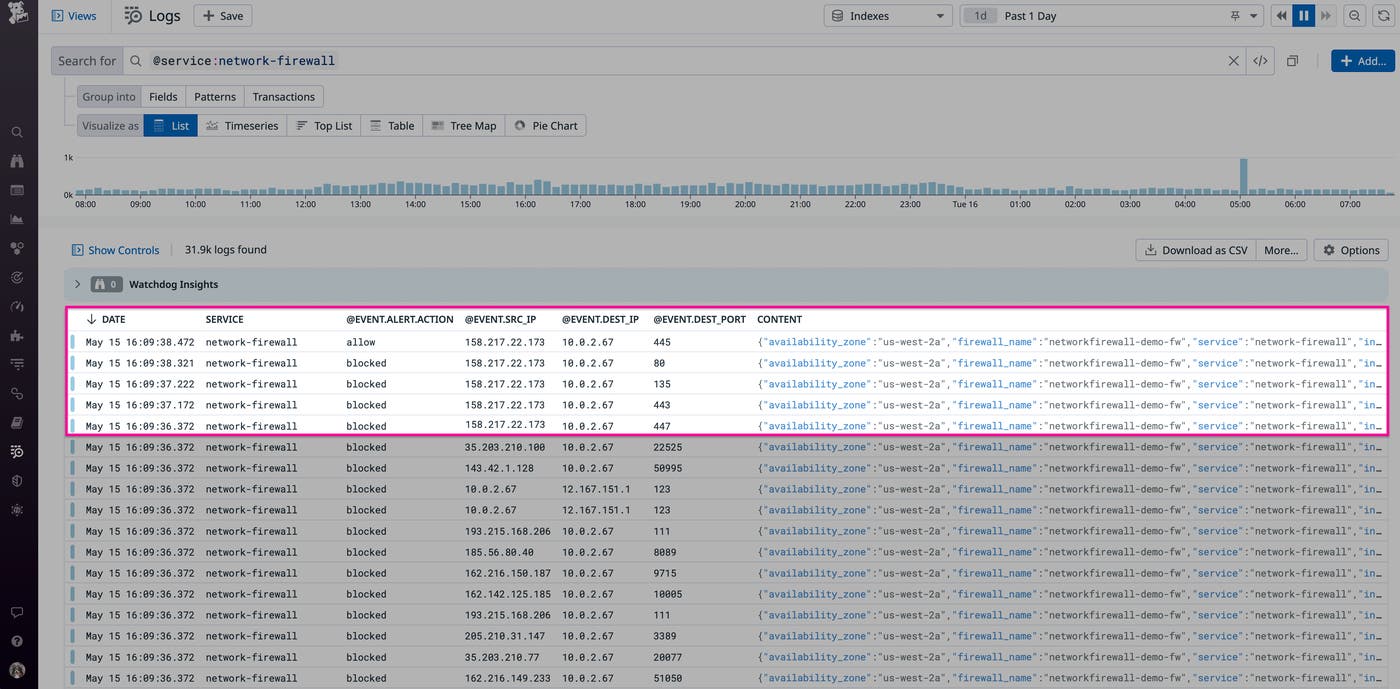
In the preceding example, you can see that an external host with the IP address 158.217.22.173 attempted to connect to multiple ports for a single, local IP address within a short period of time. The firewall denied the first four attempts but not the final one, which indicates that the external host ultimately found an available port. Upon discovering this, you could configure your firewall to immediately block traffic from this host and then investigate further to determine if the activity is malicious.
Inbound connections from external sources
Monitoring for signs of allowed, inbound traffic from external sources can help you determine if your firewall rules are configured correctly or if they are exposing a gap in your network, such as an open port. Let’s look at the final log from our previous example:
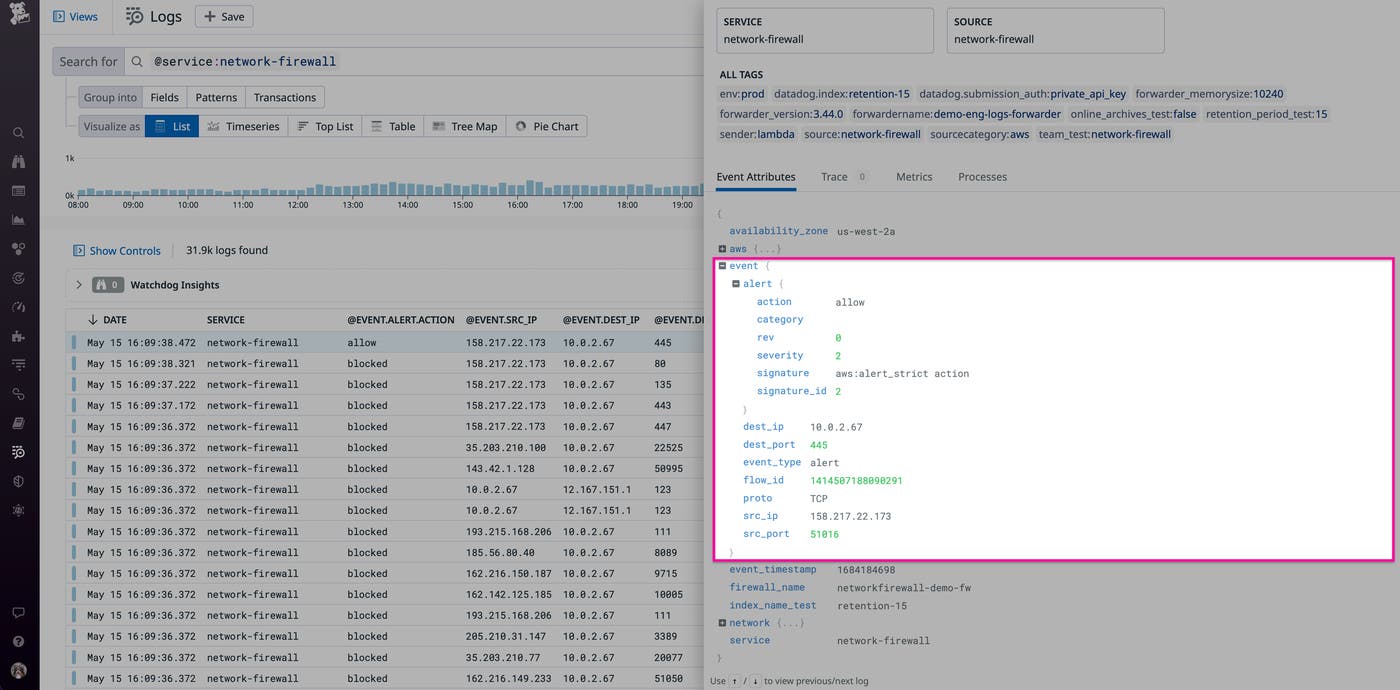
This log shows that the firewall allowed an external host with the IP address 158.217.22.173 to send TCP traffic to a local one with the IP address 192.168.2.48 using port 445. External traffic to this port, which is used for network file sharing, isn’t typical and could indicate that a malicious host is communicating with one of your local machines. If you identify an issue, you can configure your firewall to block requests from any suspicious sources.
Outbound connections to external sources
Just like with inbound traffic, it’s important to monitor for patterns in traffic leaving your network. Most outbound connections, such as those that occur when employees visit a trusted website, are a typical part of your teams’ day-to-day workflows. But some outbound traffic can also signify the initial stages of an attack or other prohibited activity like data exfiltration, so it’s helpful to know what patterns to look for.
For example, malware infections often start with users unknowingly downloading malicious software onto their machines via an outbound connection. Once installed, some malware will routinely communicate with an external command-and-control (C2) server to receive updates, exfiltrate data, and more. You can detect this kind of activity in your logs by looking for a single, local IP address that is making multiple calls to an external, untrusted host, as seen in the following example:
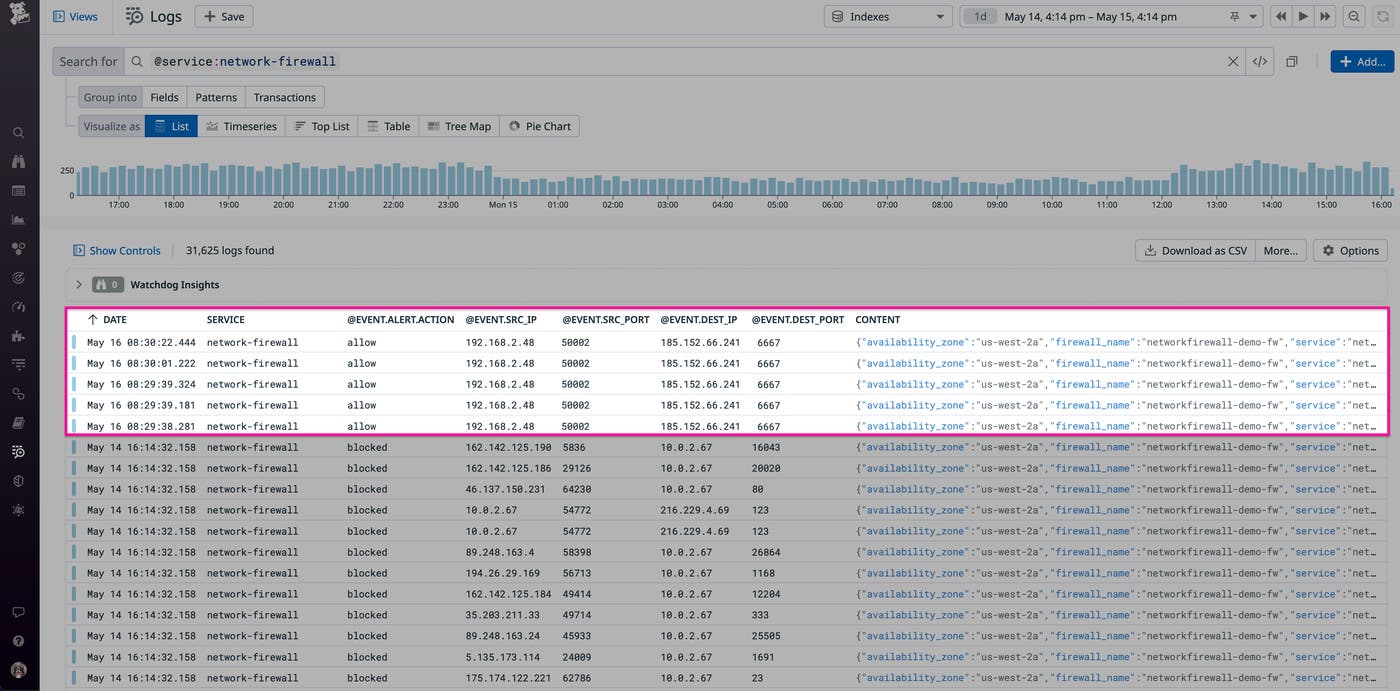
In this case, the firewall allowed a local host to communicate with an external host via TCP port 6667, which is commonly used for Internet Relay Chat (IRC) networks. This protocol is also common in malware operations, such as communication between a local host and a C2 server. You can cross-reference the destination IP address with a threat intelligence list to determine if it is a known malicious source. If so, you can update your firewall to block all outbound traffic to it.
Changes to firewall configurations or rules
Monitoring the general state of your firewall is also critical to detecting threats. Attackers may attempt to modify or completely disable firewall systems in order to bypass network restrictions. Disabling a firewall enables them to open up your network to additional threats, such as C2 communications. This kind of activity is often captured in a firewall’s operational event logs instead of its standard traffic logs. To spot suspicious changes to a firewall’s configuration, you can look for events that indicate that an existing traffic rule has been modified or that a new firewall rule or policy was created. Most cloud platforms also capture this activity in their audit logs.
Next, we’ll look at how you can use Datadog to collect and analyze all of your firewall logs in one place, which makes it easier to identify legitimate threats in your environment.
Forward logs to Datadog for monitoring
While your firewall logs provide a wealth of information for monitoring network traffic, your environment can generate a large volume of them at any given time. This makes it more difficult to find the right logs during an investigation. Aggregating your logs into a centralized log management tool can help you cut through the noise and fine-tune your monitoring workflows.
Datadog provides turn-key integrations for the following network- and host-based firewall systems:
- Palo Alto Networks Firewall
- AWS Network Firewall
- Amazon Web Application Firewall
- Microsoft Azure Firewall
You can also configure Datadog and its Agent to collect logs directly from a host or an external server. For example, you can deploy the Agent directly onto a Windows machine to collect logs from Windows Firewall, which are typically stored at %SystemRoot%\System32\LogFiles\Firewall\Pfirewall.log. For network-based firewall systems, you can configure them to forward logs to an external syslog server, then deploy the Datadog Agent to collect them. Check out our documentation for details about configuring logs collection generally as well as for specific systems like Palo Alto.
Next, we’ll look at how you can use Datadog’s advanced filtering, analysis, and threat detection capabilities to get the most out of your logs.
Maximize visibility into firewall traffic
Once the Agent is collecting your firewall logs, Datadog can help you fine-tune your monitoring workflows. This ensures that you can efficiently manage the cost of collecting logs without sacrificing the ability to surface significant trends in network activity, such as in the key firewall logs mentioned earlier. Datadog provides several capabilities for managing your logs monitoring, including:
- Log-based metrics and Pattern Inspector for visualizing key trends
- Cloud SIEM for automatic threat detection
- Flex Logs for forensic analysis
- Exclusion filters for controlling log volume
We’ll look at how you can use each of these capabilities for your firewall logs in more detail next.
Identify trends in firewall activity with the Pattern Inspector and log-based metrics
As previously mentioned, identifying trends in firewall activity is a key part of protecting your environment from threats. A group of firewall logs can provide insights into an attack, such as its path across your network or the attacker’s technique. But surfacing patterns from millions of firewall logs can be difficult. For example, identifying unauthorized port scans requires visibility into which IP addresses are executing the scans as well as the hosts they are targeting—but this can be hard to discern without the right monitoring tool.
You can automatically find common threads in your firewall logs by using the Pattern Inspector, which provides a visual breakdown of patterns in logs based on your search query. In the following example screenshot, Datadog identified multiple requests from a single IP address to port 443 on a single host:
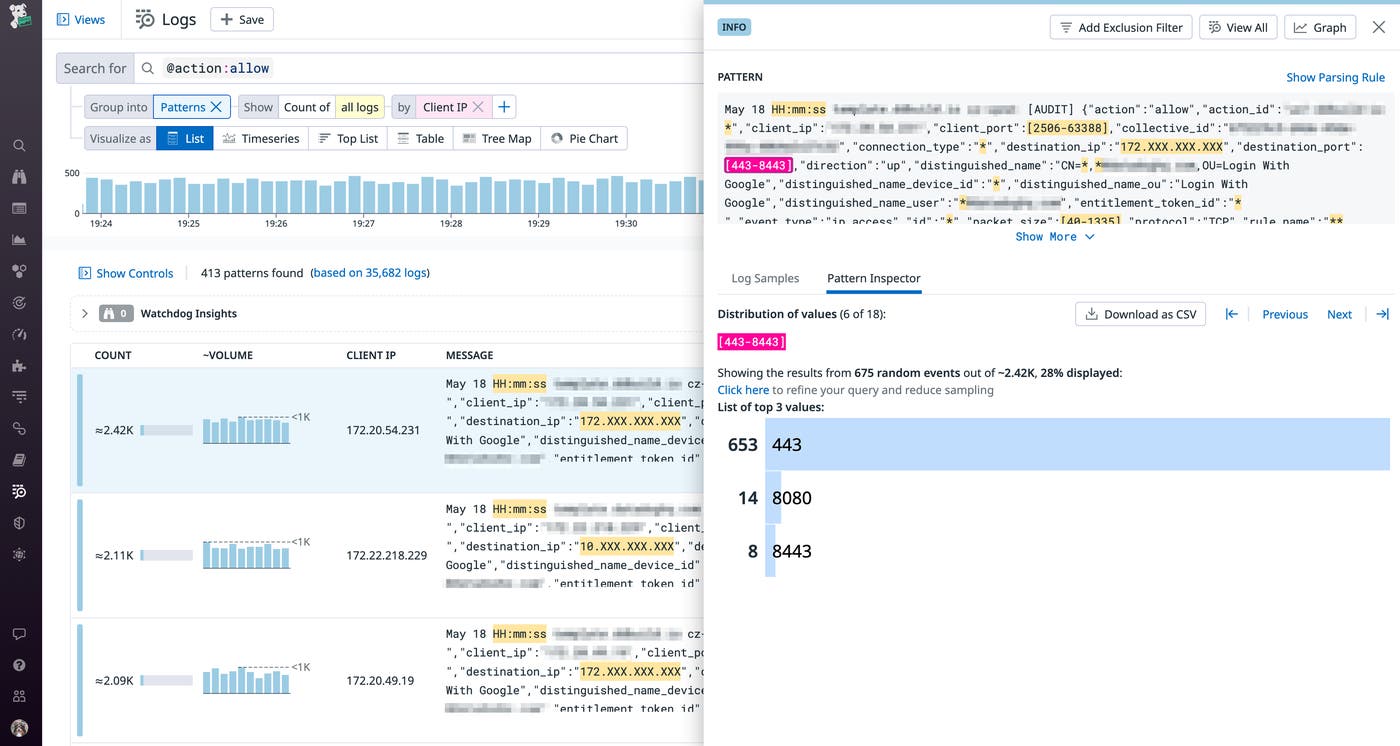
You can take this visualization a step further by creating log-based metrics, which help you monitor network activity over time, create alerts, and detect anomalies. For example, you can create a new metric for the number of denied connections per source IP address, port, or protocol to surface threats like brute force attacks.
Surface suspicious activity with Cloud SIEM Threat Detection
Even after you’ve fine-tuned log collection and created metrics for monitoring key trends in network traffic, you still need to be able to proactively detect threats. SIEM detection tools analyze logs for suspicious activity using industry-standard threat intelligence lists. You can use Datadog Cloud SIEM to create detection rules that focus on network trends in your environment, including the following:
- Anomalies in traffic for network firewalls, such as multiple subsequent dropped requests from a single IP address
- Inbound connections to a specific service from an external host
- Outbound connections to a specific geographic region or known malicious IP address
- Interruptions to inbound firewall traffic or log generation
Datadog Cloud SIEM also includes built-in detection rules for flagging suspicious activity on your firewalls, such as when a Google Compute Engine firewall rule is modified or when a Windows Firewall is disabled. The following screenshot shows the configuration for flagging logs that contain event ID 4950, which indicates that a Windows Firewall setting was changed:
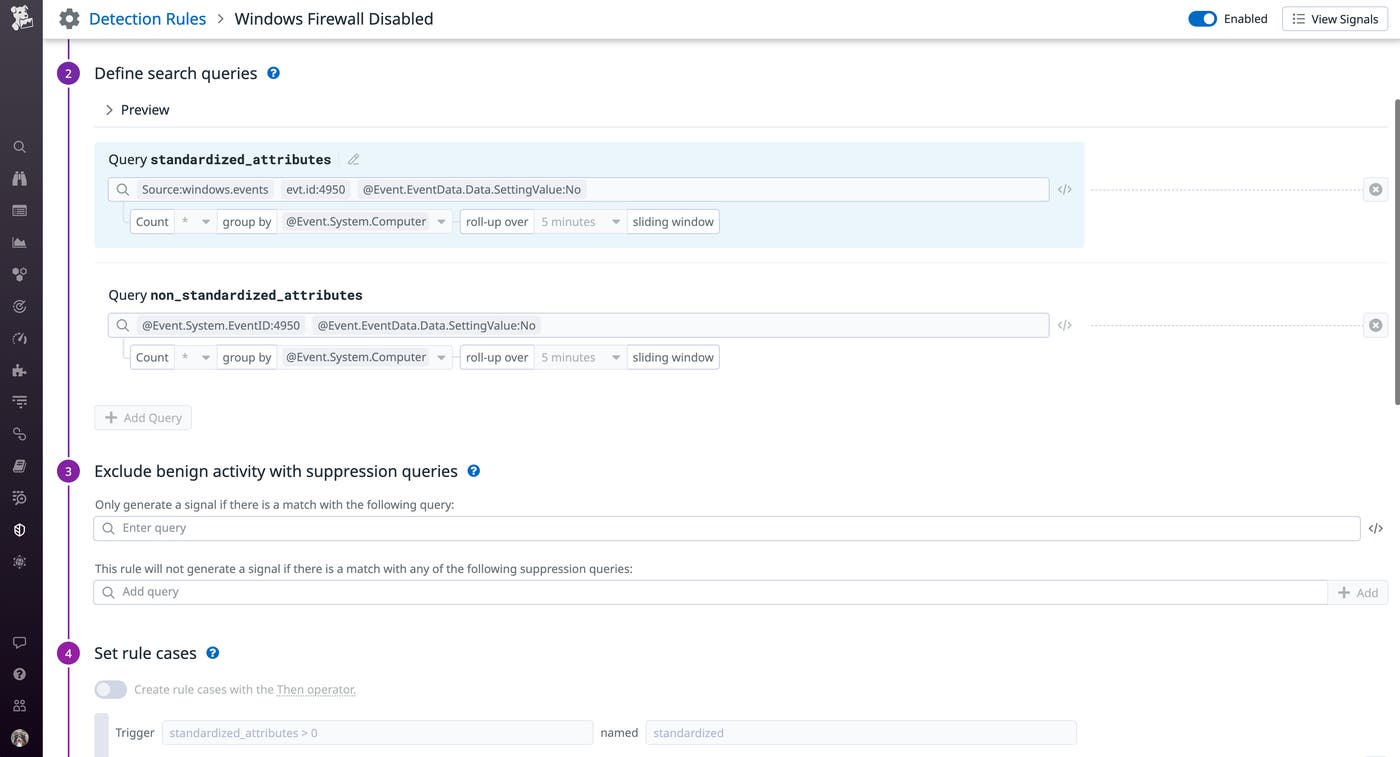
When Datadog finds a log that matches one of your rules, it automatically generates a Security Signal that provides more context for the activity. If you determine the activity to be unauthorized, you can update your firewalls accordingly. For example, you can leverage Datadog’s in-app WAF to quickly block unauthorized IP addresses directly from the generated signal. This capability enables you to proactively mitigate suspicious activity before it turns into a security incident.
Retain logs for forensic analysis with Flex Logs
In addition to managing logging costs, you need to ensure that you’re able to efficiently investigate malicious activity. After an incident, finding the right breadcrumb trail from suspicious IP addresses is critical for determining when malicious actors operating from these addresses entered your network and which resources they attempted to access. Once your firewall logs are flowing into Datadog, you can use Flex Logs to retain them for analysis for up to 15 months.
For example, you might want to use Flex Logs to configure an index for long-term retention of all AWS Network Firewall logs from your production environment. In the event of a modification to a firewall endpoint, for example, you could then use that index to query a history of all relevant activity.
Control log volume with exclusion filters
Exclusion filters control the volume of logs that you index, which can help you save on costs and focus on only the scenarios you want to monitor. For example, you can create a filter for logs generated by trusted hosts or services in your environments, as seen in the following screenshot:
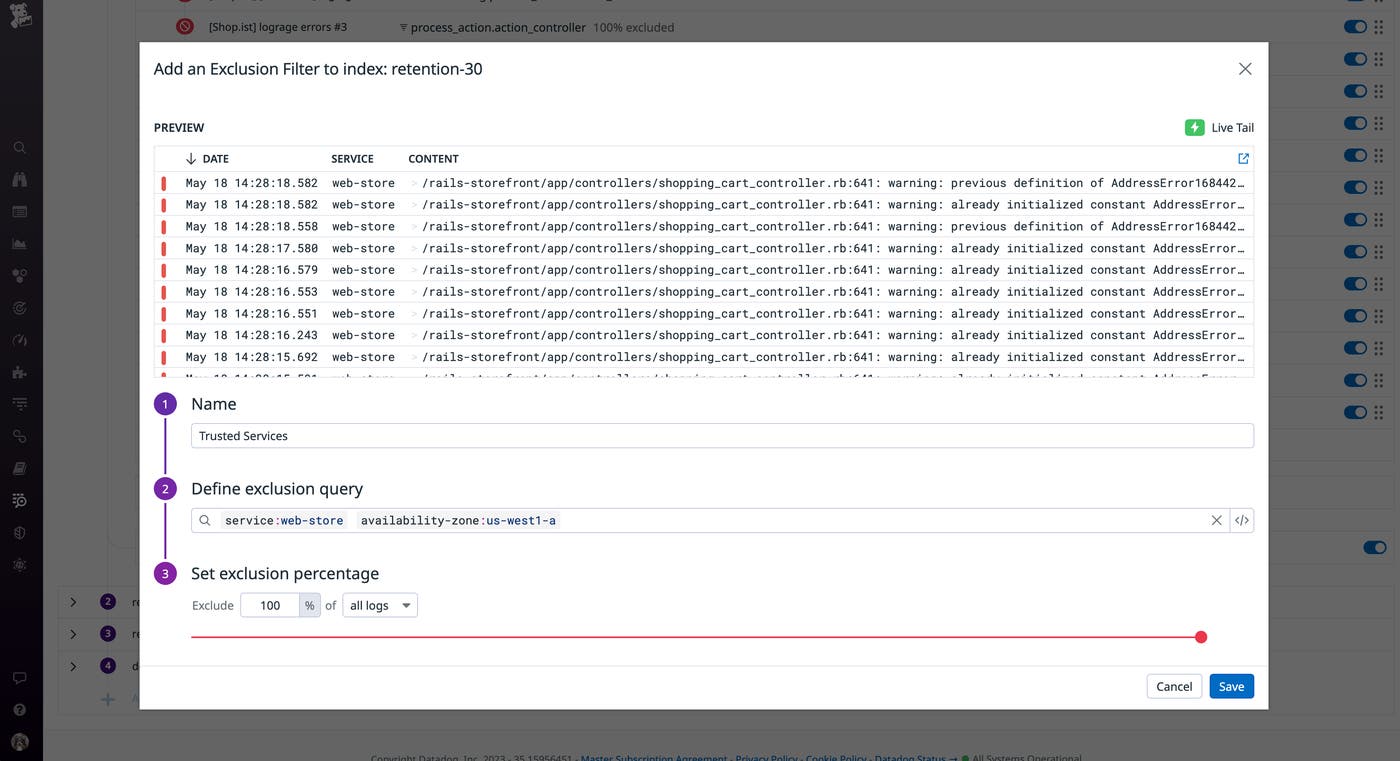
Datadog will then exclude these logs from your indexes, allowing you to focus on external threats. You can easily toggle the filter back on at any time to start indexing those logs again. You can also create a rule that excludes all ALLOW logs from your indexes—thus retaining only DENY logs, which are typically the primary indicator of suspicious activity in your environment.
To ensure that you have visibility into all firewall activity while still efficiently managing log volume, you can create log-based metrics from your excluded logs, ensuring that you do not miss important patterns in firewall activity. If you want to extract metrics from your firewall logs before they leave your environment, use Datadog Observability Pipelines. Log-based metrics are collected in Datadog, so you retain the ability to troubleshoot effectively and analyze historical trends while controlling log volume and reducing costs.
Monitor firewall activity with Datadog
In this post, we looked at how firewall logs give you comprehensive visibility into your network, and described ways to effectively monitor them in order to manage traffic efficiently. Using the Datadog Agent, you can easily collect logs from common firewall systems. And by using Datadog Log Management, you can surface performance issues or potentially malicious activity before they become more serious. To learn more, check out our documentation on Datadog Log Management. If you don’t already have a Datadog account, you can sign up for a 14-day free trial today.


