Mary Jac Heuman
As cloud providers and infrastructure technologies grow their support for Windows containers, developers who use the Windows ecosystem are more and more able to enjoy the benefits of containerization. It’s quicker and easier than ever to modernize and deploy applications that use Windows-specific frameworks like .NET. Plus, Windows developers can use orchestration services like Kubernetes, Amazon ECS, or Docker Swarm to manage the complexity that containerized environments introduce.
While teams move their Windows services to containers, it’s important to continuously monitor application activity to ensure it’s behaving as expected and make informed decisions on how to scale. Datadog provides deep visibility into your Windows containers. Whether that’s Kubernetes, Docker, or a cloud-provider service such as Google Kubernetes Engine, Azure Kubernetes Service, or Amazon Elastic Kubernetes Service, you can get full insight into whatever environment you are running.
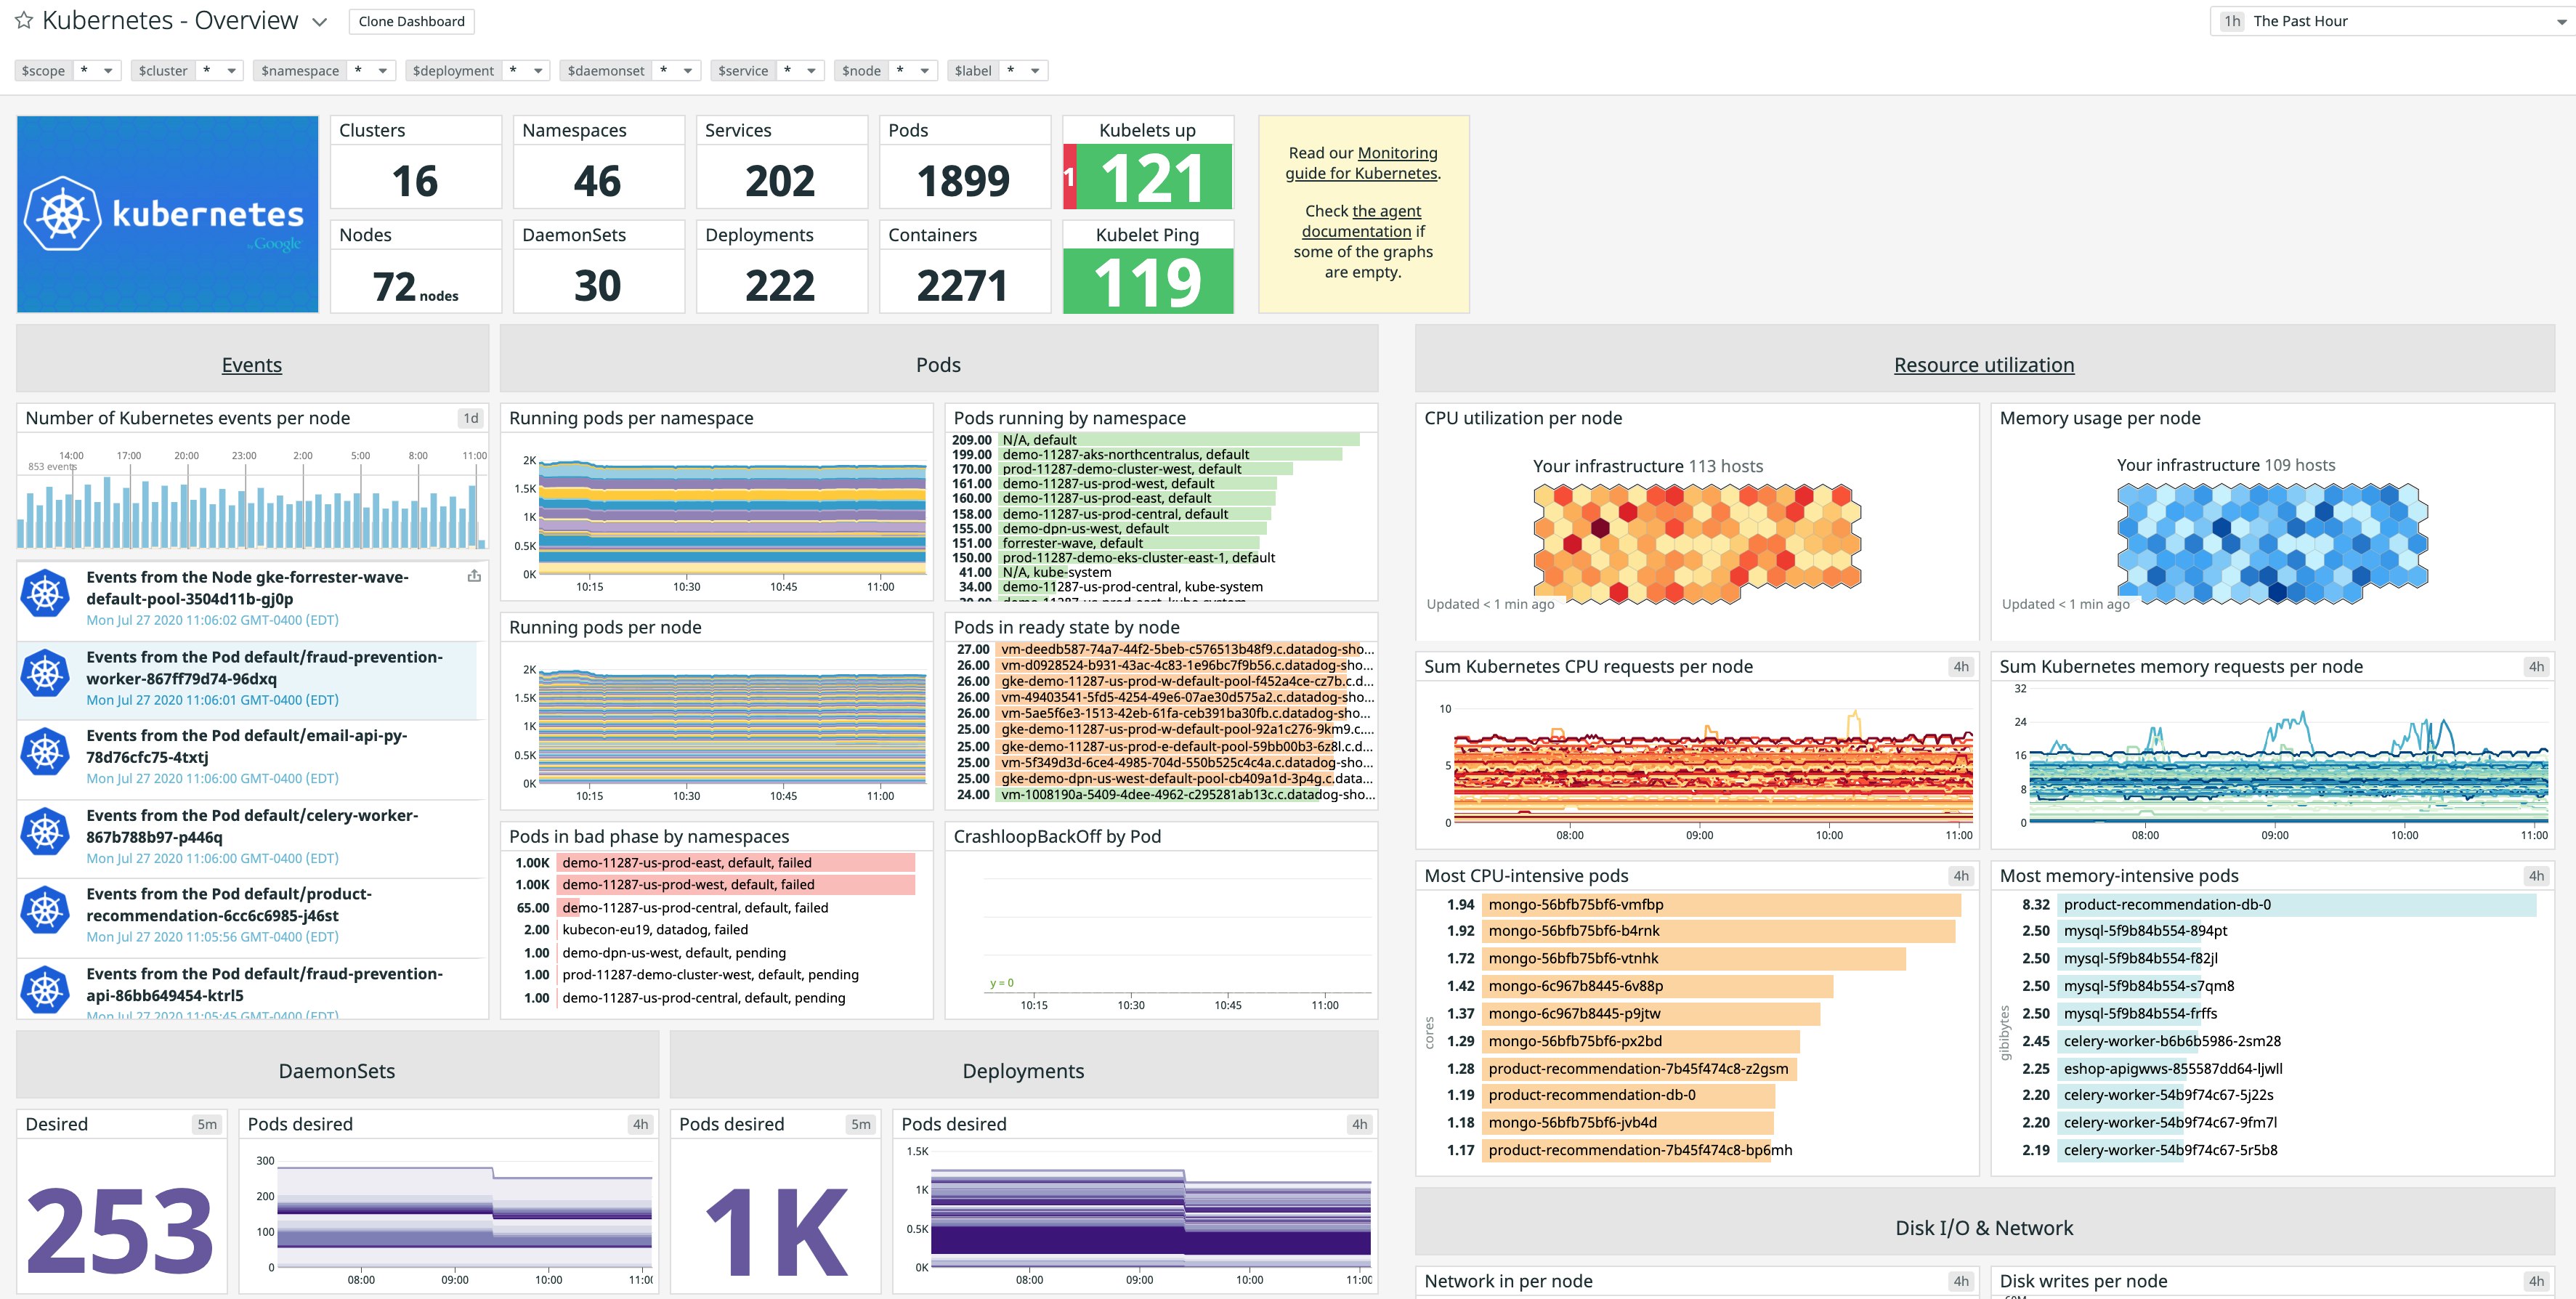
To get the Datadog Agent up and running, visit our documentation for setup instructions for your specific environment. Once you’ve installed the Agent on your cluster, Datadog automatically pulls real-time data from each host and the containers running on it in order to populate customizable, out-of-the-box dashboards. This means you can track at a glance resource usage, node state, and other metrics from your environment and containerized applications at a glance.
Monitor your Windows containers in real time
Containerized environments are inherently dynamic, so getting real-time visibility is crucial to responding to problems quickly. Datadog’s Container Map gives you a high-level overview of your entire fleet as containers are created and scaled.
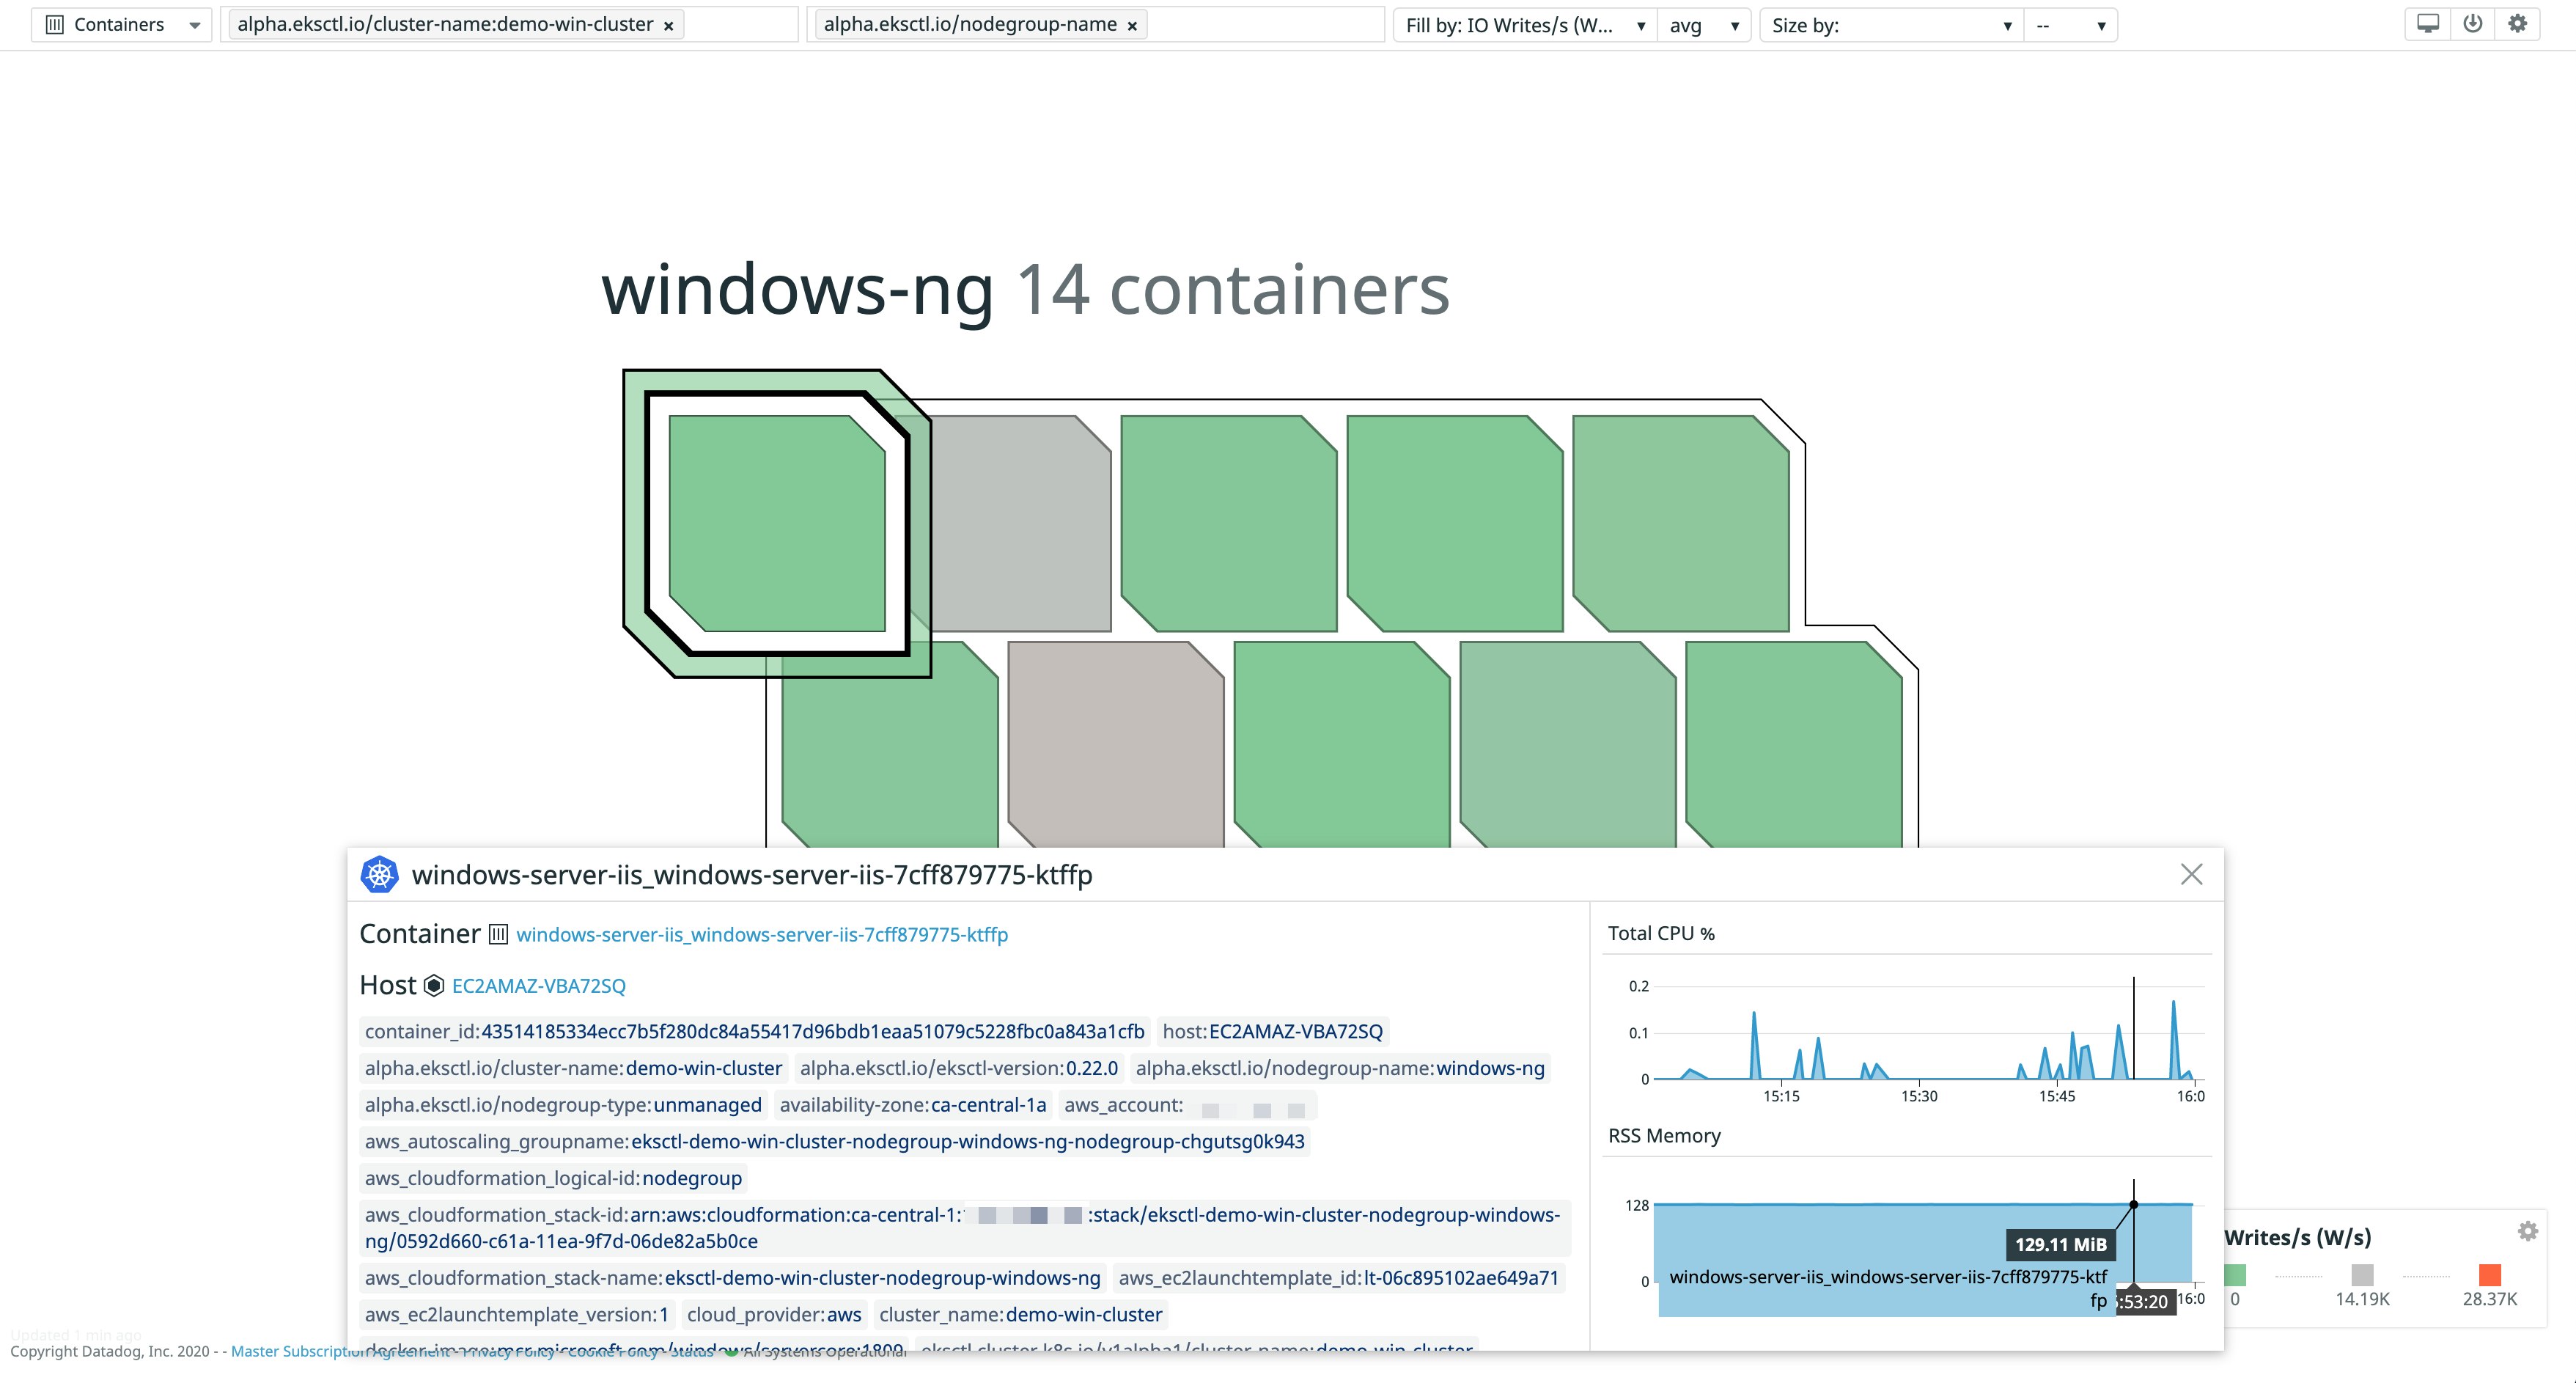
For more granular insights, the Live Container view provides easy access to resource metrics like CPU capacity and memory usage across all of your containers, updating every three seconds. Datadog automatically tags each container with key metadata, such as region, container image, cluster, and more. This means you can easily filter and drill down to the exact containers you want to see in order to investigate issues. After selecting a container, you can seamlessly view associated logs and traces for more context as you troubleshoot.
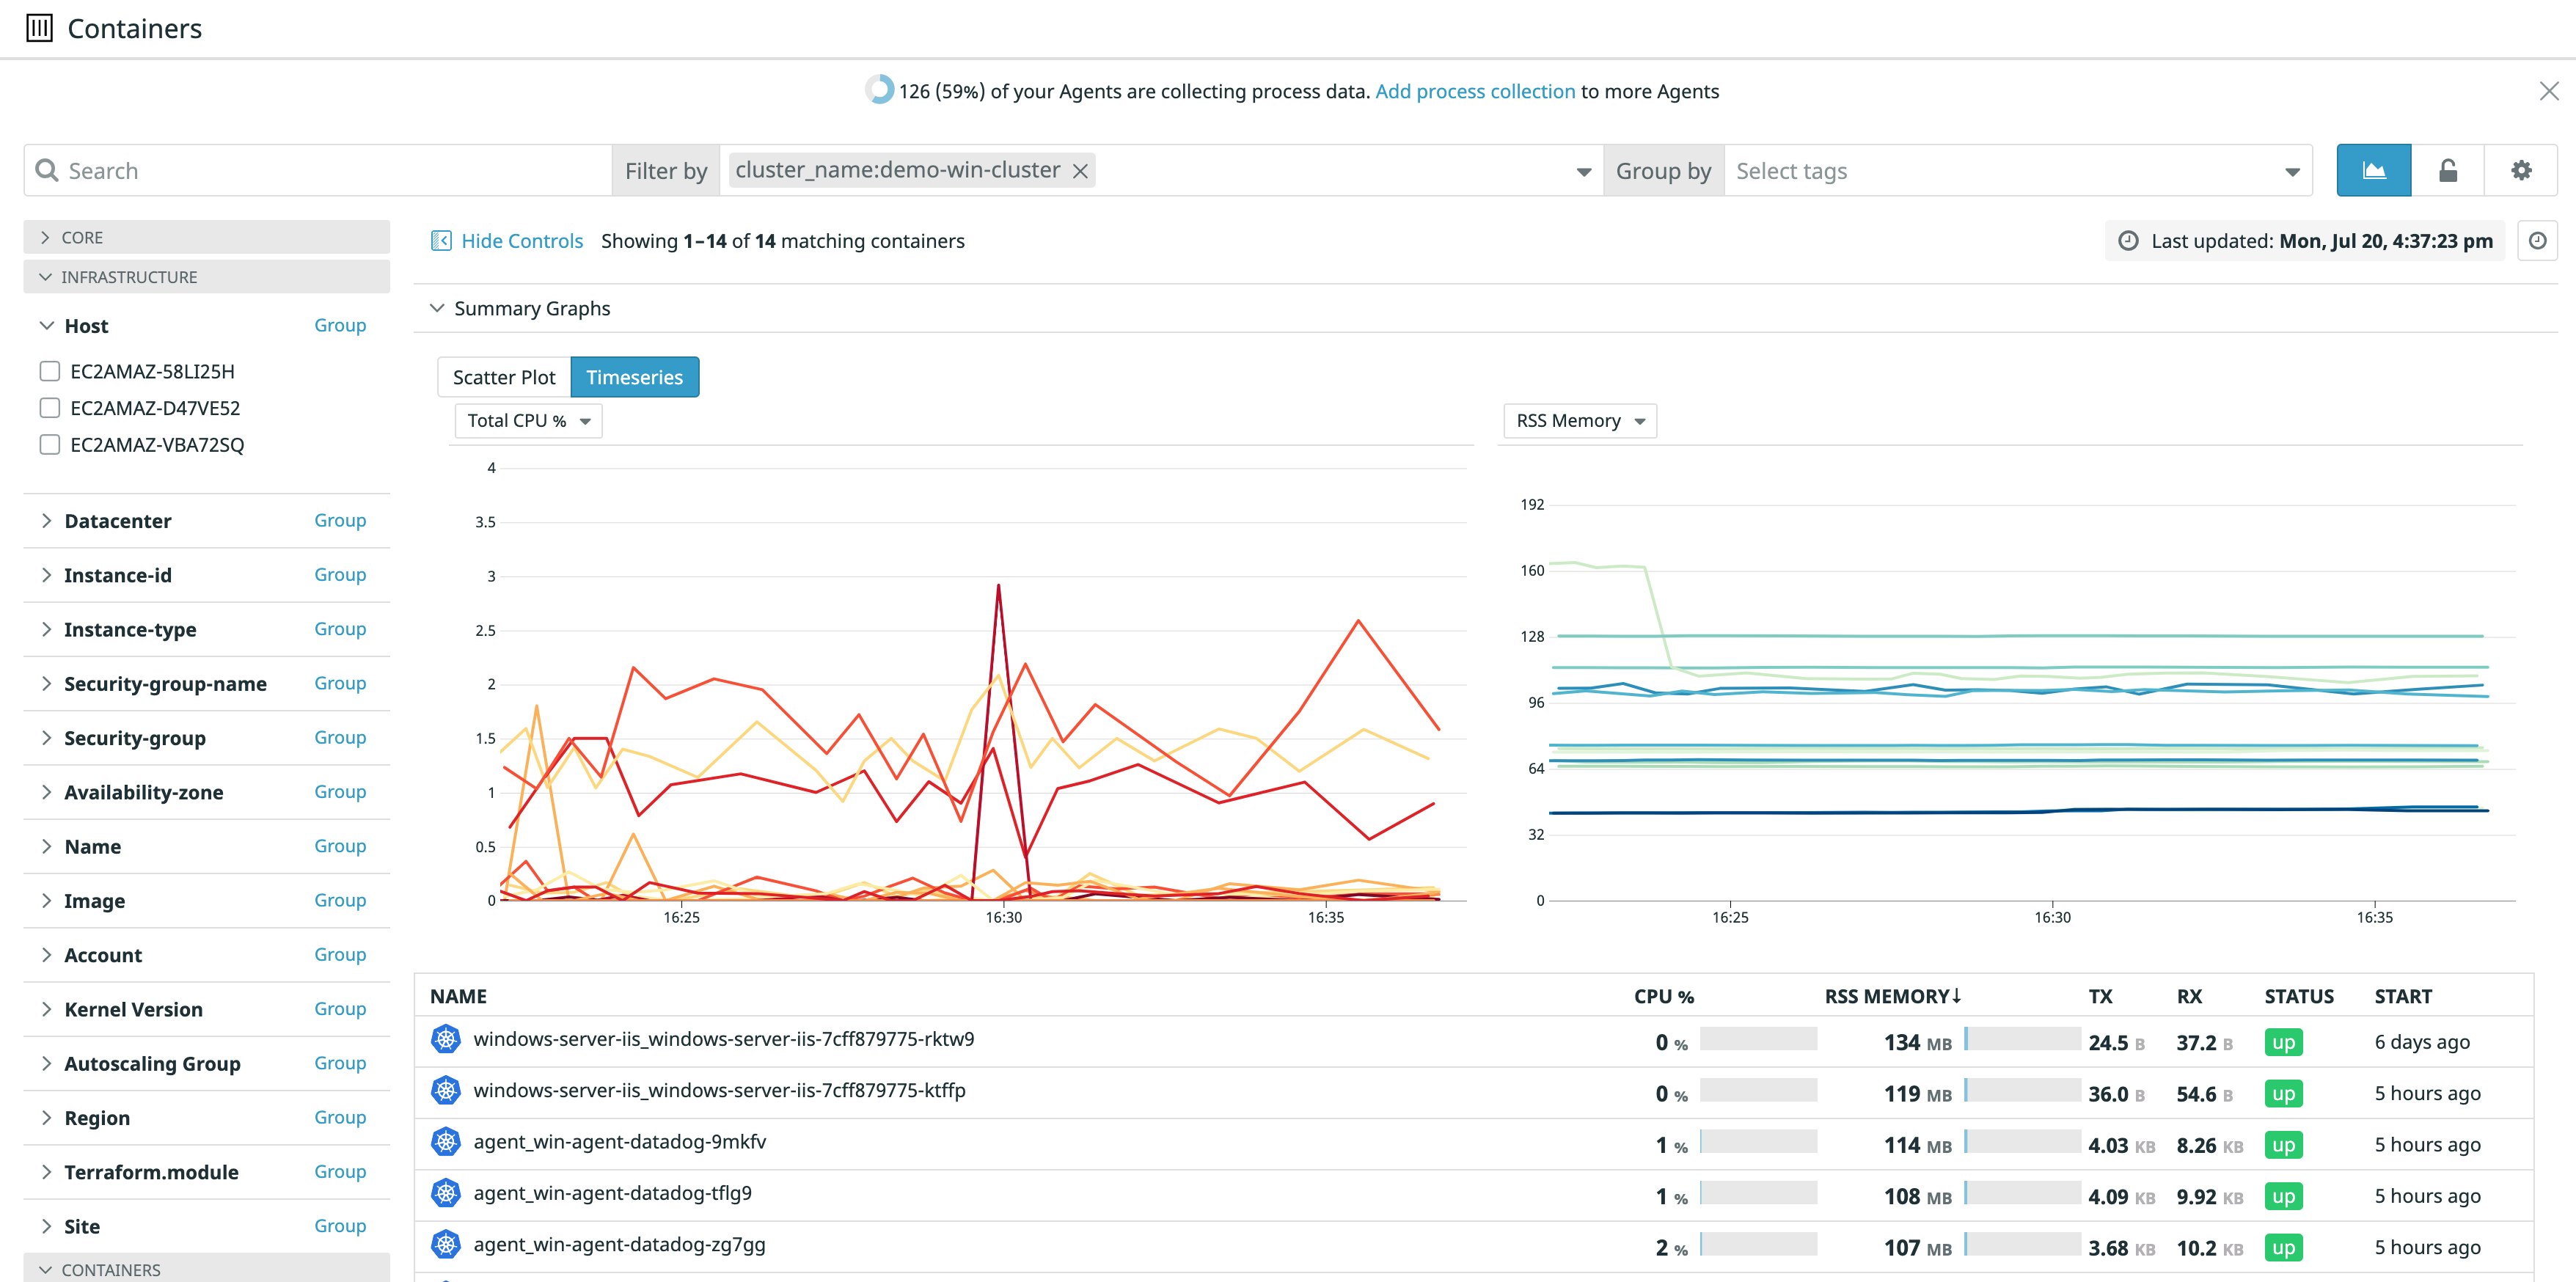
Container orchestration technologies like Kubernetes or Amazon ECS help you manage containerized environments. But, as they create and destroy containers on your behalf, it can be difficult to track what’s running where. The Datadog Agent’s Autodiscovery feature solves this problem for you by automatically detecting services running on containers as they are created. It then applies the appropriate configuration and collects relevant metrics. Tags mean you can easily search and organize your dynamic fleet and get a complete picture of your infrastructure’s health and performance even as containers churn.
Collect logs and traces for deeper visibility
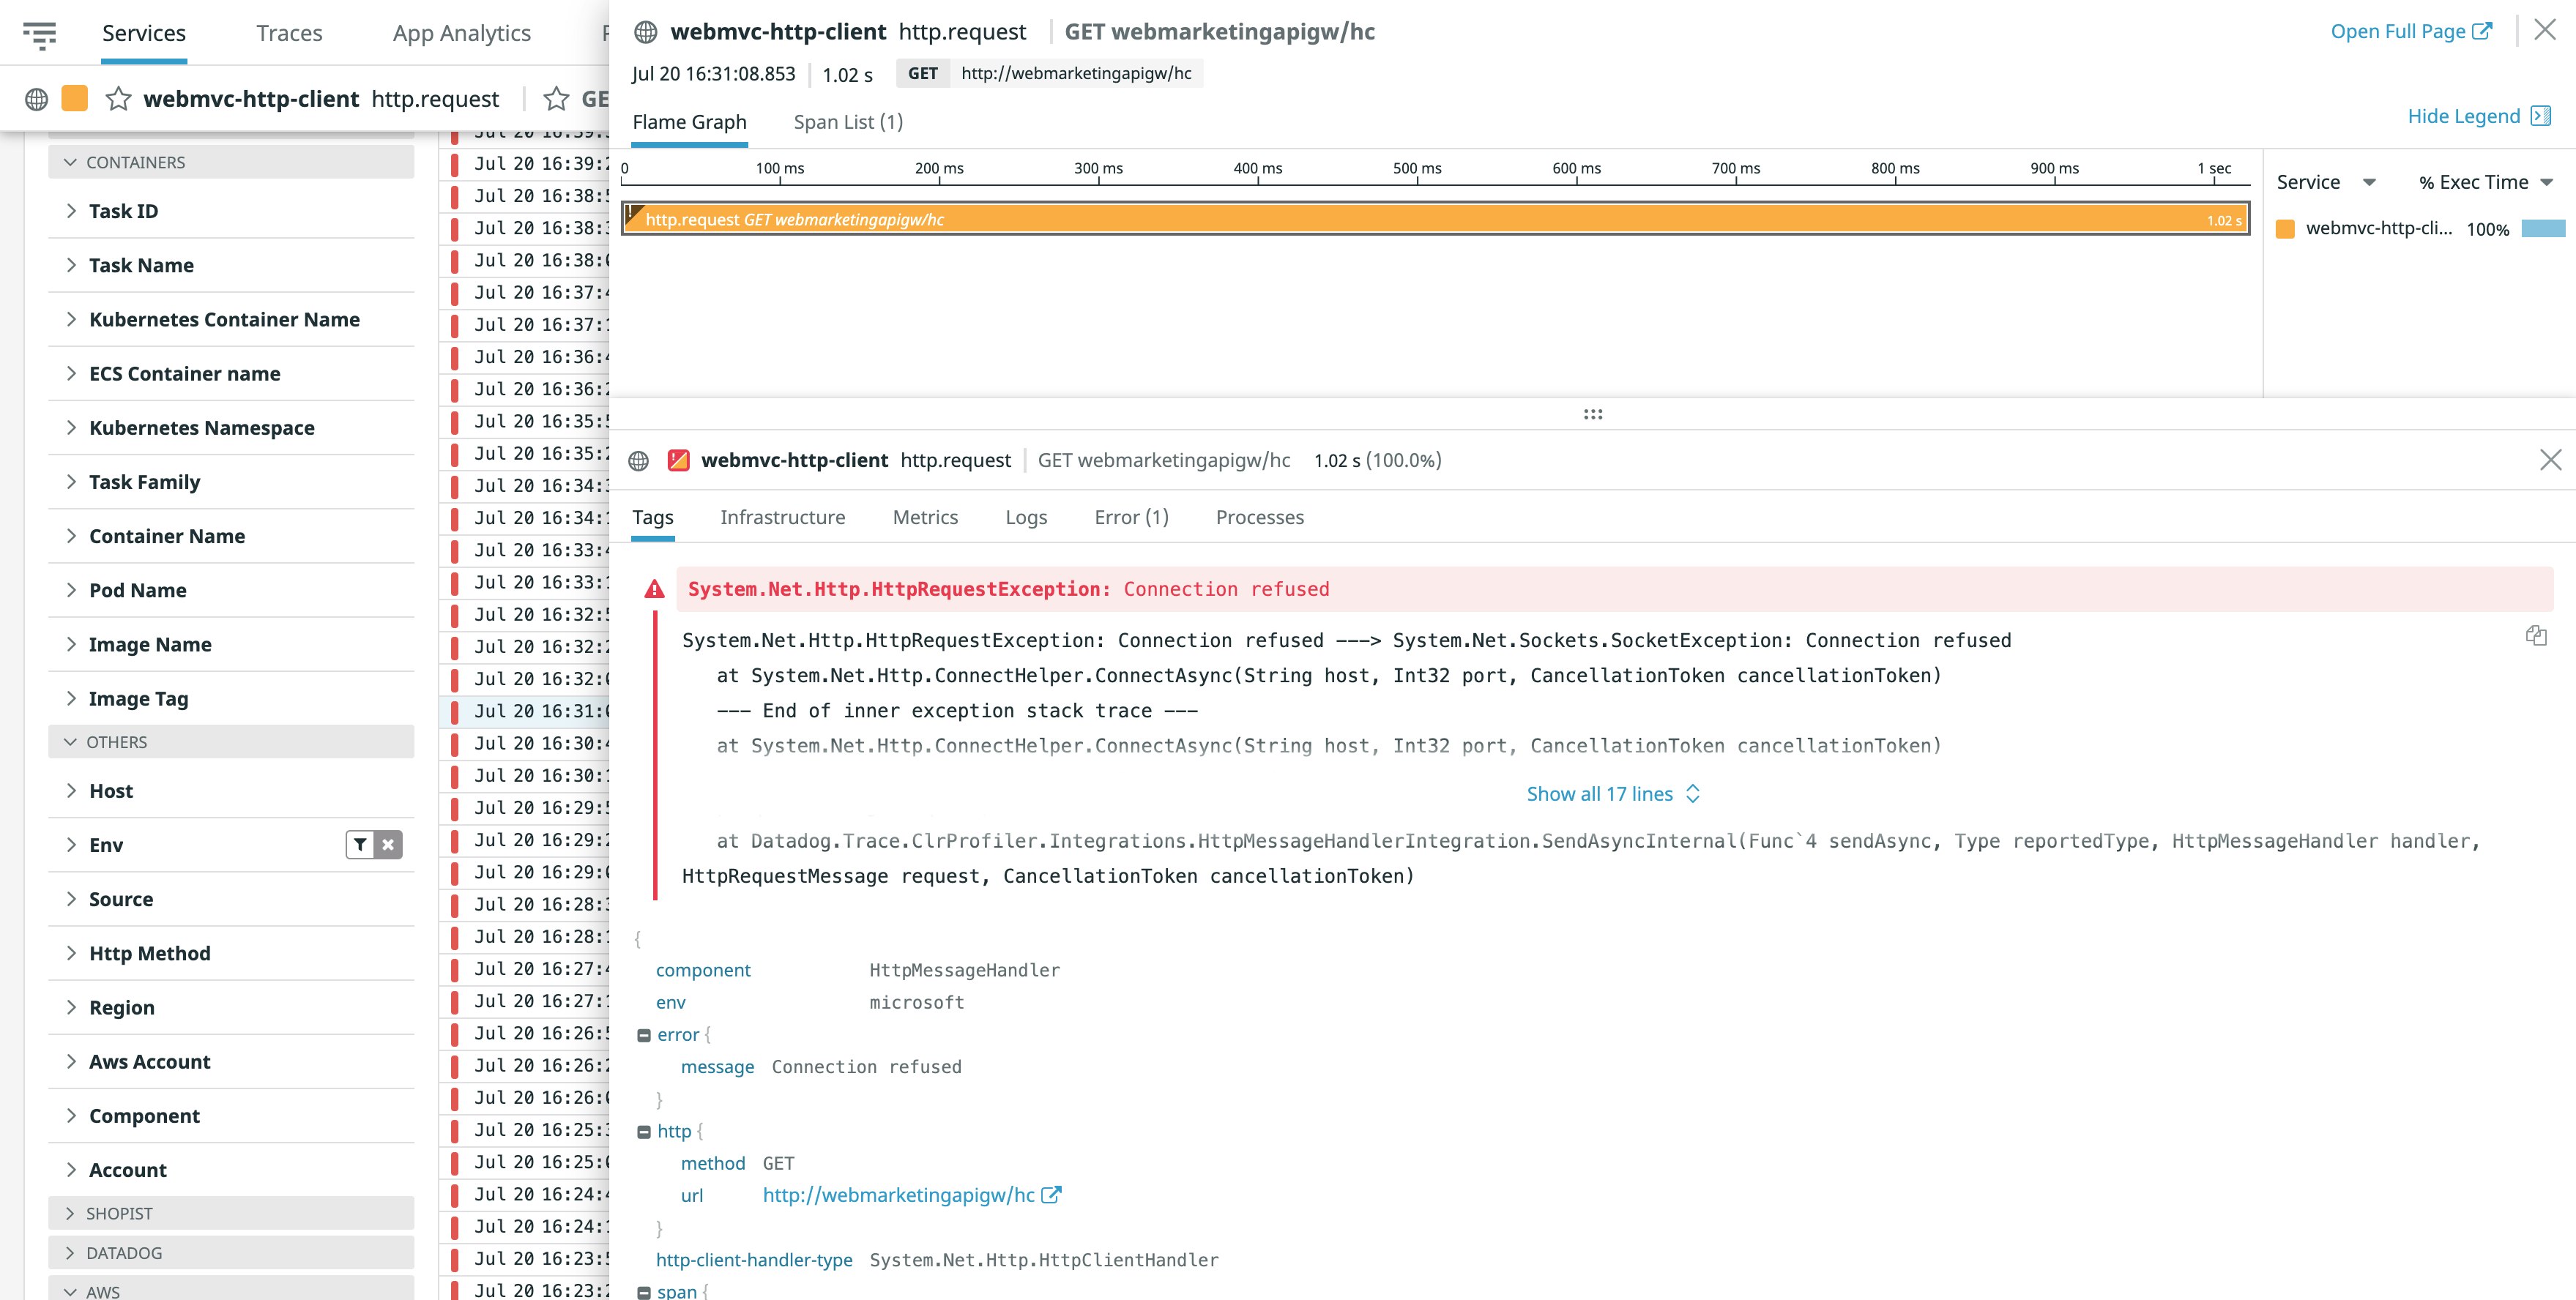
For even more insights into your containerized environment, the Datadog Agent can also collect logs and distributed request traces from the services running on your Windows containers. You can easily pivot from high-level infrastructure metrics to associated logs or traces for total context, making it easy to find the source of errors or resource bottlenecks and determine the impact on your containers’ vital signs.
For instance, if a dashboard shows that a service is reporting high latency, you can click through the offending metric to view the traces and logs corresponding to that point in time. You can drill down into a single trace by viewing a flame graph that visualizes the lifespan of the request, which is in turn broken down into spans revealing sources of latency and errors. In the same pane, you can see all logs and underlying infrastructure metrics for complete visibility.
Start monitoring Your Windows Containers
Datadog provides visibility into your containerized Windows-based applications across whichever environment you are using, from a bird’s-eye view of your entire infrastructure to the minute details of a single request’s lifespan. And, with more than 1,000 integrations, you can monitor the health and performance of your entire stack as you migrate to a modern, cloud-native environment. Get started by visiting our documentation for installation instructions, or sign up here for a free 14-day trial.
