David M. Lentz
Windows hosts make up a significant portion of the infrastructure of many organizations, and visibility into Windows systems can be a vital observability need. We're pleased to announce that Datadog's Live Process monitoring is now available for Windows.
Bringing Live Process monitoring to Windows
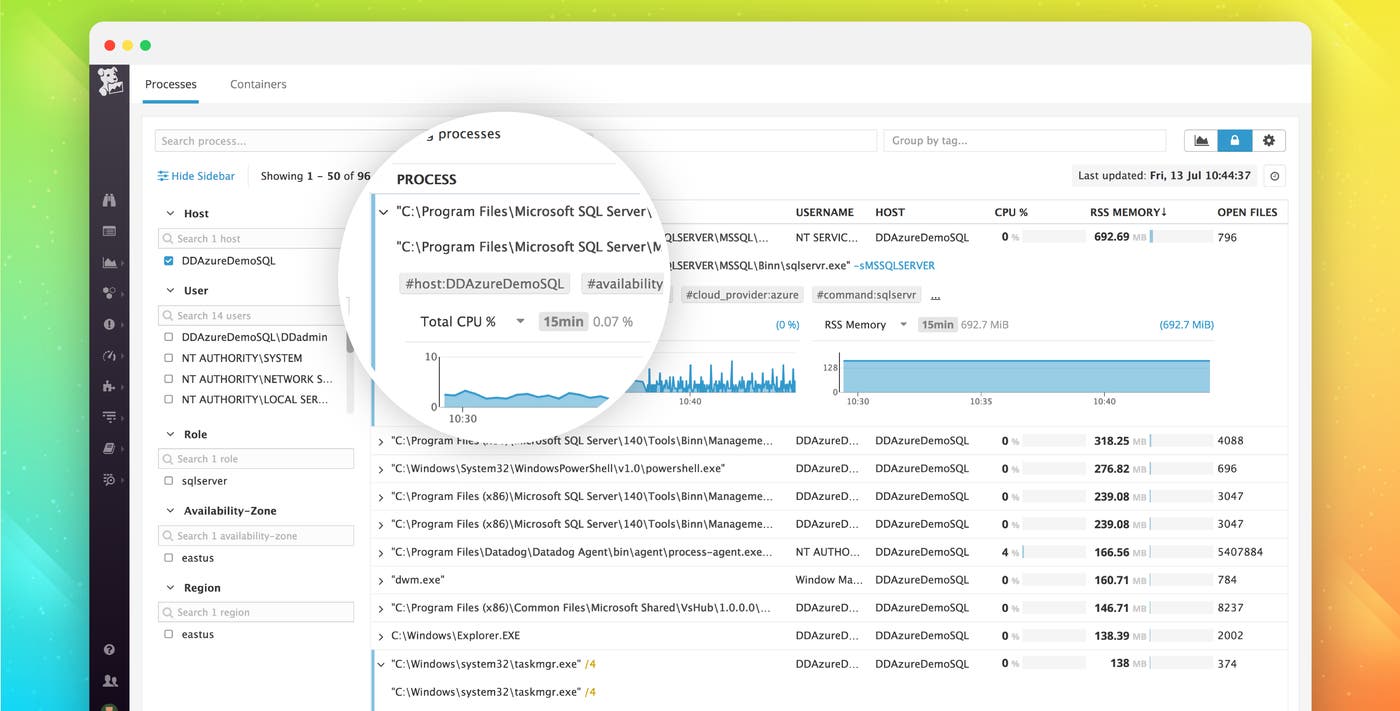
Last year we introduced Live Process monitoring, which allows you to gain granular insights about resource usage across your infrastructure. With Live Process monitoring, you can explore a detailed, real-time inventory of all the processes running across your distributed hosts. Now, that includes Windows Server hosts, version 2008 and up.
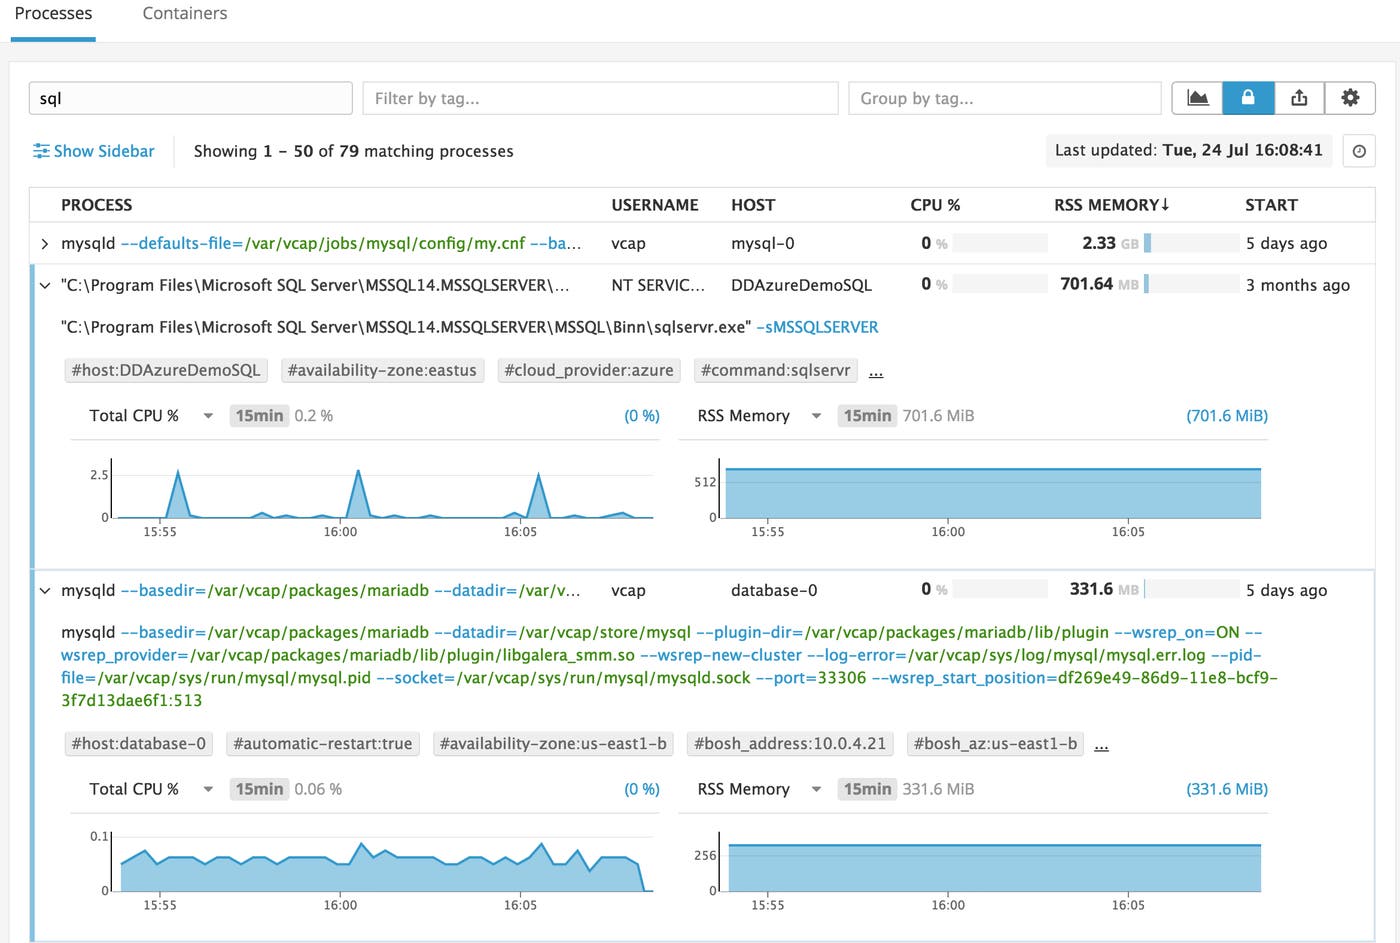
Live Process monitoring shows resources used by each process, updated automatically every 2 seconds. At a glance, you'll see current CPU and memory usage, and you can click to view graphs showing recent consumption by any single process running in your infrastructure.
Now, with Datadog's support for Windows processes, you can even see data from Windows and Linux hosts in a single view:

Search and filter running processes
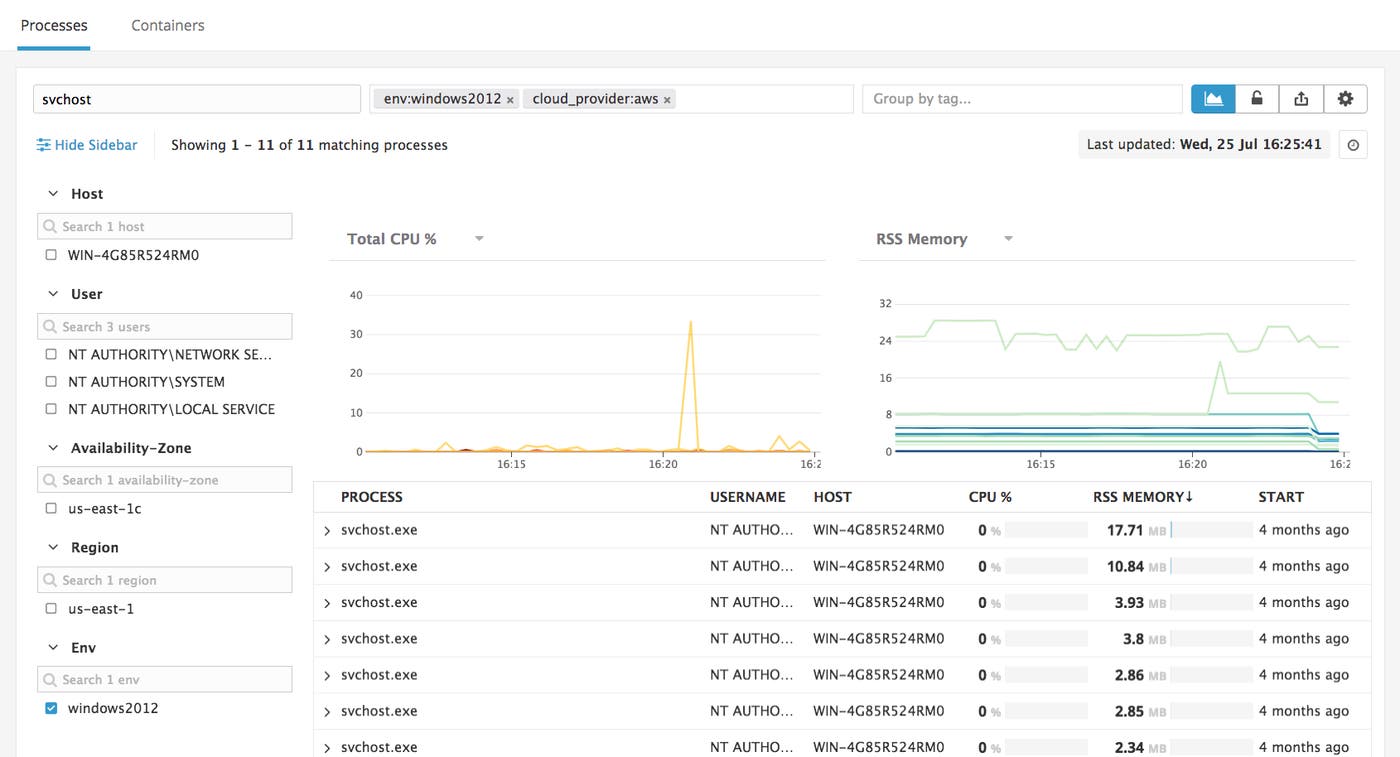
This level of detail creates a lot of data, and the Live Process view gives you tools to manage it easily. For example, you can filter by process owner to isolate resources per user, and you can search by process name or by parameter strings. You can group data by host and by tag (including tags automatically inherited from your cloud provider) to see an aggregate view of resource usage across hosts. The screenshot below illustrates these and other controls in the Live Process view.

View historical process metrics
In addition to real-time process metrics, you can also look back at recent historical data. You can use this feature to add context to events such as an alert indicating unexpected resource usage. To view past resource usage, click the Historical icon in the top-right and select a date and time.

Add process metrics to your dashboards
You can add Windows process monitoring to your existing dashboards, too. The screenshot below shows dashboard graphs reporting per-process CPU metrics from a Windows host.

You can easily pivot from a dashboard graph to a Live Process view—just click a point of interest on the graph, then click View processes.

Enabling process monitoring on Windows
To use Live Process monitoring for Windows, you'll need version 6 of the Datadog Agent. If you're still using version 5, follow these instructions to upgrade.
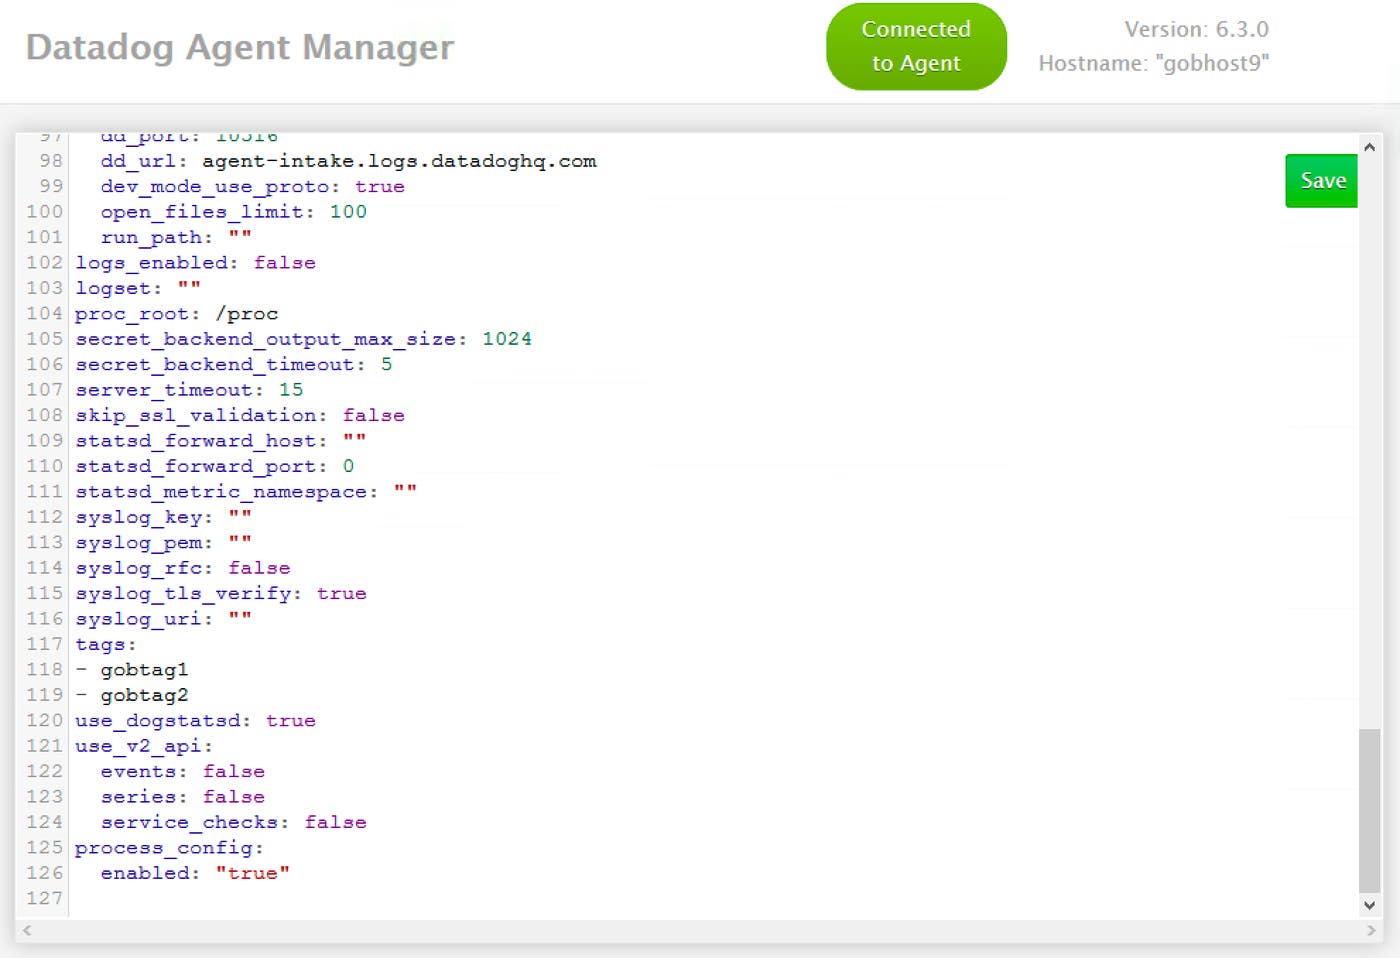
Update the config file on each Windows host using the web-based Datadog Agent Manager. Use the Settings link in the left navigation to load the configuration for editing. Add these lines to the end of the file:
process_config: enabled: "true"
Click Save, then click Restart Agent.
Data from the Windows host will begin to appear in the Live Process page in your Datadog account.
Start monitoring Windows processes!
Live Process monitoring gives you real-time data about every process running on your infrastructure—now including Windows. For guidance on updating your Agent and configuring your Windows hosts, see the Datadog documentation. If you're not already using Datadog, sign up for a free 14-day trial to get started today.

