


Ripin Checker
The widespread adoption of cloud-native applications, public cloud infrastructure, remote workforces, and IoT deployments has accelerated the shift toward software-defined networking (SDN) solutions. These solutions include software-defined wide area networks (SD-WANs), cloud-based networking platforms like Meraki, and data center networking architectures like Cisco ACI—which offer greater flexibility, centralized control, and cost efficiency compared to traditional networking approaches. Managing and troubleshooting these environments, however, can be challenging due to their modular design, hidden automation layers, and overlay tunneling technologies that abstract away physical connections.
In this post, we’ll look at how Datadog Network Monitoring, together with a couple of key integrations, can help teams overcome these challenges by providing deep visibility into your SDN solutions, whether it’s an SD-WAN, a cloud-managed network platform like Meraki, or a data center fabric like Cisco ACI.
Get deep insights into SD-WAN health and performance
Datadog Network Monitoring has integrations with leading SD-WAN vendors, including Cisco Catalyst SD-WAN, VMware Velocloud, Fortinet, and Meraki. These integrations include out-of-the-box (OOTB) dashboards that provide a bird’s-eye view of the overall health and performance of your SD-WAN infrastructure. OOTB dashboards surface critical device metrics like CPU, memory, and disk usage, providing you with insights so that you can quickly spot issues and begin troubleshooting. For example, if a Cisco SD-WAN edge device unexpectedly reboots at an office location, Datadog can help you quickly pinpoint when the reboot occurred, correlate it with preceding events like a spike in CPU or memory usage, and assess whether similar patterns are emerging across other devices.
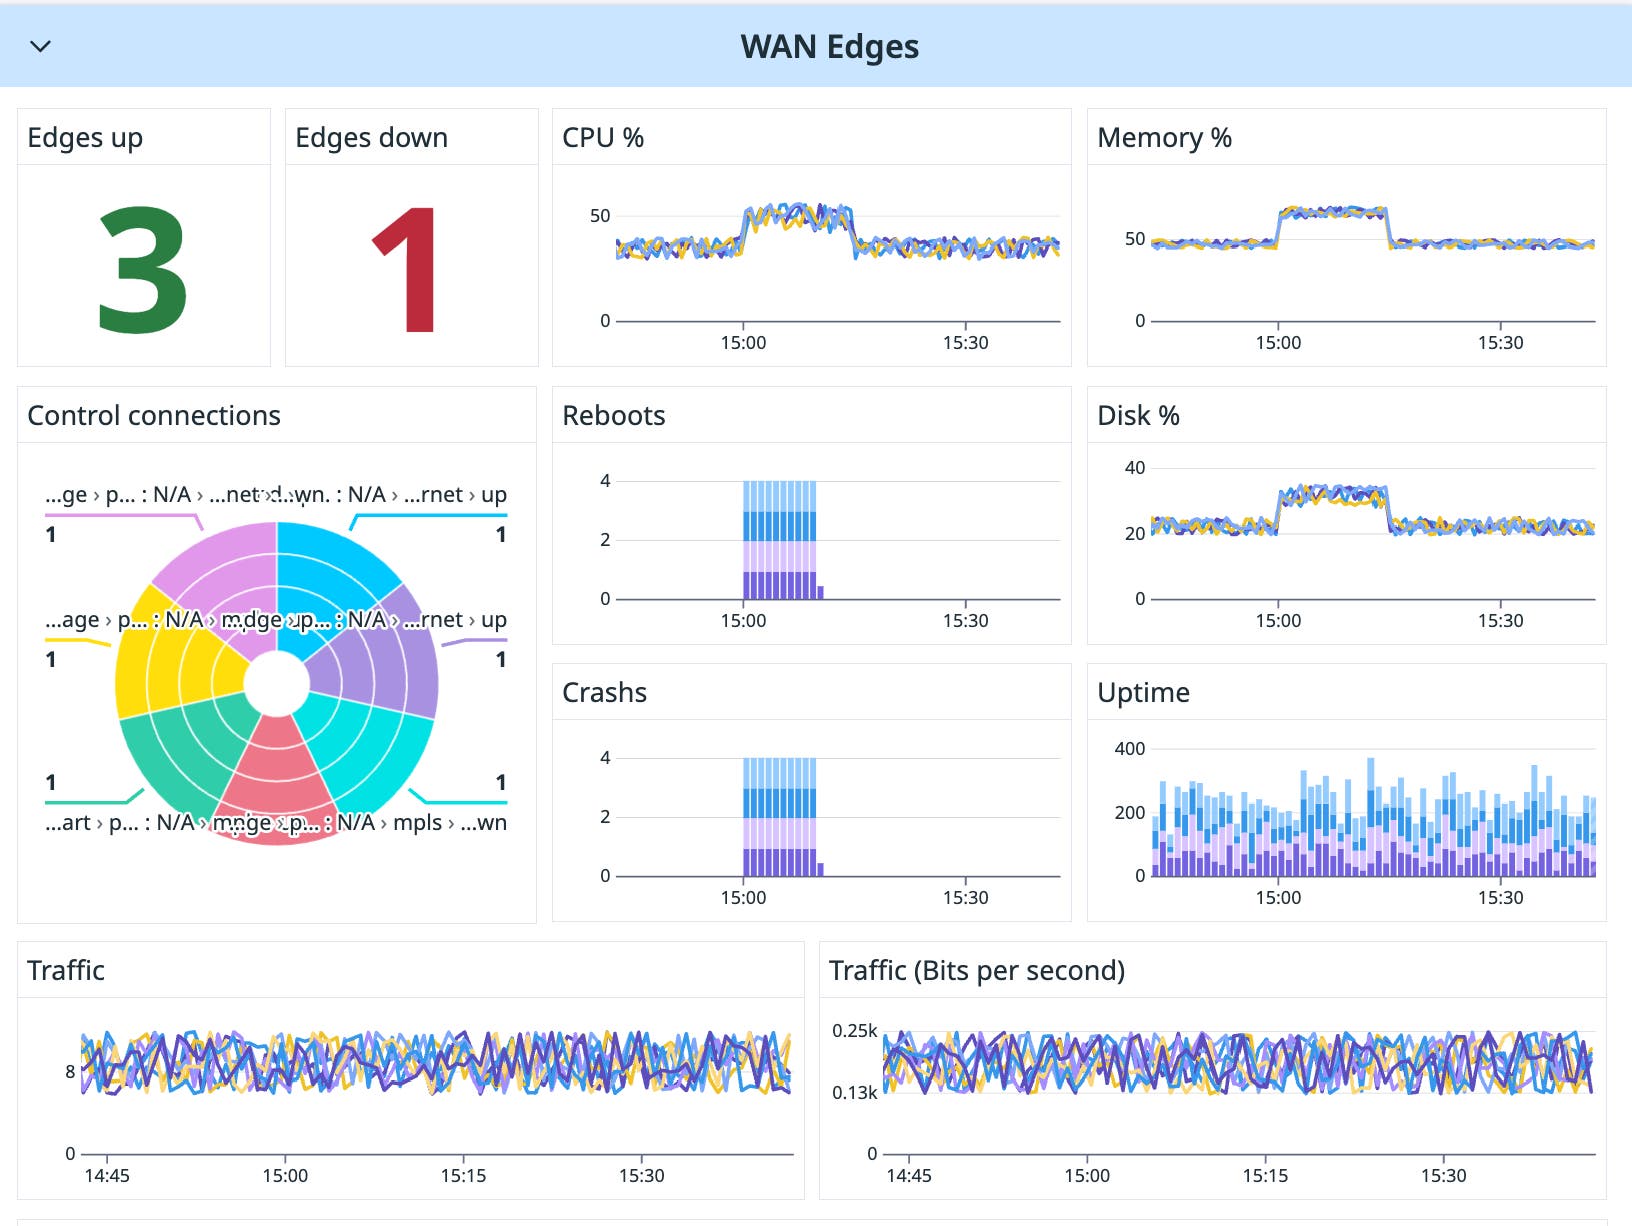
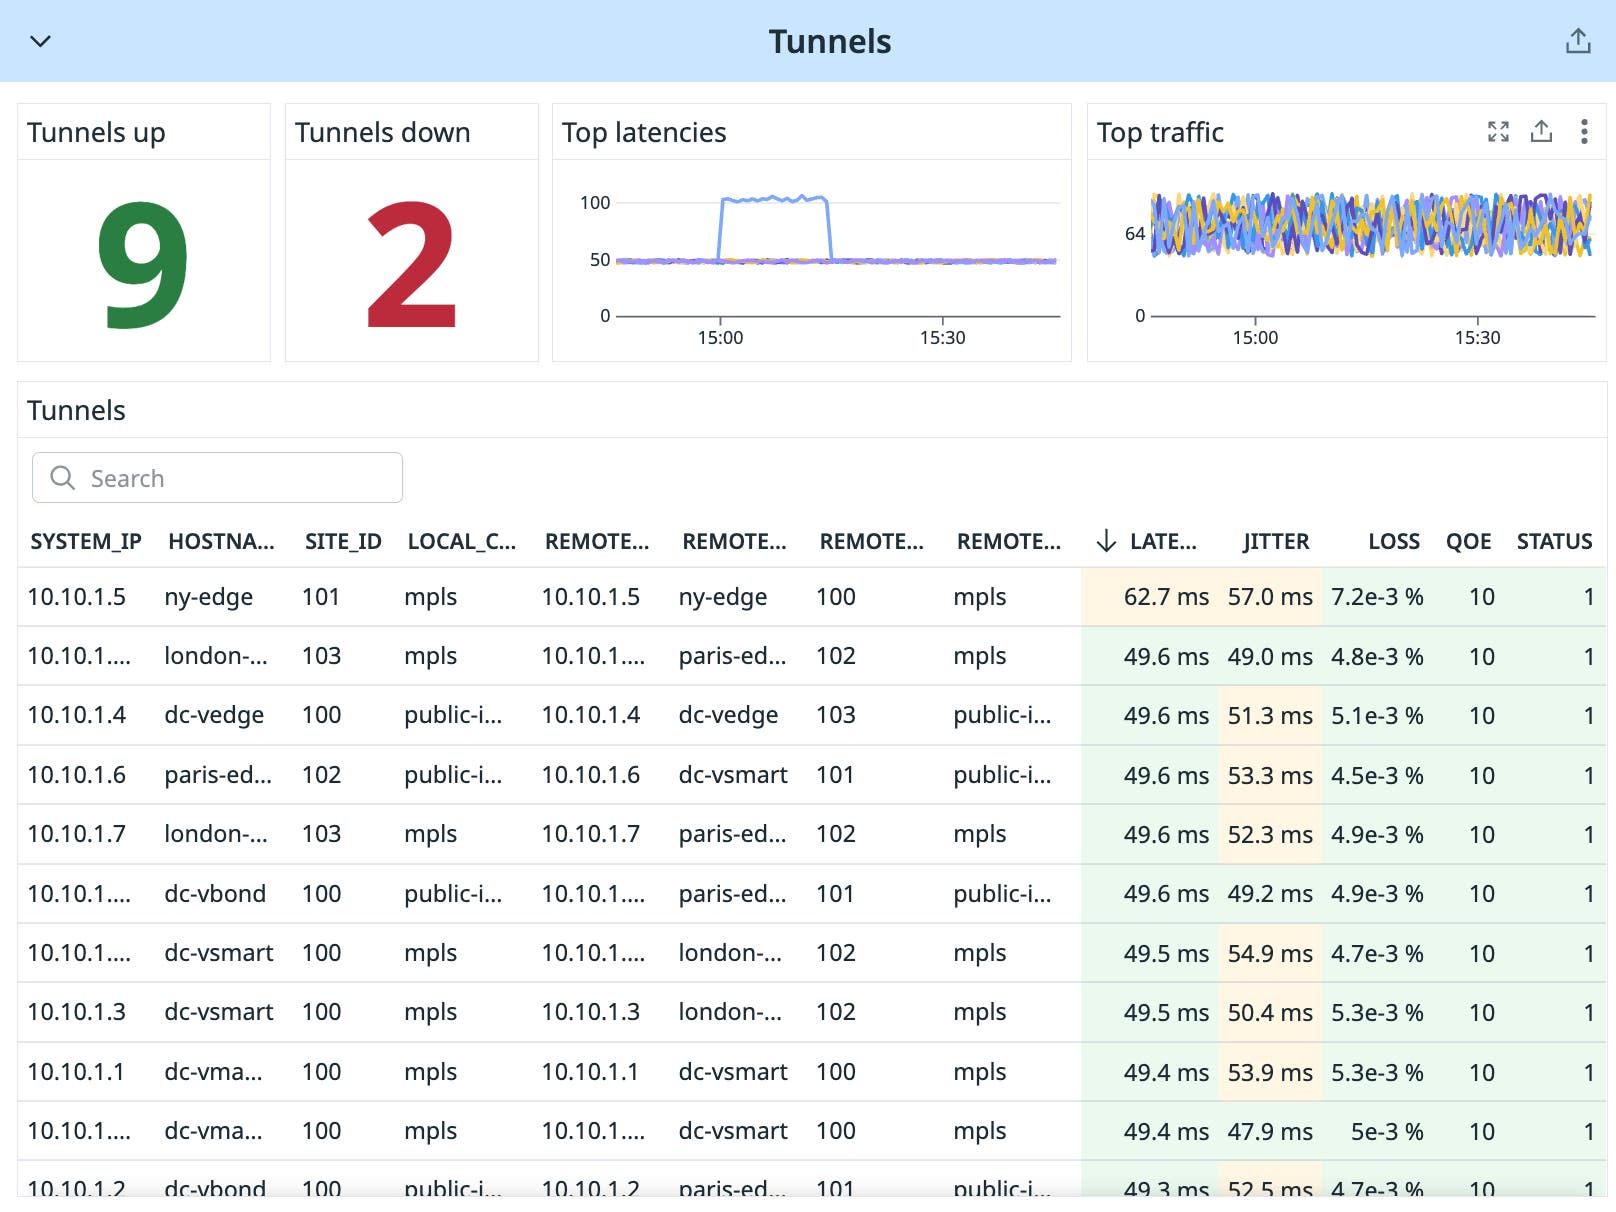
Datadog SD-WAN network monitoring also provides visibility into both the physical (underlay) and virtual (overlay) components of your SD-WAN so that you can view connections between edge devices and control plane components. You can use SD-WAN dashboards to correlate the performance of virtual VPN tunnels with the health of the underlying transport links—such as MPLS circuits, broadband connections, and LTE—giving you a unified view of how physical connectivity impacts application traffic across your SD-WAN.
For example, if an office reports slow access to internal applications, the dashboard can help you identify whether the issue is tied to a degraded MPLS link—such as high packet loss or latency—or if it’s isolated to a specific overlay tunnel. Then, you can determine whether the problem requires adjusting SD-WAN routing policies, contacting a service provider, or investigating local device health.
Datadog also has a network path feature that teams can use to visualize the full end-to-end path of SD-WAN traffic and identify which segments may be causing delays.
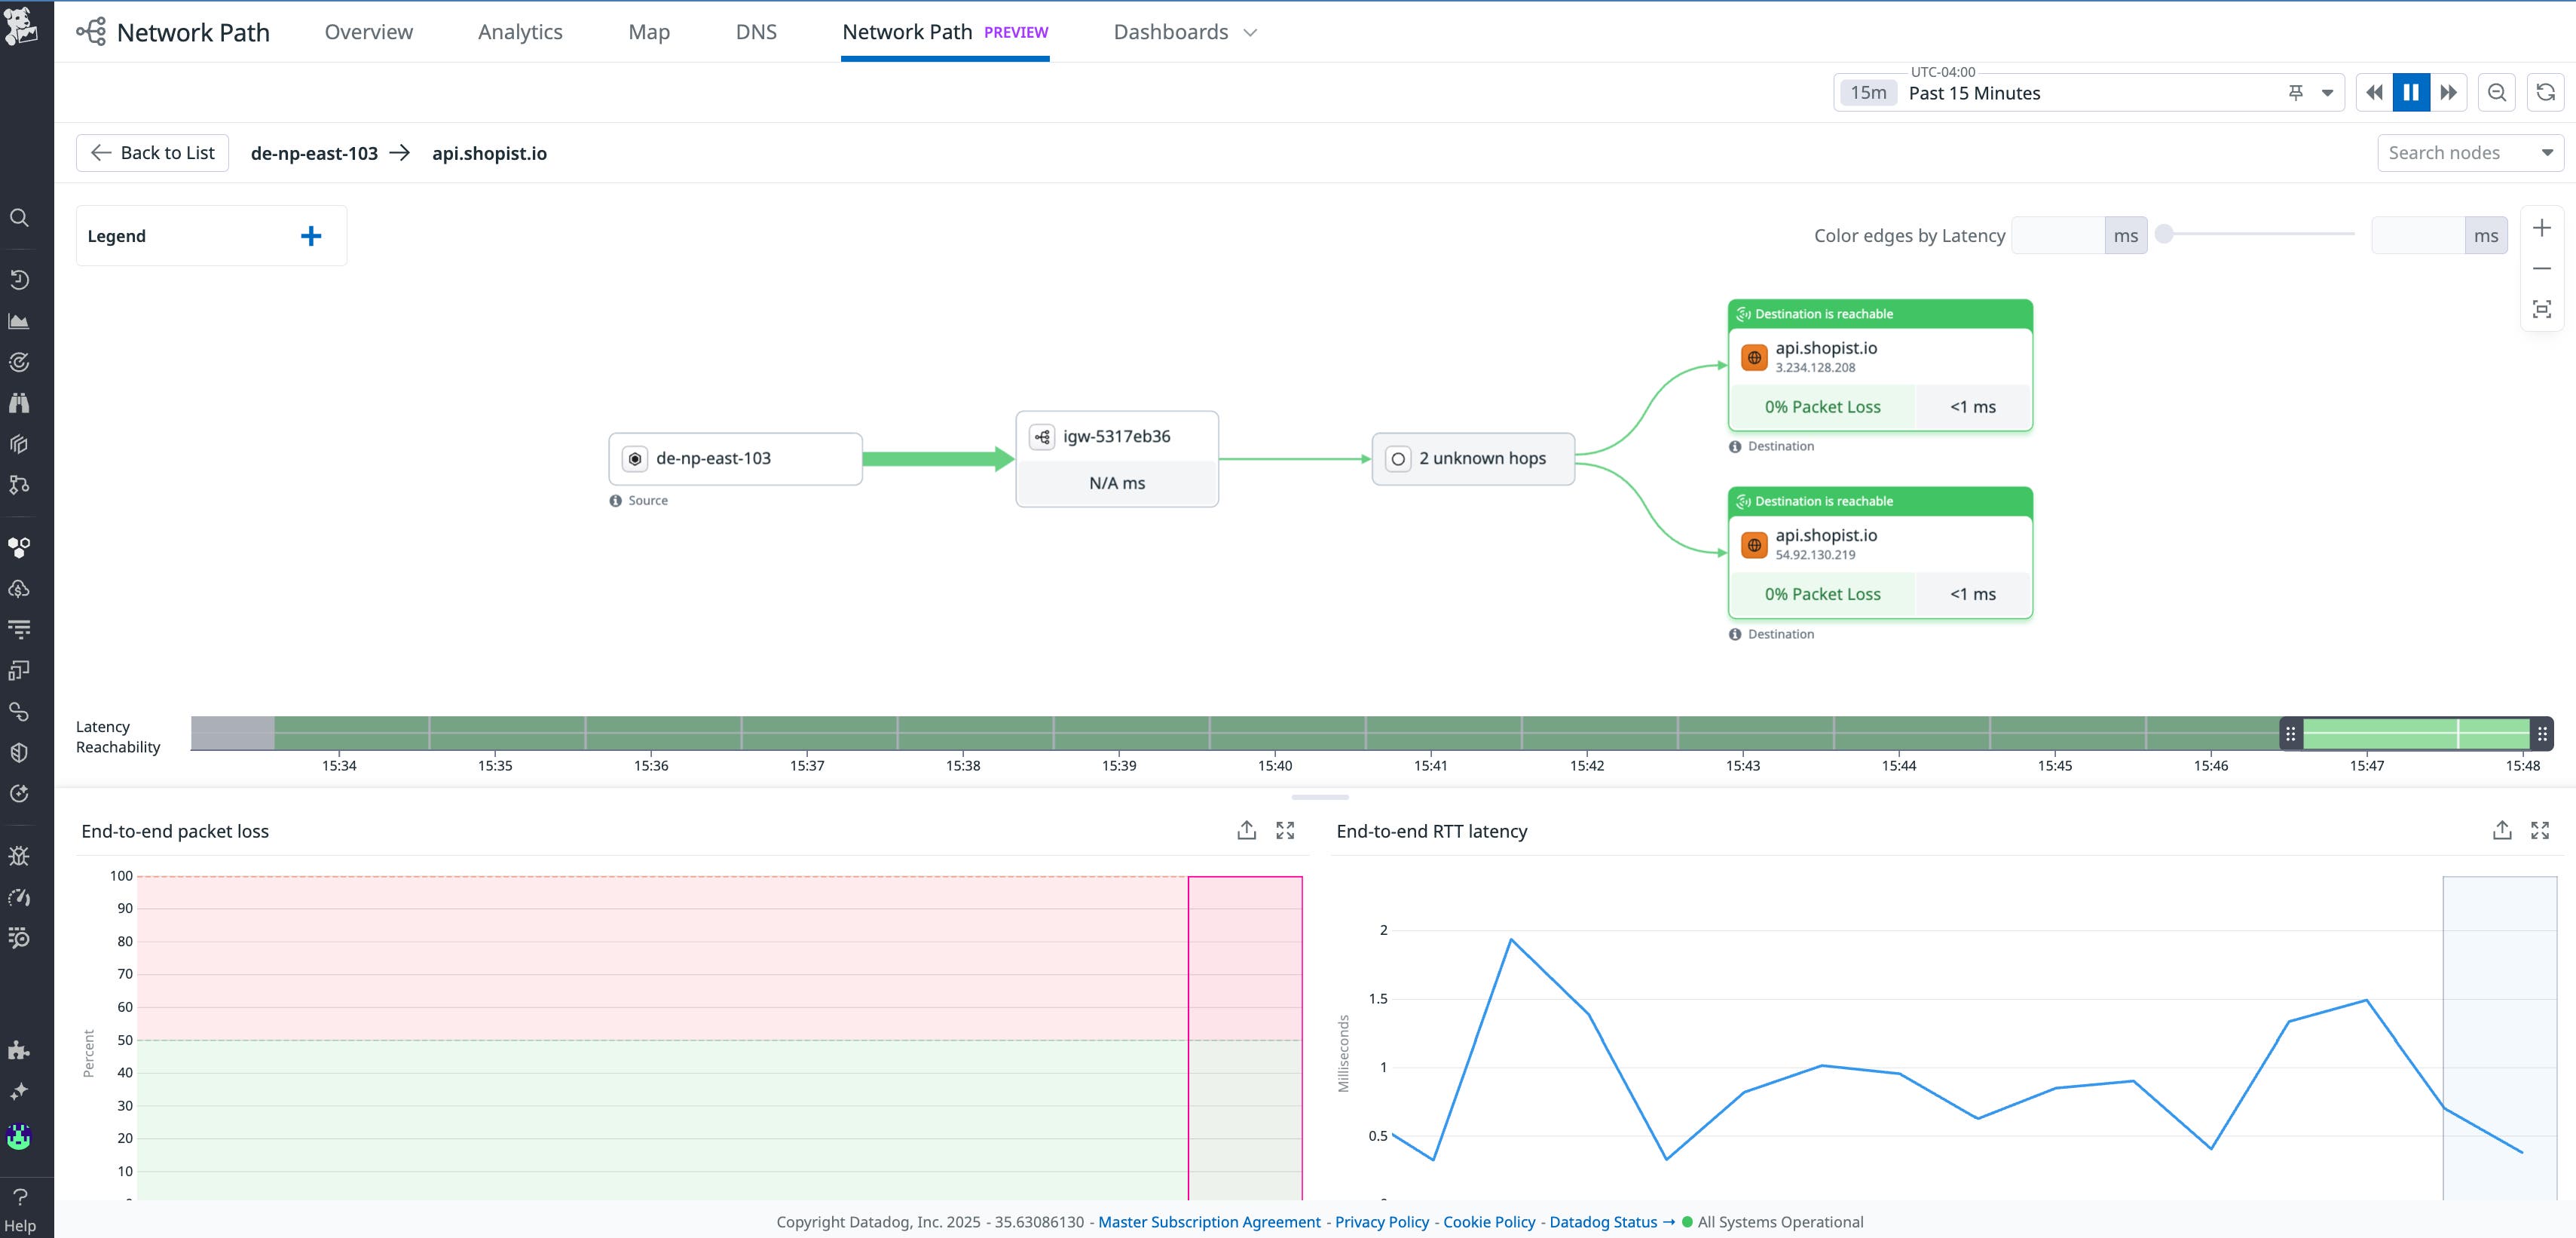
Additionally, Datadog’s enriched NetFlow monitoring adds SD-WAN-specific context—like tunnel and application details—so you can see how traffic maps from LAN to WAN and gain visibility into the actual applications in each flow.
Visualize key cloud-managed Meraki metrics
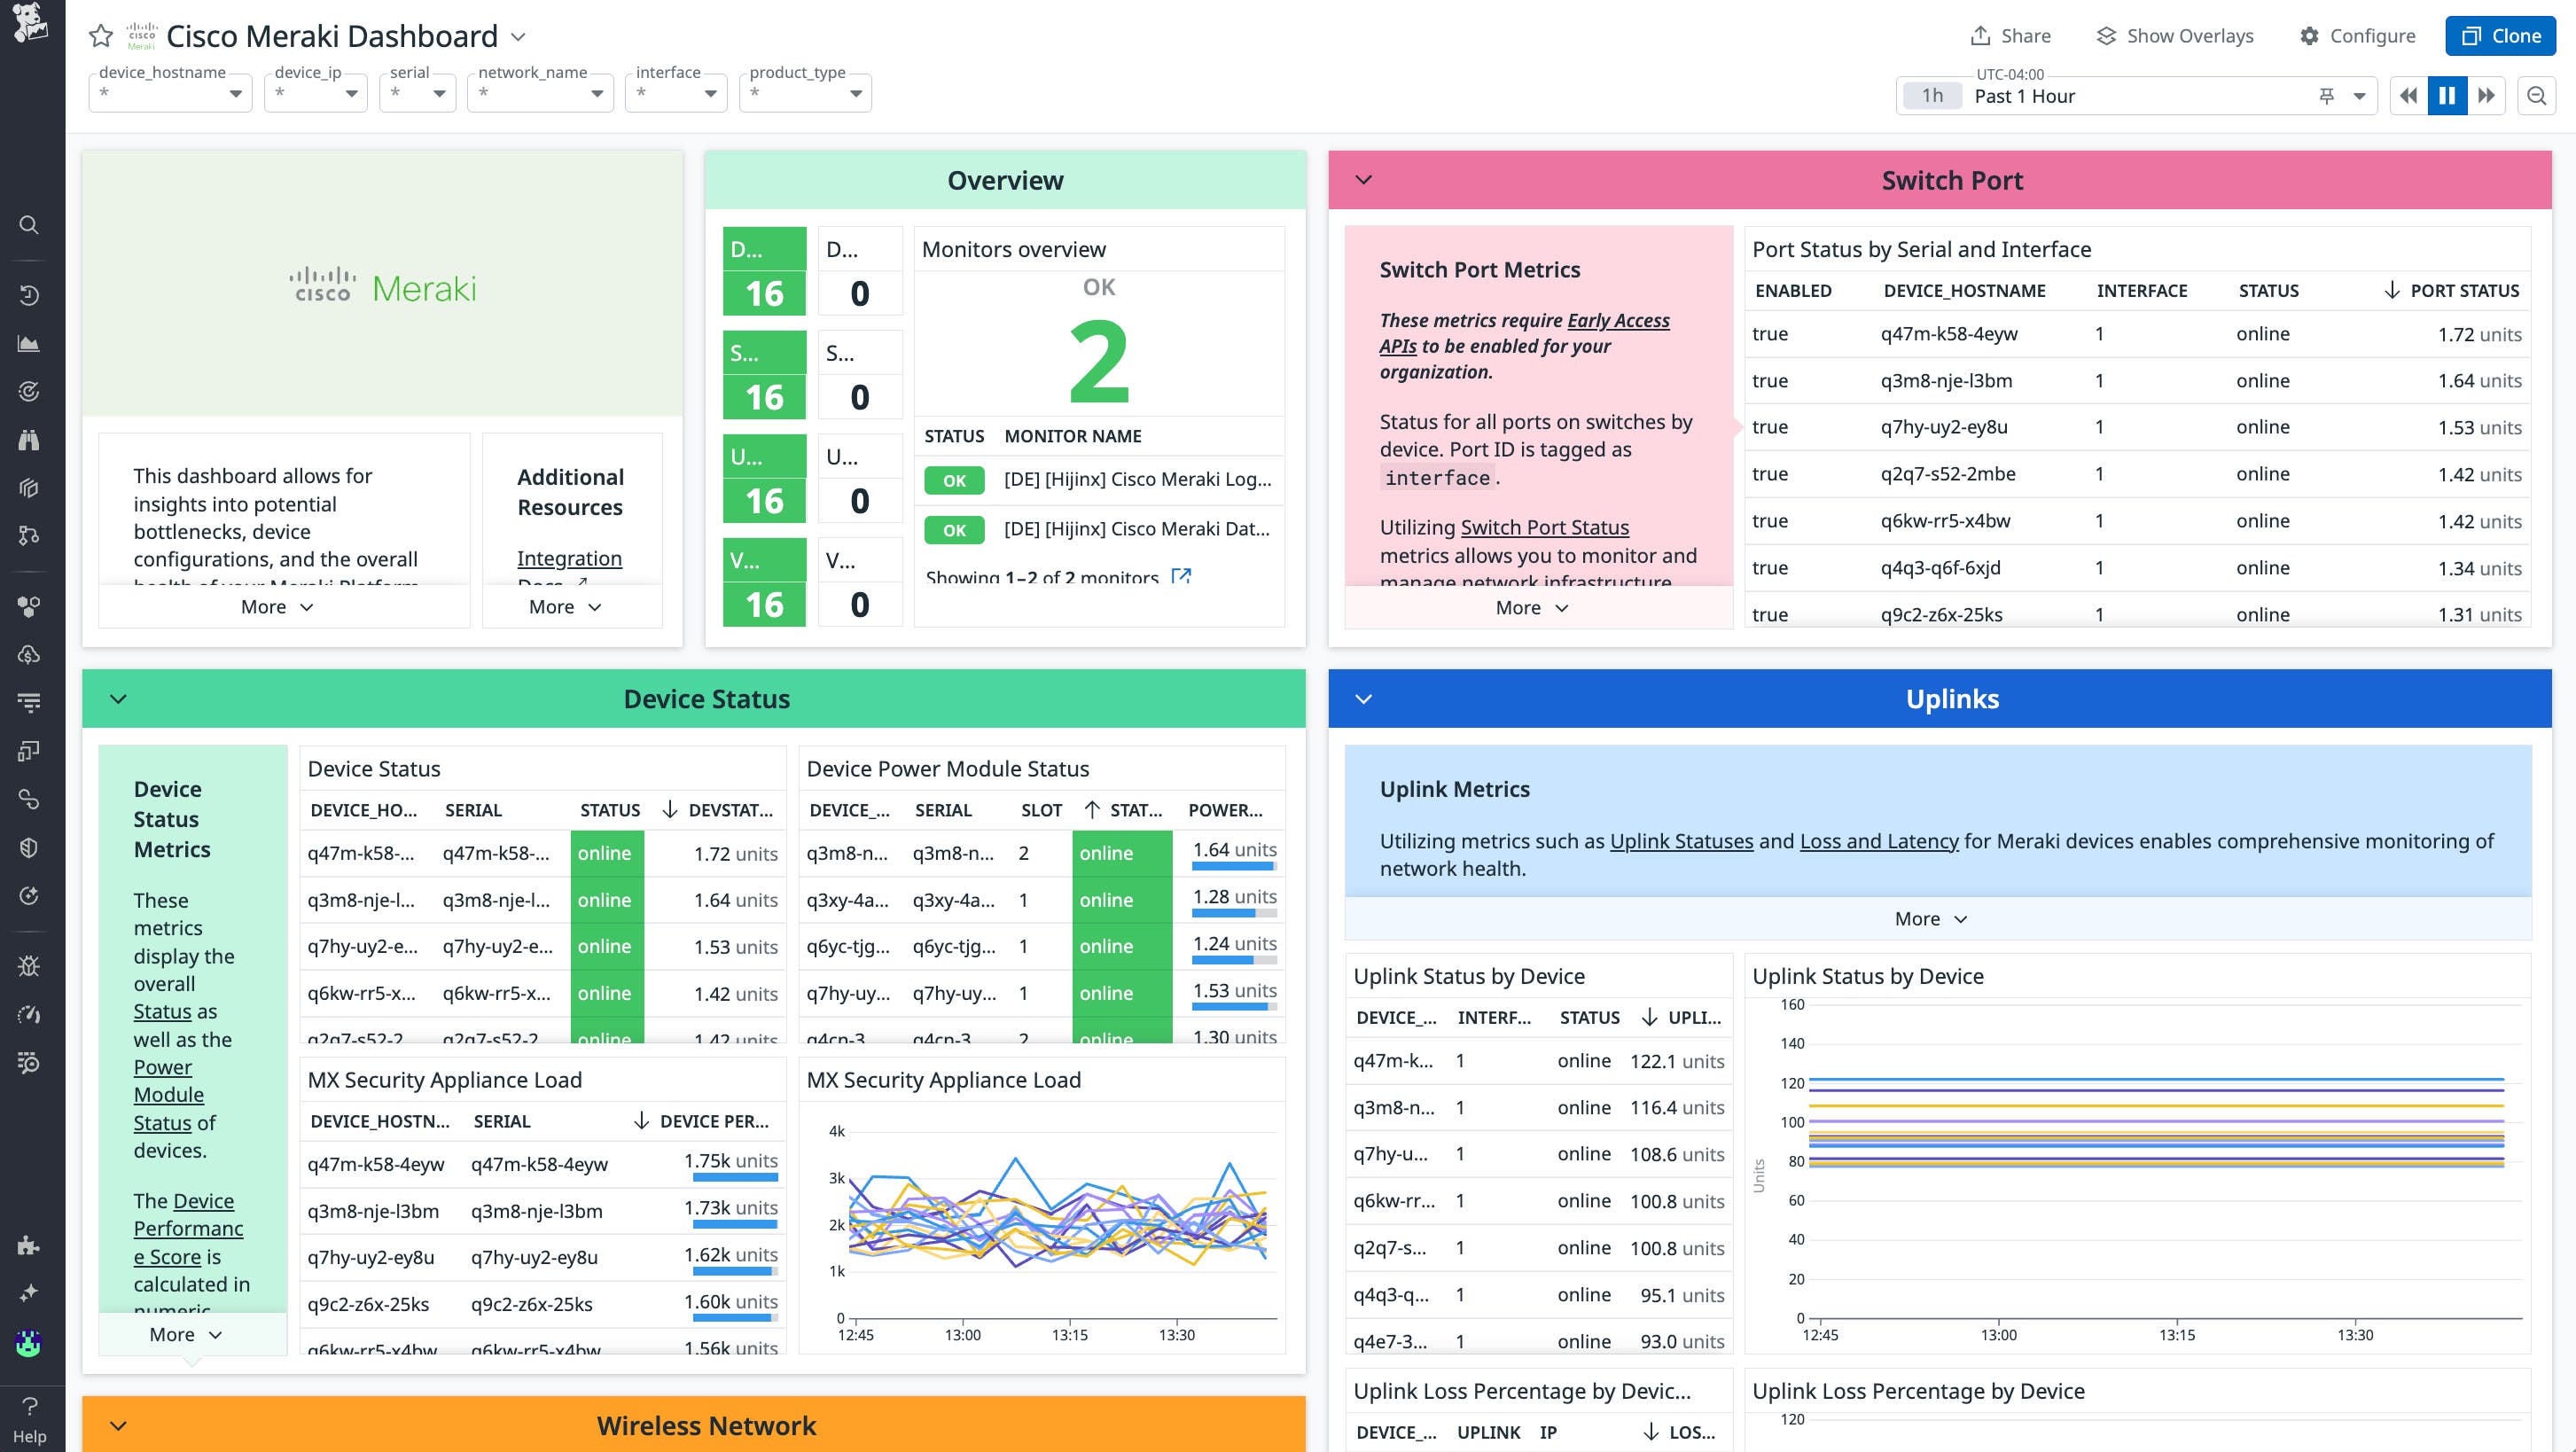
Providing actionable insights into cloud-managed networks such as Cisco Meraki is especially useful for organizations with distributed branches, remote offices, or retail deployments. Datadog integrates directly with the Meraki API to pull telemetry data from key devices, including MX security appliances, MS switches, and MR wireless access points, which allows teams to monitor their entire Meraki fleet from a single platform.
With Datadog Network Device Monitoring (NDM), teams can quickly identify and troubleshoot Wi-Fi performance issues, bandwidth bottlenecks, and connectivity problems. NDM includes a Meraki dashboard that surfaces critical metrics such as uplink utilization, VPN status, latency, packet loss, and device-level health indicators like CPU and memory usage. This visibility enables network teams to proactively detect anomalies, optimize performance, and maintain reliable connectivity across all locations.
For instance, if employees at a remote office report poor Wi-Fi performance, the Meraki dashboard can show whether a specific MR access point is overloaded or experiencing high packet loss. This helps network teams quickly identify the affected device and resolve the issue without needing to send someone on-site.
Troubleshoot issues and optimize performance for Cisco ACI
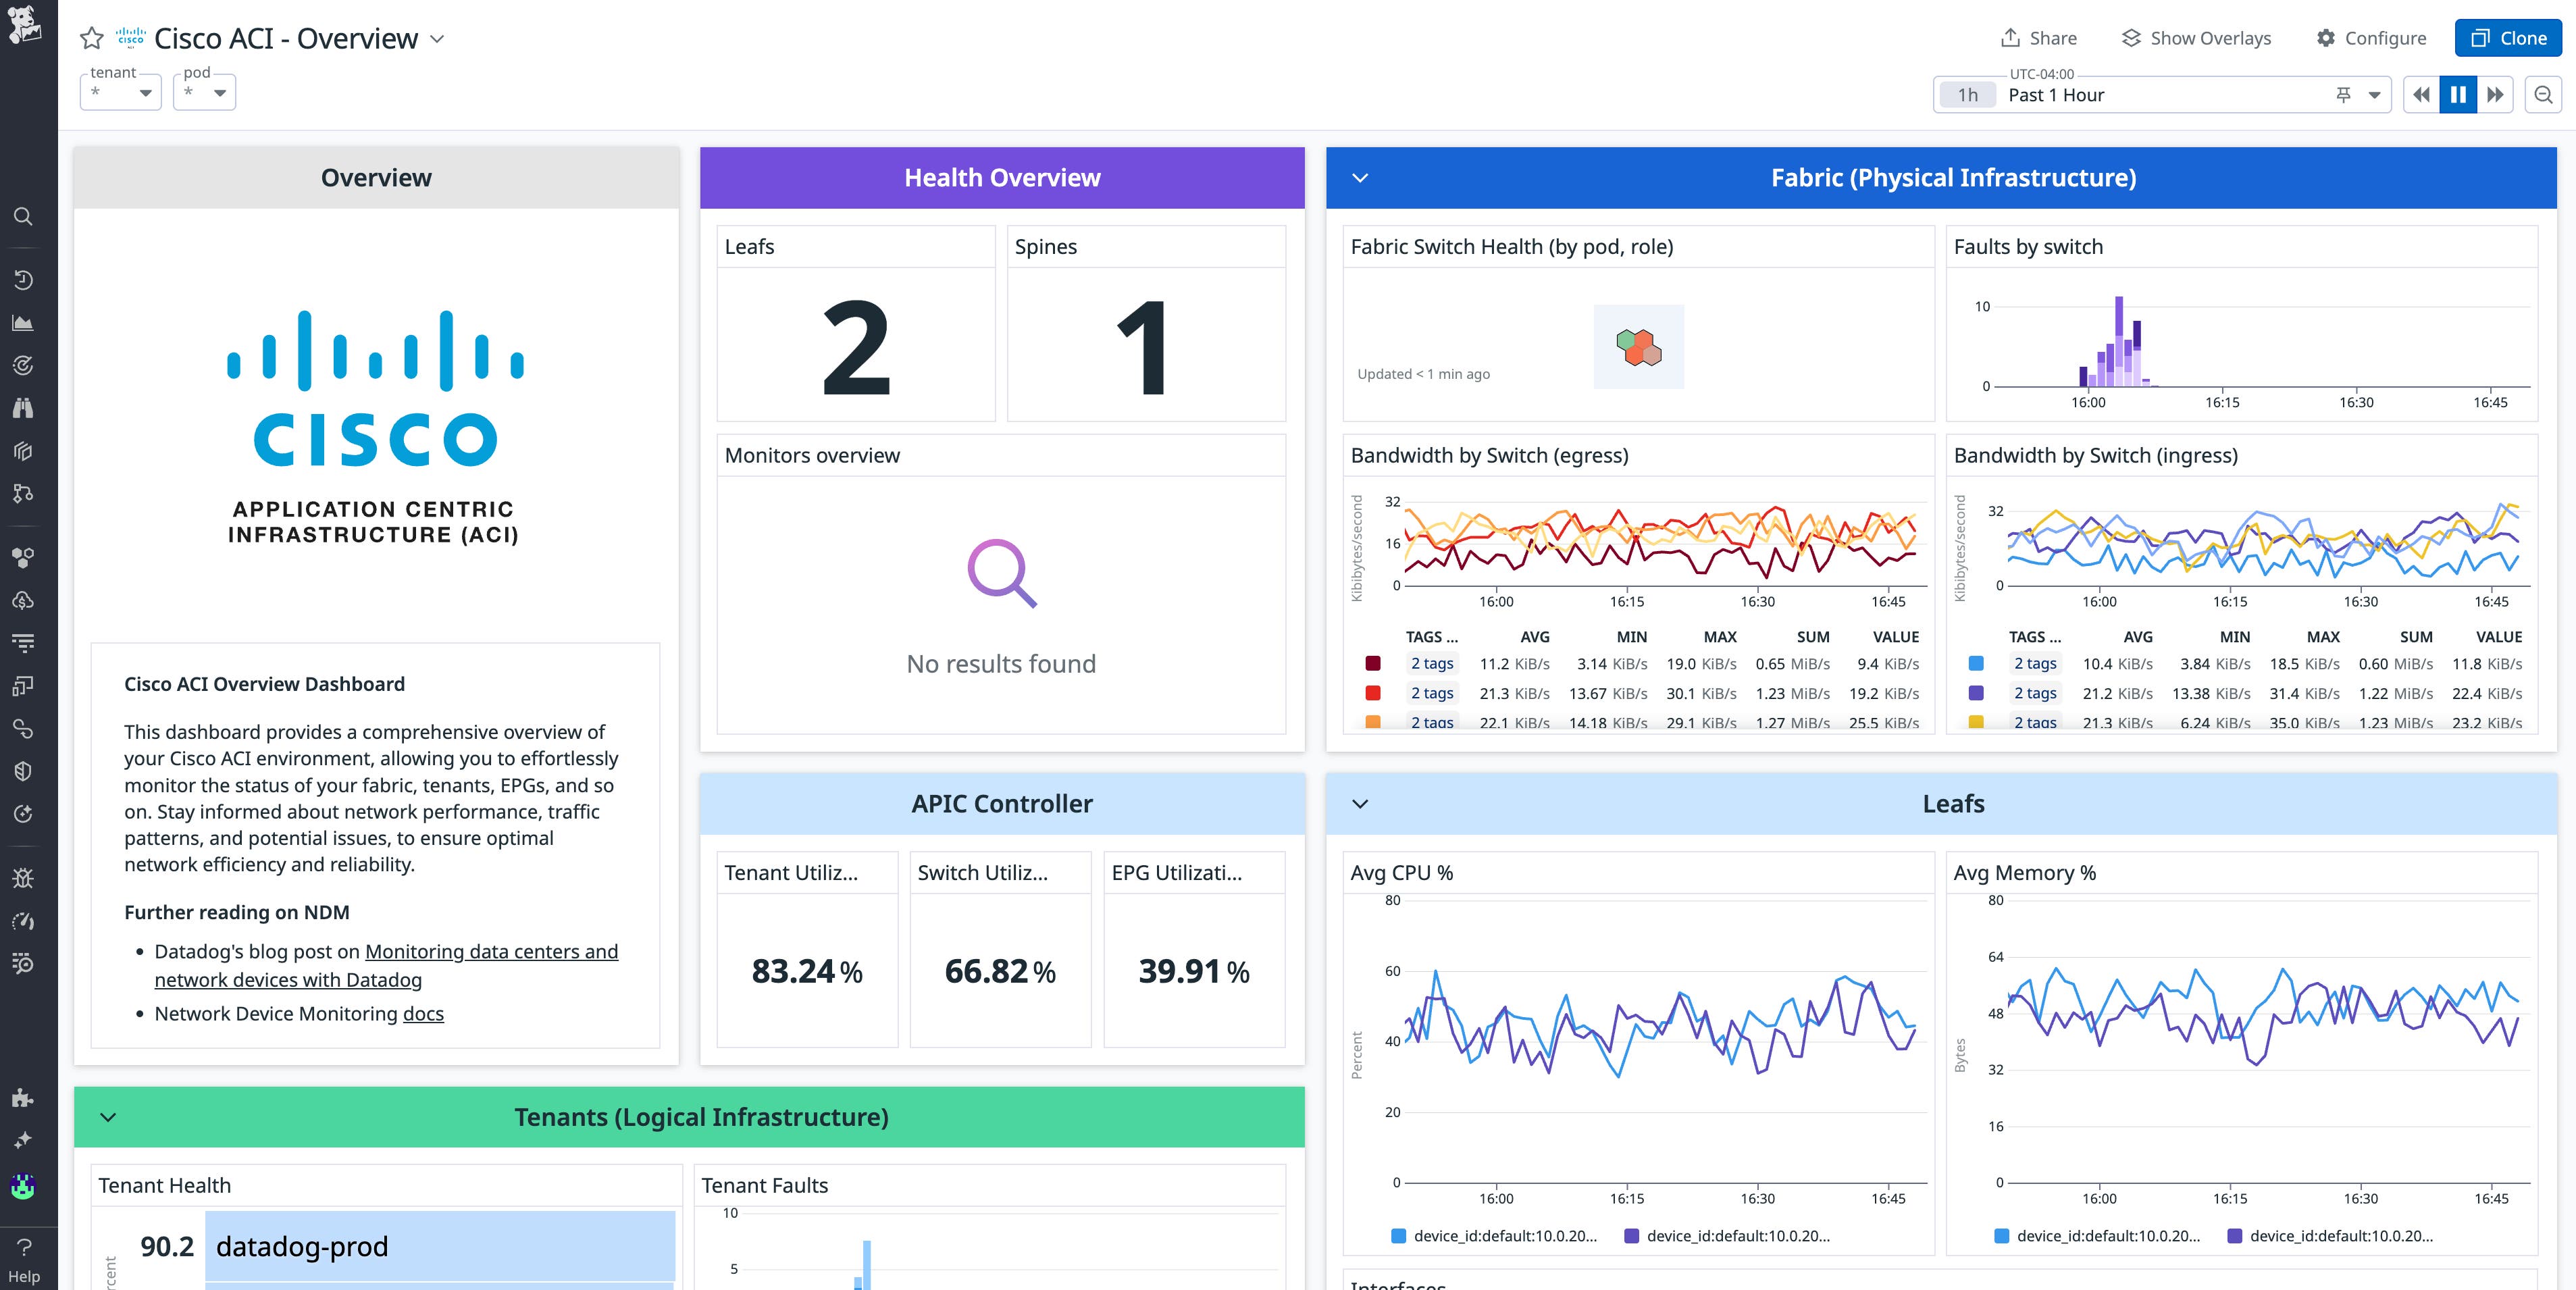
Cisco ACI is a software-defined networking solution that simplifies and automates data center operations by using policy-driven controls across physical and virtual environments. Datadog’s Cisco ACI integration gives enterprises end-to-end visibility into the health of both the physical and logical network fabric—including leaf and spine switches, APIC controllers, and endpoint groups (EPGs), which define how applications and services communicate within the data center. Datadog helps teams monitor communication between EPGs, making it easier to troubleshoot issues tied to shared policies or misconfigured access controls. Additionally, Datadog provides detailed health metrics across ACI tenants, applications, and the overall fabric, enabling teams to proactively detect issues, optimize performance, and maintain consistent application delivery.
Start monitoring software-defined networks with Datadog today
With Datadog Network Monitoring, IT organizations can realize the full potential of software-defined networks to achieve high performance and operational efficiency. To learn more about our SDN monitoring capabilities and related integrations, check out our documentation.
And if you’re not yet a Datadog user, you can get started today with a 14-day free trial.


