Jordan Obey
Amazon SageMaker is a fully managed service that enables data scientists and engineers to easily build, train, and deploy machine learning (ML) models. Whether you are integrating a personalized recommendation system into your video streaming application, creating a customer service chatbot, or building a predictive business analytics model, Amazon SageMaker’s robust feature set can simplify your ML workflows.
Inefficient or underperforming ML inference endpoints can negatively impact end user experiences and hurt your bottom line. This means that for any use case, monitoring the performance and resource utilization of your ML inference endpoints is critical for ensuring that your models are available, reliable, and capable of delivering accurate inferences quickly.
Similarly, you need visibility into the performance and resource utilization of the various jobs SageMaker executes, such as training models, processing datasets, and running batch inferences. This will help you ensure SageMaker jobs are running efficiently and cost-effectively.
Datadog enables you to collect, visualize, and alert on Amazon SageMaker metrics so you can flag issues quickly and identify opportunities to improve the performance of your ML endpoints and jobs. In this post, we’ll go over key SageMaker performance and resource utilization metrics that you can visualize and alert on with the out-of-the-box dashboards for our SageMaker integration.
Monitor the performance and resource usage of your SageMaker endpoints
After you have trained and deployed an ML model with SageMaker, client applications can send data to and receive inferences from the model via requests to a specified endpoint. Endpoints are the primary mechanism client applications use to interact with your ML models. Therefore, monitoring them is important for ensuring that inferences are delivered quickly and resources are used efficiently.
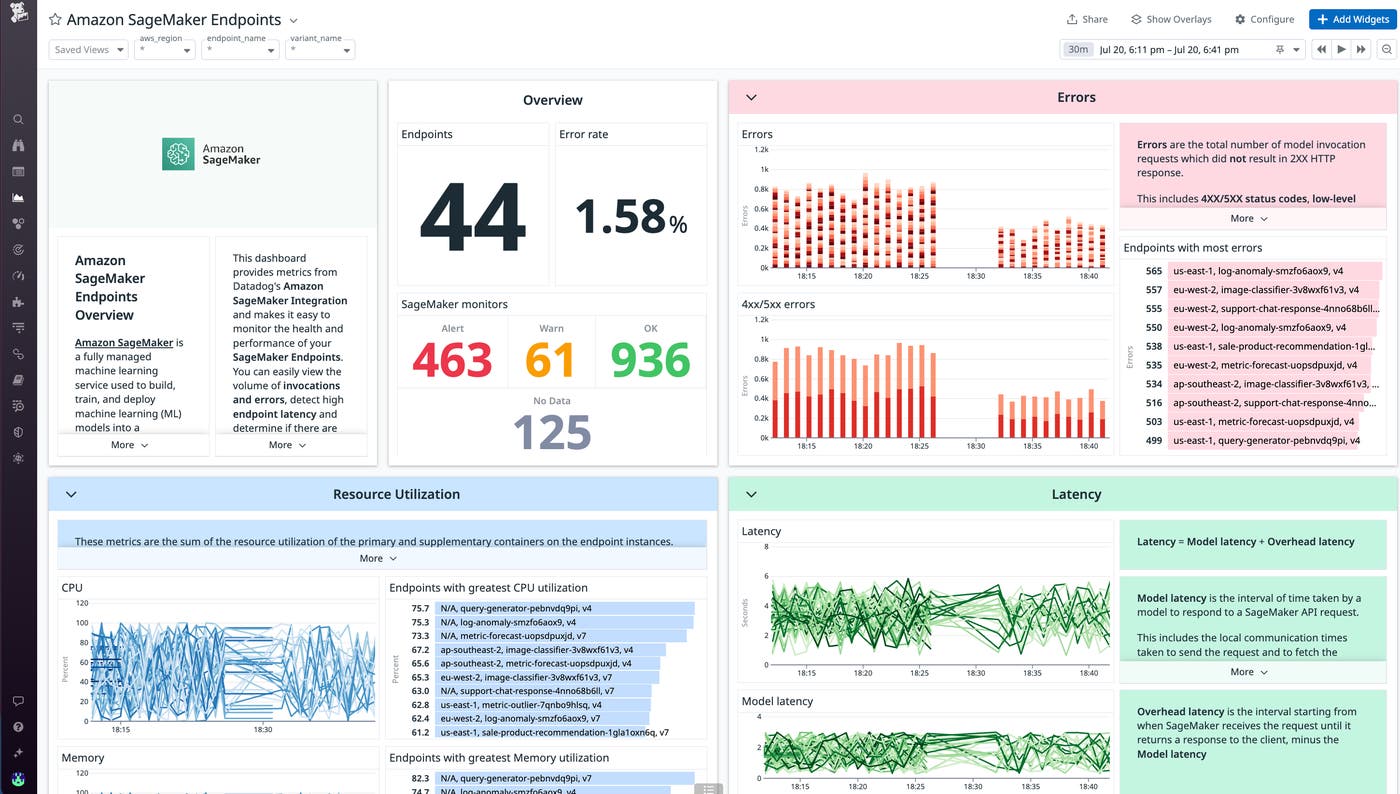
Datadog collects four categories of endpoint metrics: latency, error, resource utilization, and invocations. These metrics are all visualized on a single out-of-the-box dashboard so you can quickly flag issues and identify opportunities to improve the performance of your endpoints. For example, you can immediately see a sudden spike in total errors and whether they are client-side 4xx errors or server-side 5xx errors that need investigating.

For use cases that require real-time responses to user input—such as customer service chatbots, gaming AIs, and responsive recommendation systems—it is essential for latency to be kept as low as possible. With Datadog, you can set a threshold alert to notify you when the average amount of time it takes for a model to fully process a request and produce an inference (aws.sagemaker.model_latency) becomes too high. You can then take steps toward mitigation such as optimizing your inference code or the compute instance types. For example, if you are deploying a deep learning model, you might want to switch to an instance type that uses GPU accelerators such as AWS Inferentia, which can help lower model latency.

The SageMaker integration and dashboard include utilization metrics for the CPU, memory, disk, GPU, and GPU memory resources that are critical to your endpoints. Monitoring and alerting on these resource utilization metrics will help you make sure your endpoints are using available resources efficiently. It can also help you make scaling decisions. If, for example, memory utilization (aws.sagemaker.endpoints.memory_utilization) is consistently approaching 100 percent, you can configure your instances with higher memory capacity or add more overall instances to distribute the workload.
Monitor the resource utilization of your SageMaker jobs
SageMaker categorizes machine learning tasks into three types of jobs:
- Processing jobs, which are responsible for pre-processing the datasets that are used to train your ML models
- Training jobs, which are responsible for running the scripts/tasks that train ML models
- Transform jobs, which are responsible for processing and making inferences on very large datasets (i.e., batch inferences)
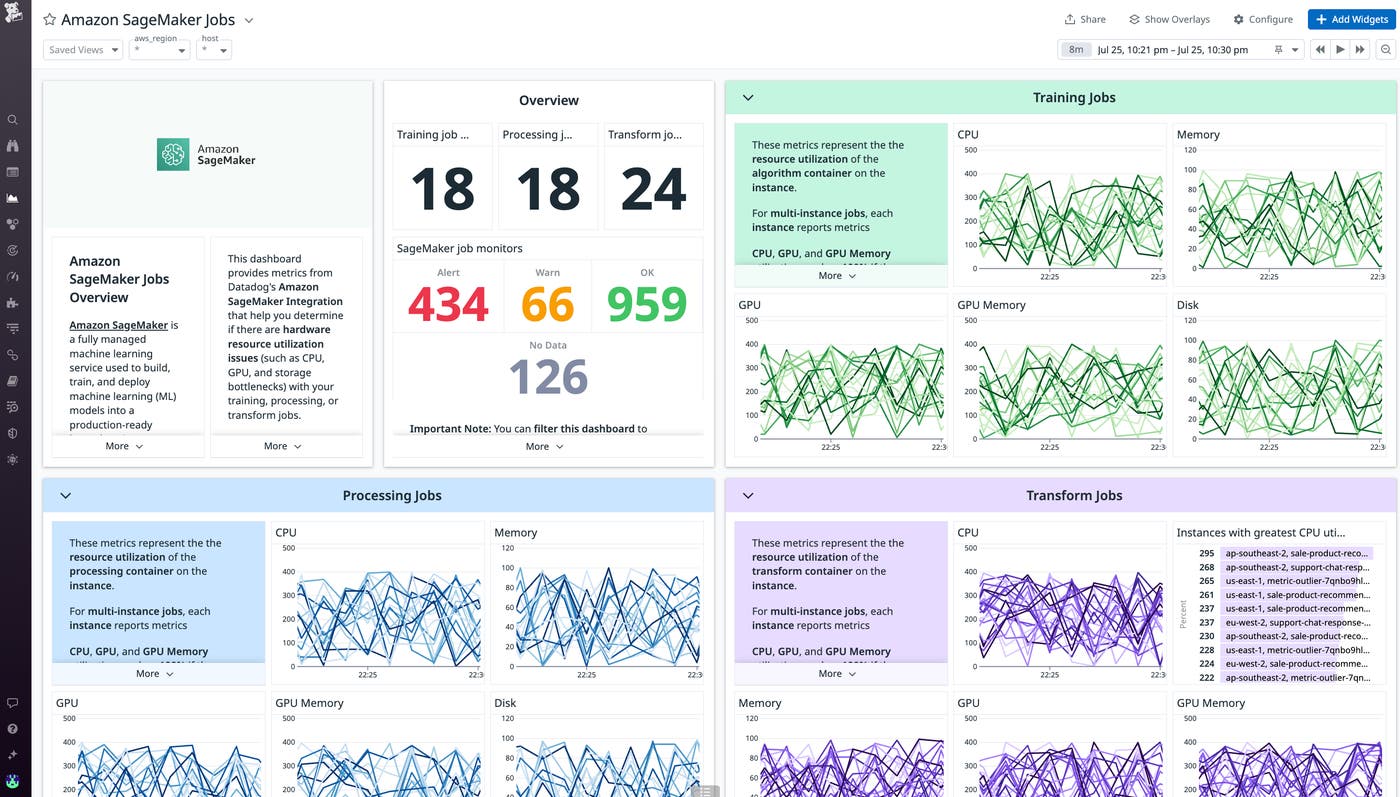
These jobs all rely on AWS resources to execute reliably. Datadog’s SageMaker Jobs dashboard will help you identify any bottlenecks or resource contention issues that may be impacting the speed and efficiency of your jobs.

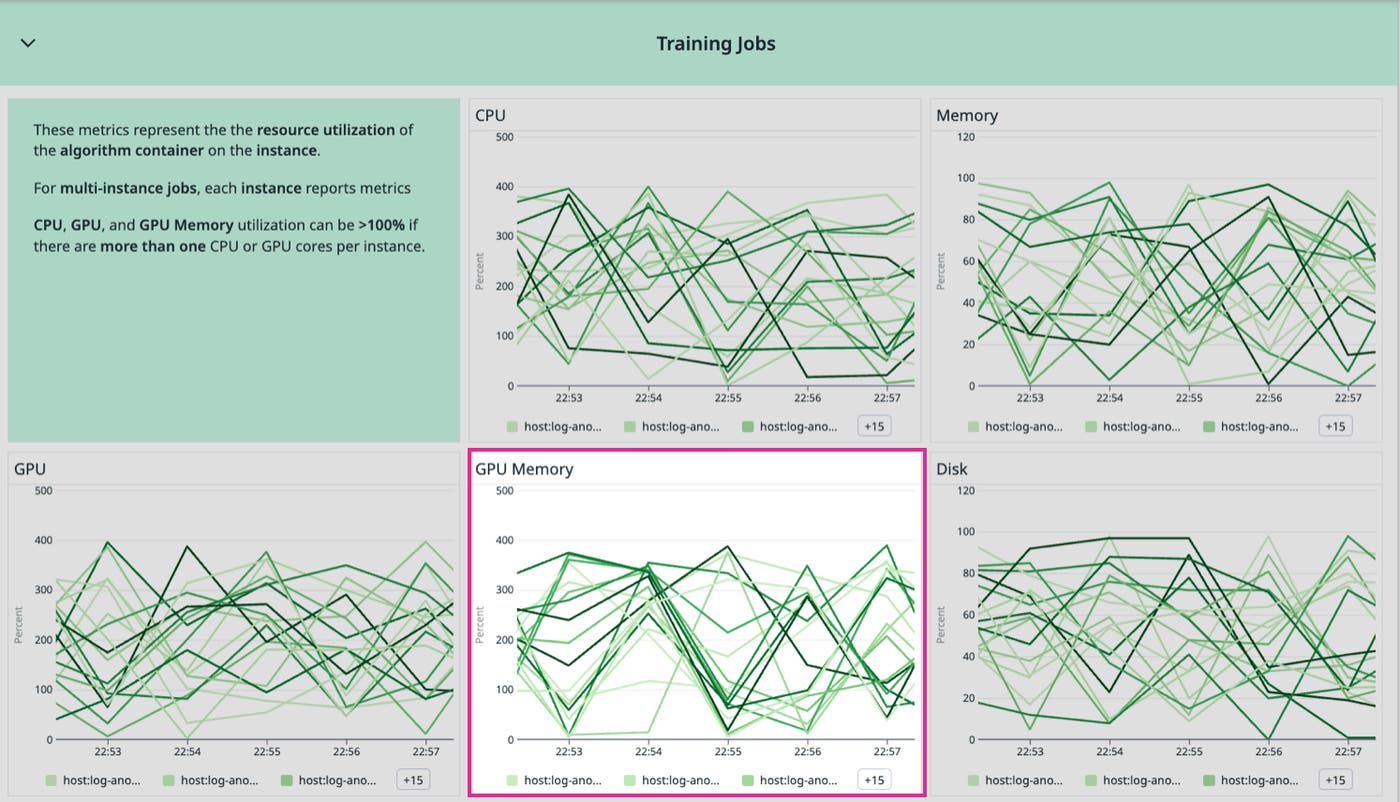
The GPU memory utilization of training jobs is particularly important to monitor because the GPU significantly accelerates model training through parallel processing. Alerting on high GPU utilization for training jobs (aws.sagemaker.trainingjobs.gpu_memory_utilization) is important because high GPU utilization can be a bottleneck on the time it takes to train your models and may lead to job failures.

The SageMaker Jobs dashboard also includes template variables to enhance investigations. For instance, you can use the host template variable to filter to specific jobs or the regions template variable to see the resource utilization of jobs running in a specific AWS region.
Start monitoring SageMaker endpoints and resources today
More ML and AI models are launched into production every day, which means it must be a top priority to make sure that they are performing optimally and have the resources they need to do so. Datadog’s SageMaker integration enables you to easily visualize key performance and utilization metrics to maintain the health and performance of your ML models. We offer more than 1,000 integrations so you can monitor SageMaker metrics alongside telemetry from the rest of your AI stack, as well as any other AWS services you may be using such as Amazon S3, AWS Lambda, and Amazon RDS.
If you aren’t already a Datadog customer, sign up today for a 14-day free trial.


