Paul Gottschling
RethinkDB is a document-oriented database that enables clients to listen for updates in real time using streams called changefeeds. RethinkDB was built for easy sharding and replication, and its query language integrates with popular programming languages, with no need for clients to parse commands from strings. The open source project began in 2012, and joined the Linux Foundation in 2017.
As with any database, RethinkDB is a critical infrastructure component that you’ll want to run at maximum performance and with minimal interruption. We are pleased to announce Datadog’s RethinkDB integration, which gives you granular visibility into your database servers, tables, and shards, helping ensure the health and performance of your RethinkDB deployment.
Understand your database activity
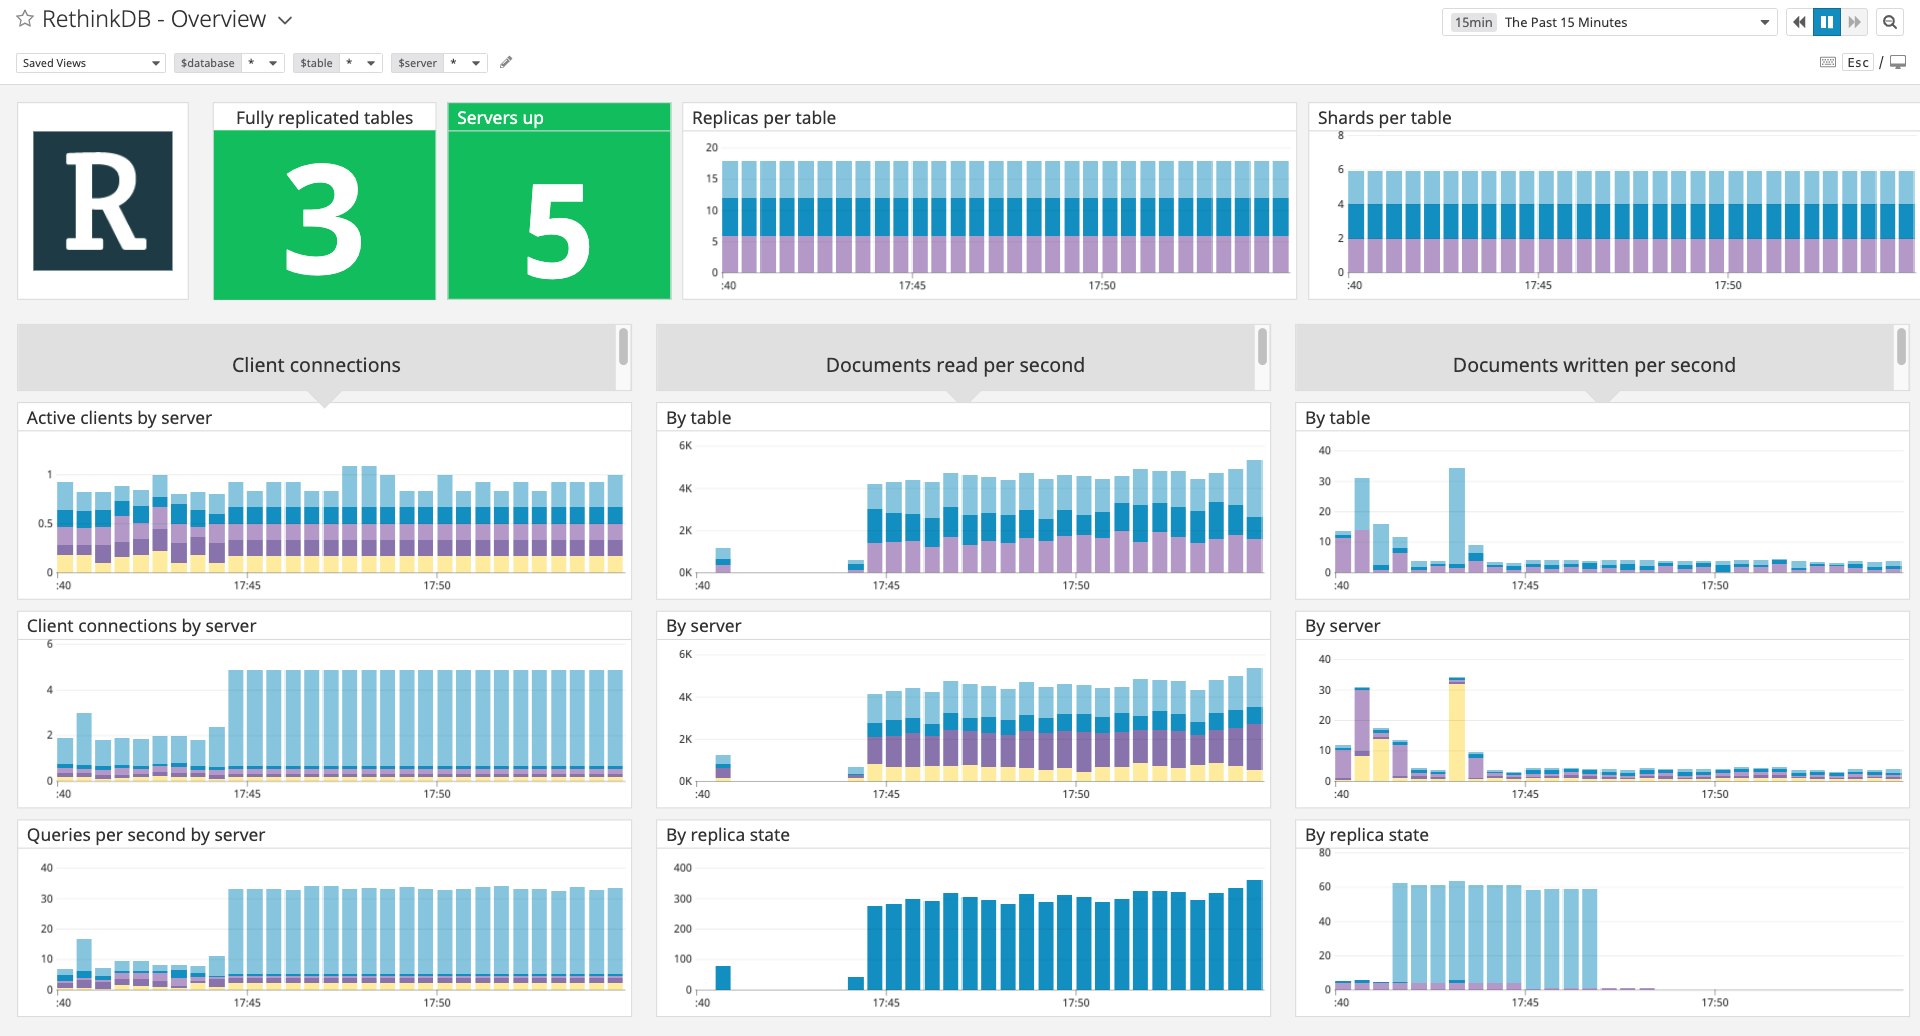
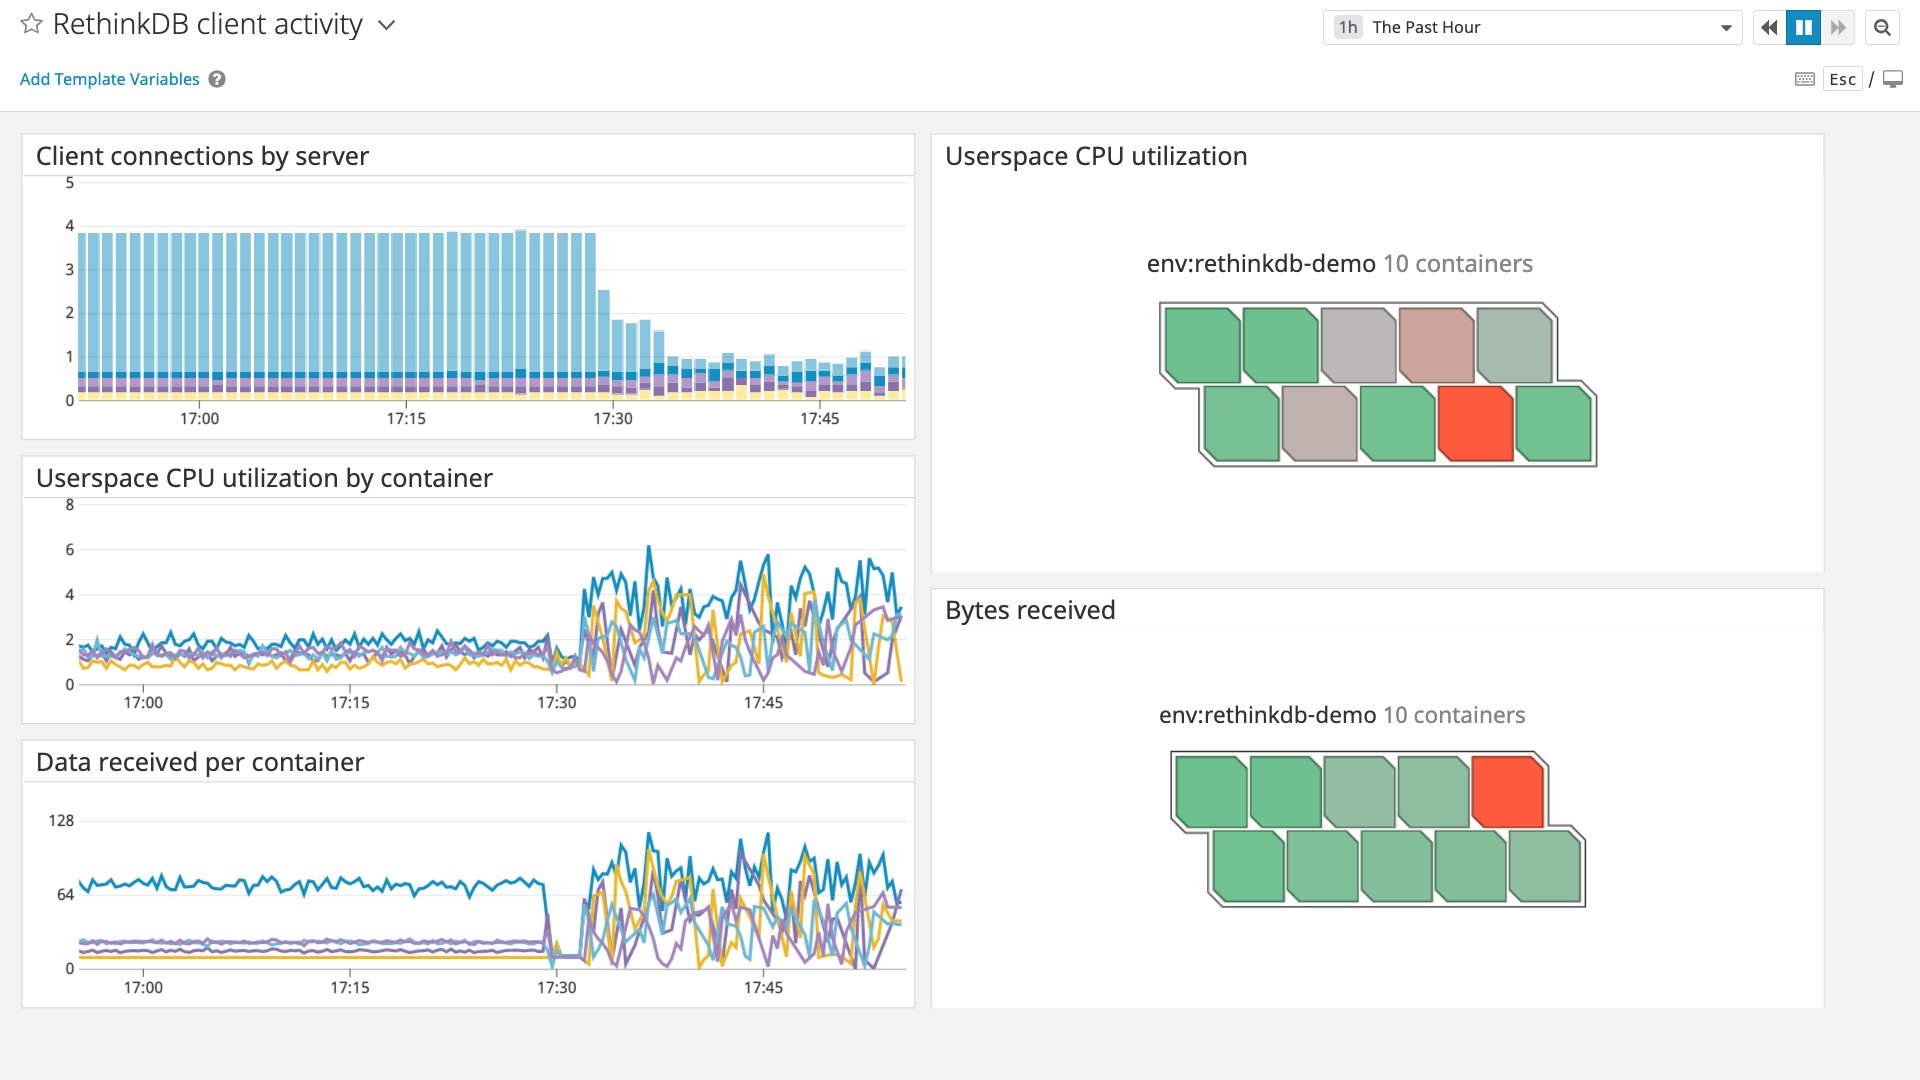
While RethinkDB can support thousands of concurrent connections, you will want to track client activity within your deployment so you can maintain optimal performance. Datadog’s RethinkDB integration automatically queries RethinkDB’s system statistics tables to provide detailed information on the current number of clients and client connections. An out-of-the-box log processing pipeline also enriches all of your RethinkDB logs with useful metadata (e.g., server and table names), helping you get context into connection issues.
You can customize our out-of-the-box dashboard to visualize activity and understand when your database tends to receive high or low traffic—and quickly spot anomalies. If traffic changes unexpectedly, you can identify possible causes and effects by correlating connection counts with resource utilization metrics from your VMs, containers, and major cloud services, as well as metrics from 1,000 other integrations.
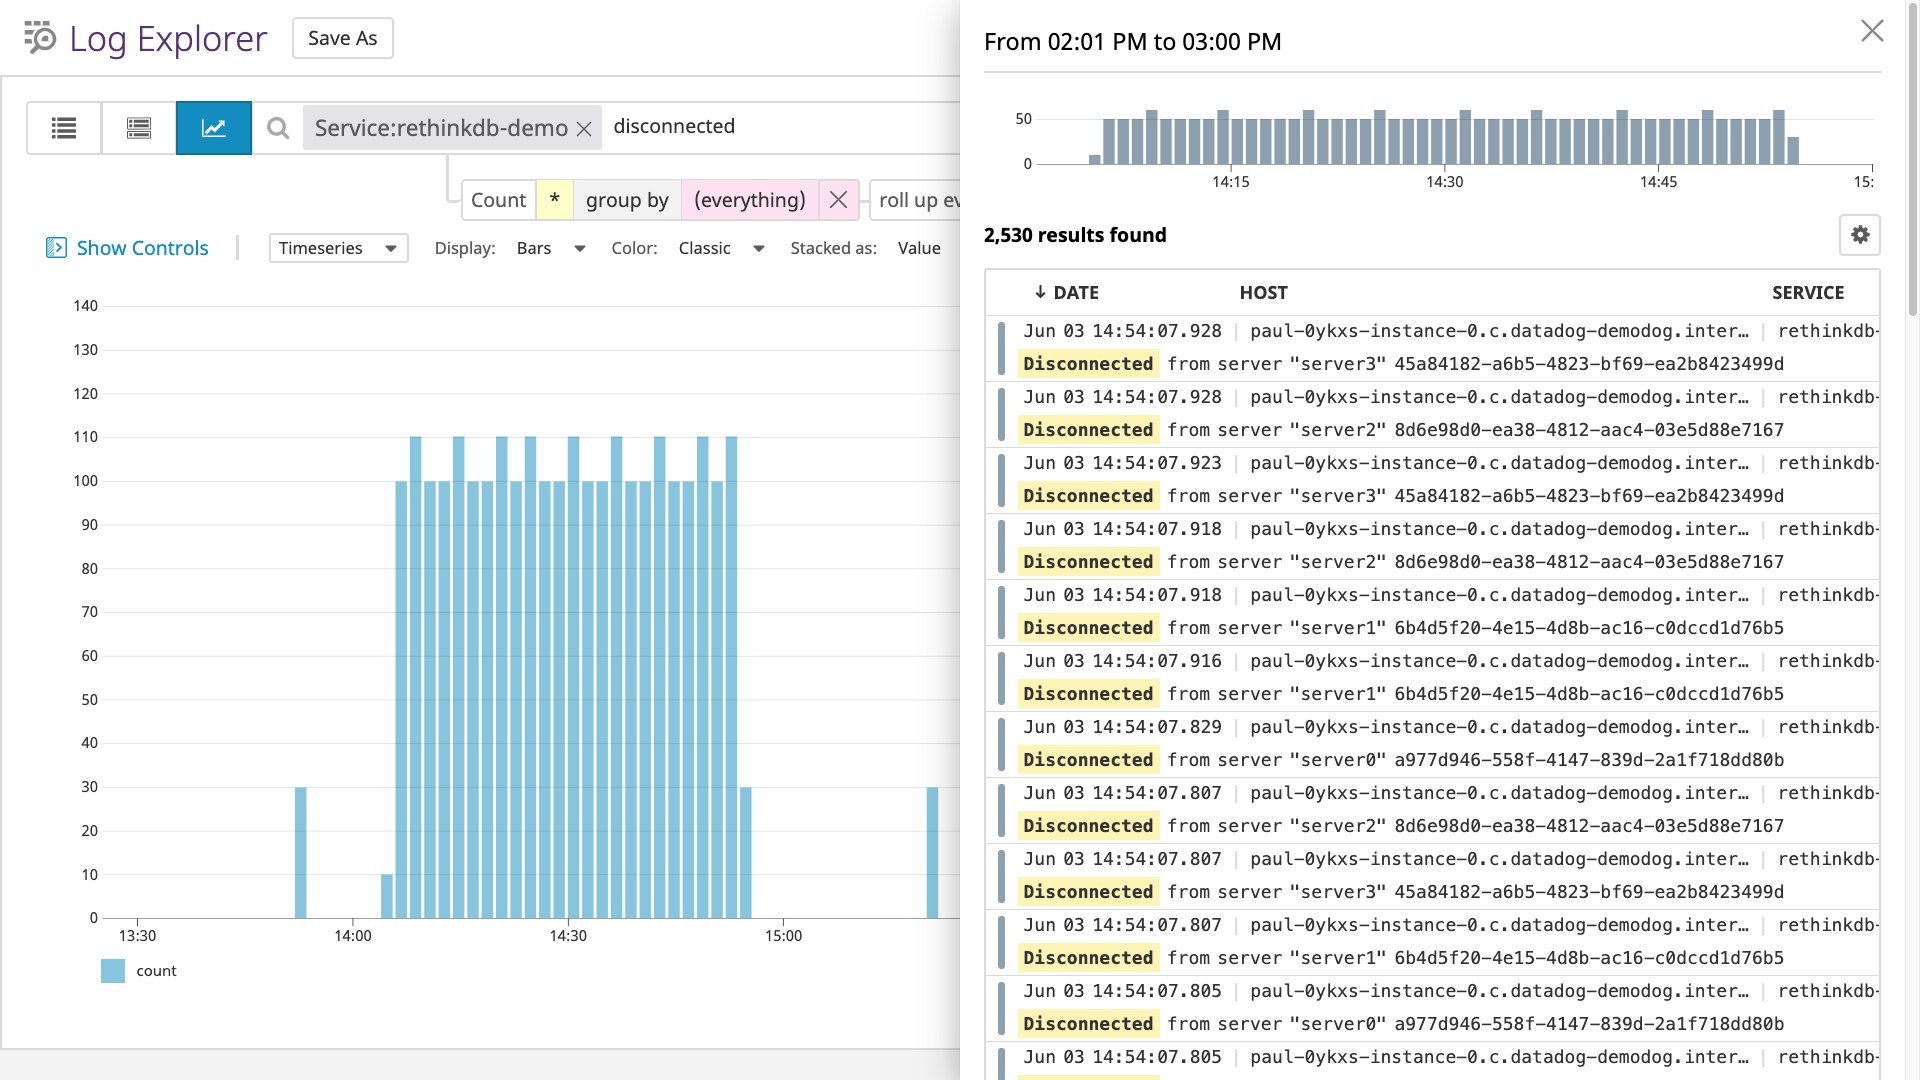
And if client connections decline unexpectedly, you can use Datadog to analyze your RethinkDB logs for more insight. If you see connection errors from one database instance in your cluster, for example, you can seamlessly search logs from that instance and point in time to get context.
Beyond client connection activity, you will also want to make sure that your database cluster is scaled appropriately to handle its query throughput. You can track the number of JSON documents read and written per second—at the cluster, server, and table level—to identify high-traffic areas to consider scaling out (these metrics have the name rethinkdb.stats.<cluster|server|table>.query_engine.<read|written>_docs_per_sec).
Replicate wisely
RethinkDB provides two options for scaling deployments. First, shards distribute a single database table across a number of hosts. Second, replicas deploy multiple instances of a single table. When using sharding and replication together, RethinkDB associates each shard with a primary replica. While more instances make for a more fault tolerant cluster that can serve more concurrent queries, it also gives you more hosts to monitor for health and performance.
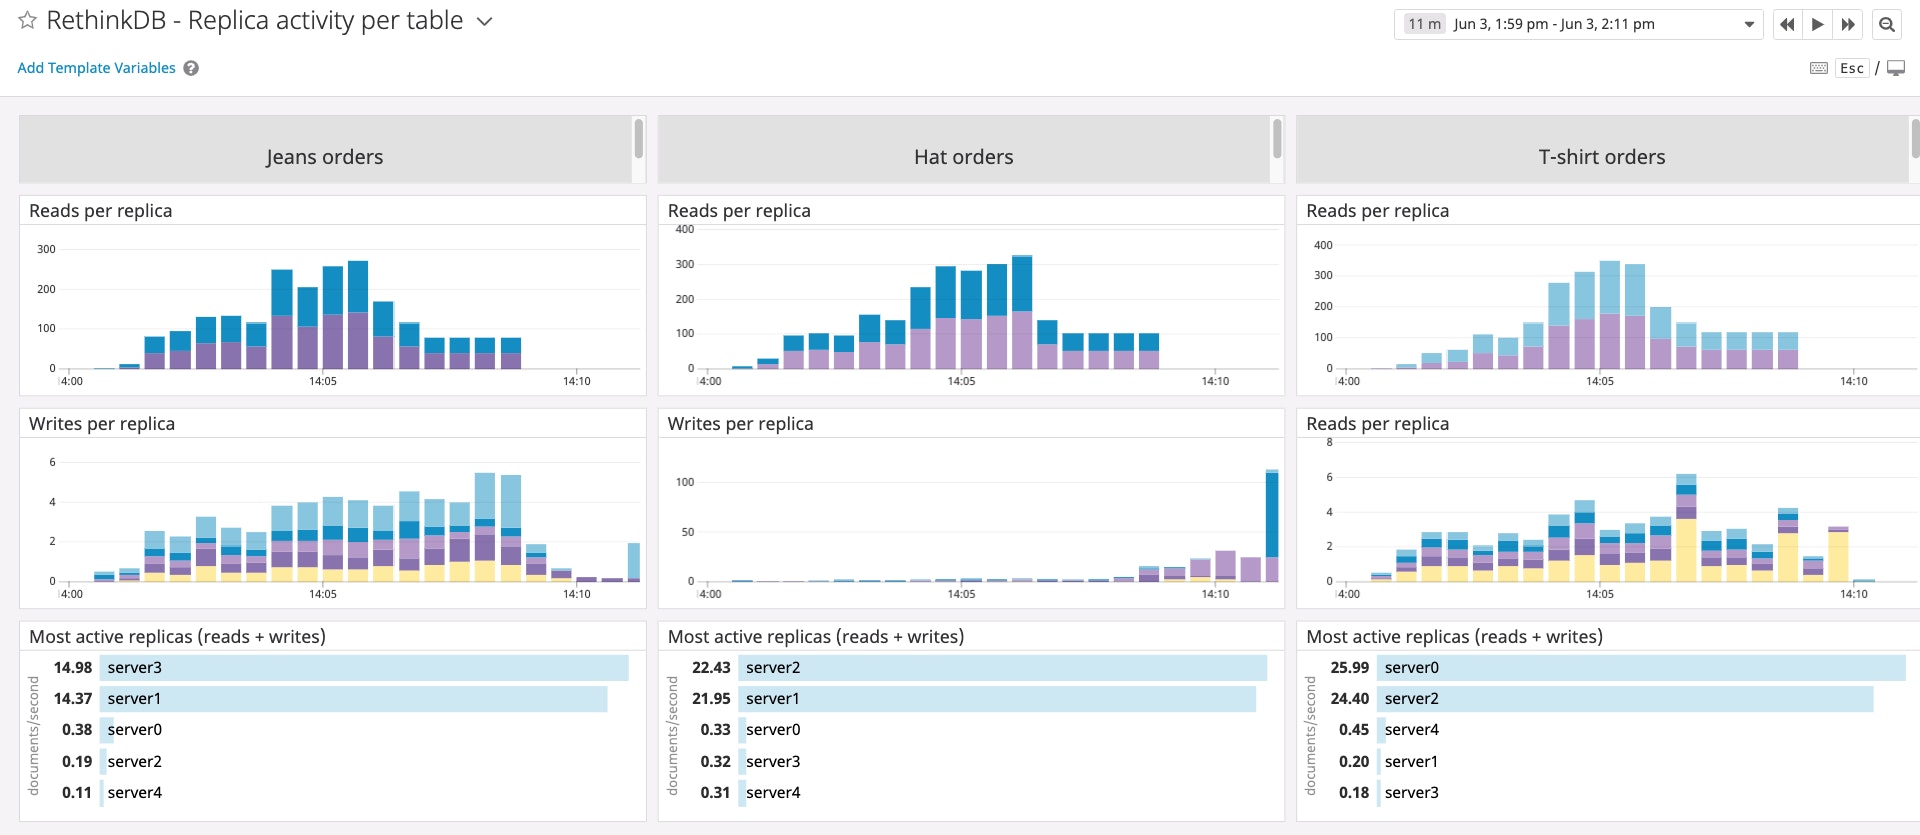
With Datadog’s RethinkDB integration, you can track the success of your replication operations so you can respond to any issues. If the number of deployed shards (rethinkdb.table_status.shards) or replicas (rethinkdb.table_status.shards.replicas) falls below expectations, you’ll know to investigate problems with your deployment. You can use the rethinkdb.table_status.status.all_replicas_ready service check to confirm that all replicas are available.
Finally, to verify whether changing your replication strategy has increased performance, you can track document read and write throughput for each replica in your cluster by grouping the rethinkdb.stats.table_server.query_engine.read_docs_per_sec and rethinkdb.stats.table_server.query_engine.written_docs_per_sec metrics by the table tag.
Ensure availability
If a RethinkDB instance goes down, you will want to know as soon as possible so you can take action. Datadog tracks server availability with metrics and service checks that you can use to set automated alerts. You can use threshold alerts to notify your team when rethinkdb.config.servers—the count of servers currently known to your RethinkDB cluster—falls below a healthy baseline. You can also use the rethinkdb.can_connect service check to get alerted on losses in availability as soon as they take place.
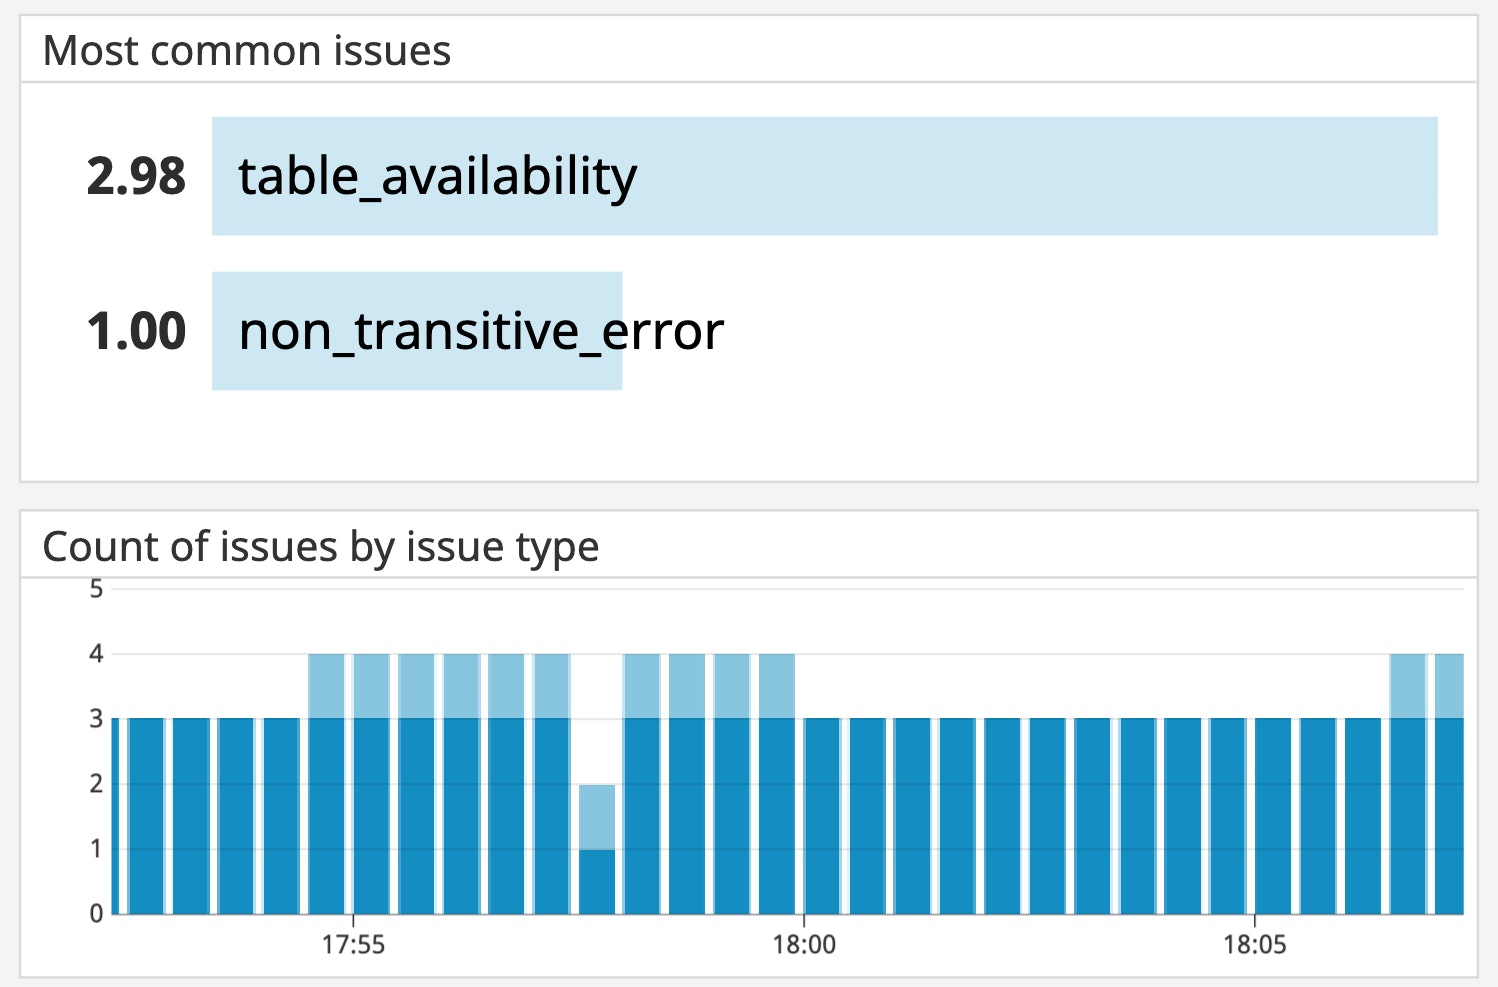
Once you know there’s an availability issue, you can use the rethinkdb.current_issues.issues metric to track problems RethinkDB has identified within your cluster, such as name collisions, outdated indexes, and connectivity trouble. You can group this metric by the issue_type tag to help prioritize your troubleshooting efforts.
Database monitoring—rethought
With Datadog’s new integration, you can collect RethinkDB metrics and logs to get comprehensive visibility into the health and performance of your database cluster. And with Datadog APM, you can instrument your applications to get even more granular insights into how your clients interact with the database, no matter which language you use for your client drivers. To get started using Datadog, sign up for a free trial.
