Jonathan Epstein
Oracle Cloud Infrastructure (OCI) is an infrastructure-as-a-service (IaaS) and platform-as-a-service (PaaS) cloud used by enterprise-scale companies. With a full suite of services for hosting, storage, networking, and more, OCI lets customers deliver, maintain, and scale secure, highly available applications. But as your cloud infrastructure becomes more complex, monitoring the full scope of activity across your services and accounts can be increasingly difficult. To help OCI users get a more comprehensive view of their cloud environments, we’re excited to announce that Datadog now integrates with Oracle Cloud Infrastructure Logging, OCI’s logging service. Oracle Cloud logs tell you the who, what, when, and where of user and service actions that occur in your OCI account, making it easy to track activity across your cloud environment and make sure that your OCI resources are secure. There are three types of OCI logs:
- Audit logs capture API events recorded by the OCI Audit service at public endpoints. All OCI services support audit logs.
- Service logs record events performed by OCI services, such as API Gateway and Load Balancing.
- Custom logs capture events performed by non-OCI sources, such as custom applications, other cloud providers, or on-premise environments.
With our new integration, OCI users can stream all of these logs directly into Datadog, where they can then be stored indefinitely, analyzed for troubleshooting, and monitored for security and compliance posturing.
Seamless OCI integration
In order to import your OCI logs into Datadog, you can configure your environment to post an event to your Oracle Service Connector Hub, Oracle’s data transfer tool, whenever a new log is written. That event triggers a function that forwards the log to Datadog. Once you’ve enabled Datadog’s Oracle Cloud Infrastructure integration and set up log collection, Datadog will begin ingesting logs from your OCI environment so that you can:
- Use key event metadata to filter and search for important events within your OCI environment like user logins and IAM permission changes.
- Visualize your log data in metrics dashboards.
- Use Threat Detection Rules to detect and alert on security vulnerabilities as they appear, so you can remedy them before they become serious issues.
Working with OCI logs
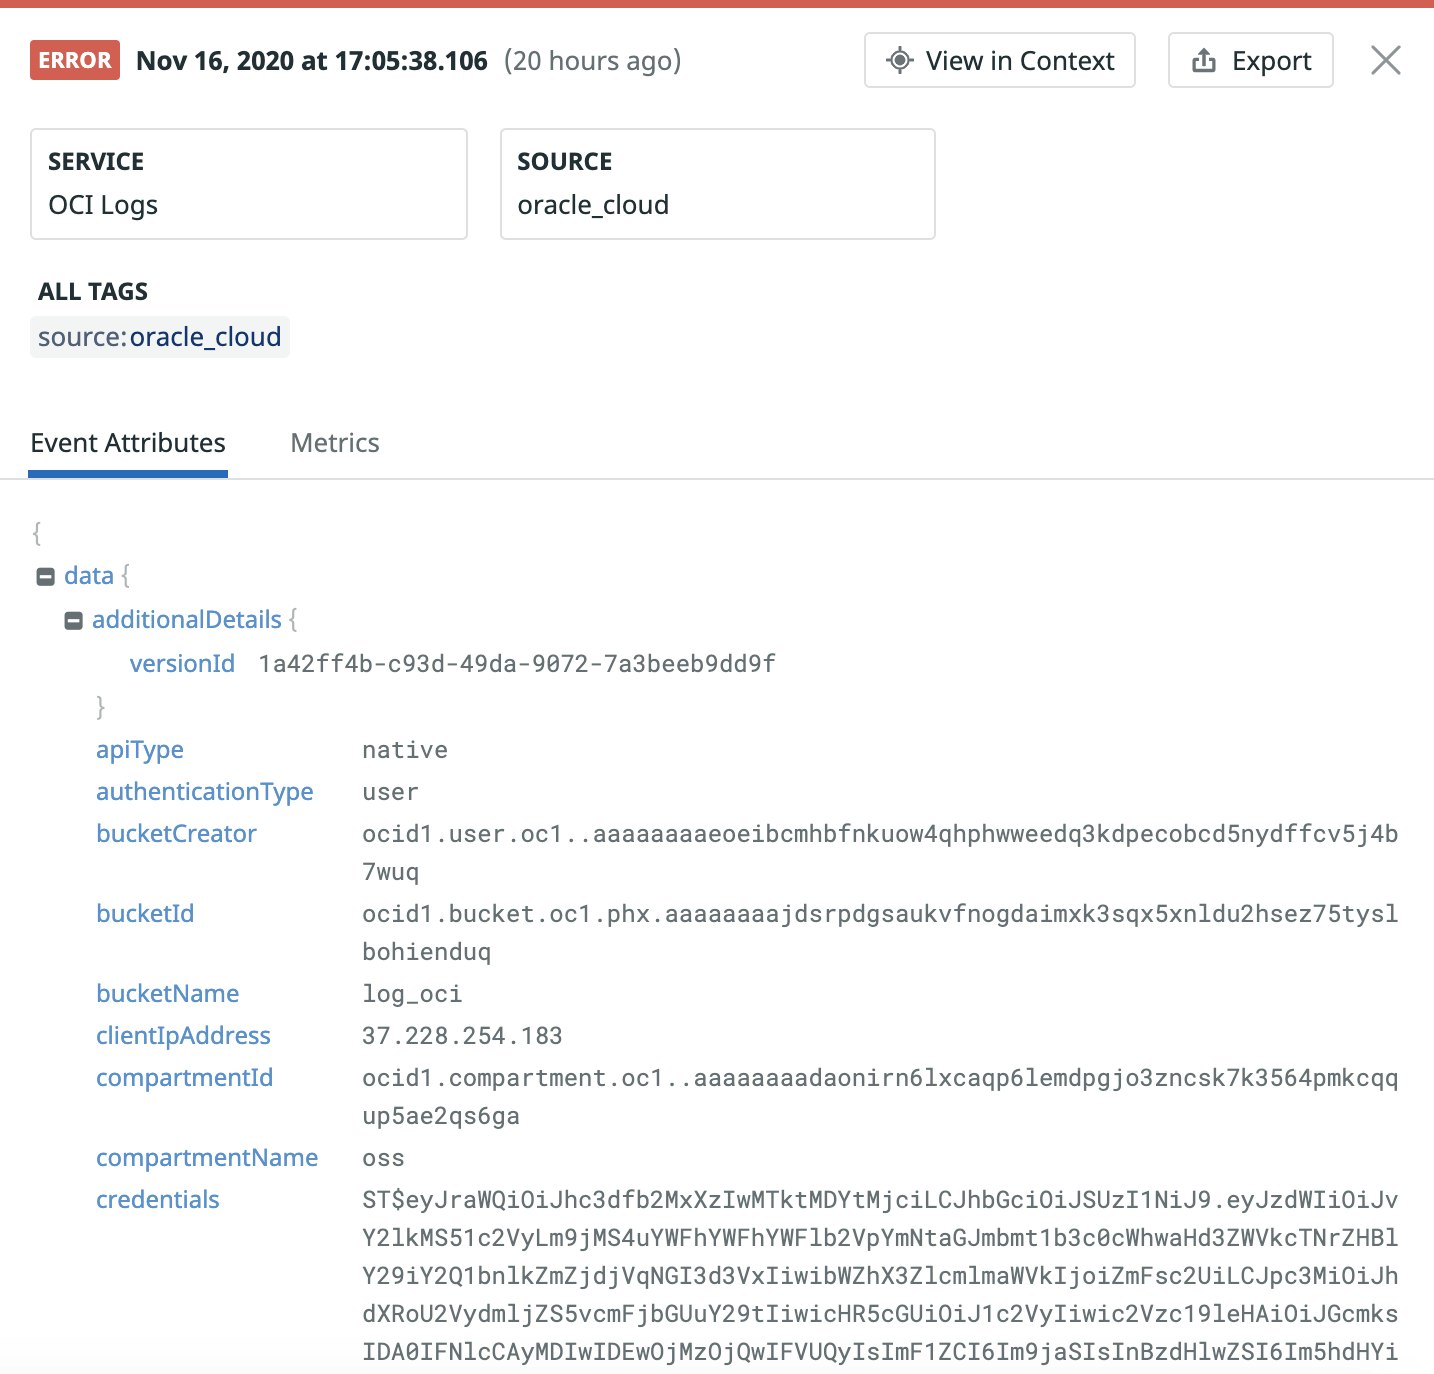
OCI logs track user and system actions across your Oracle Cloud infrastructure, including identity authentication challenges (captcha_challenge, device_fingerprint_challenge, etc.), API rate throttling (address_rate_limiting), and security threats (protection_rules, threat_intelligence_feeds). Oracle emits logs in JSON format. Each log contains identifying information that can help you track the user or service that performed an action, such as user or client IP addresses (clientIpAddress), the time at which the action was performed, and, in the case of audit logs, the API call that triggered log creation (action).
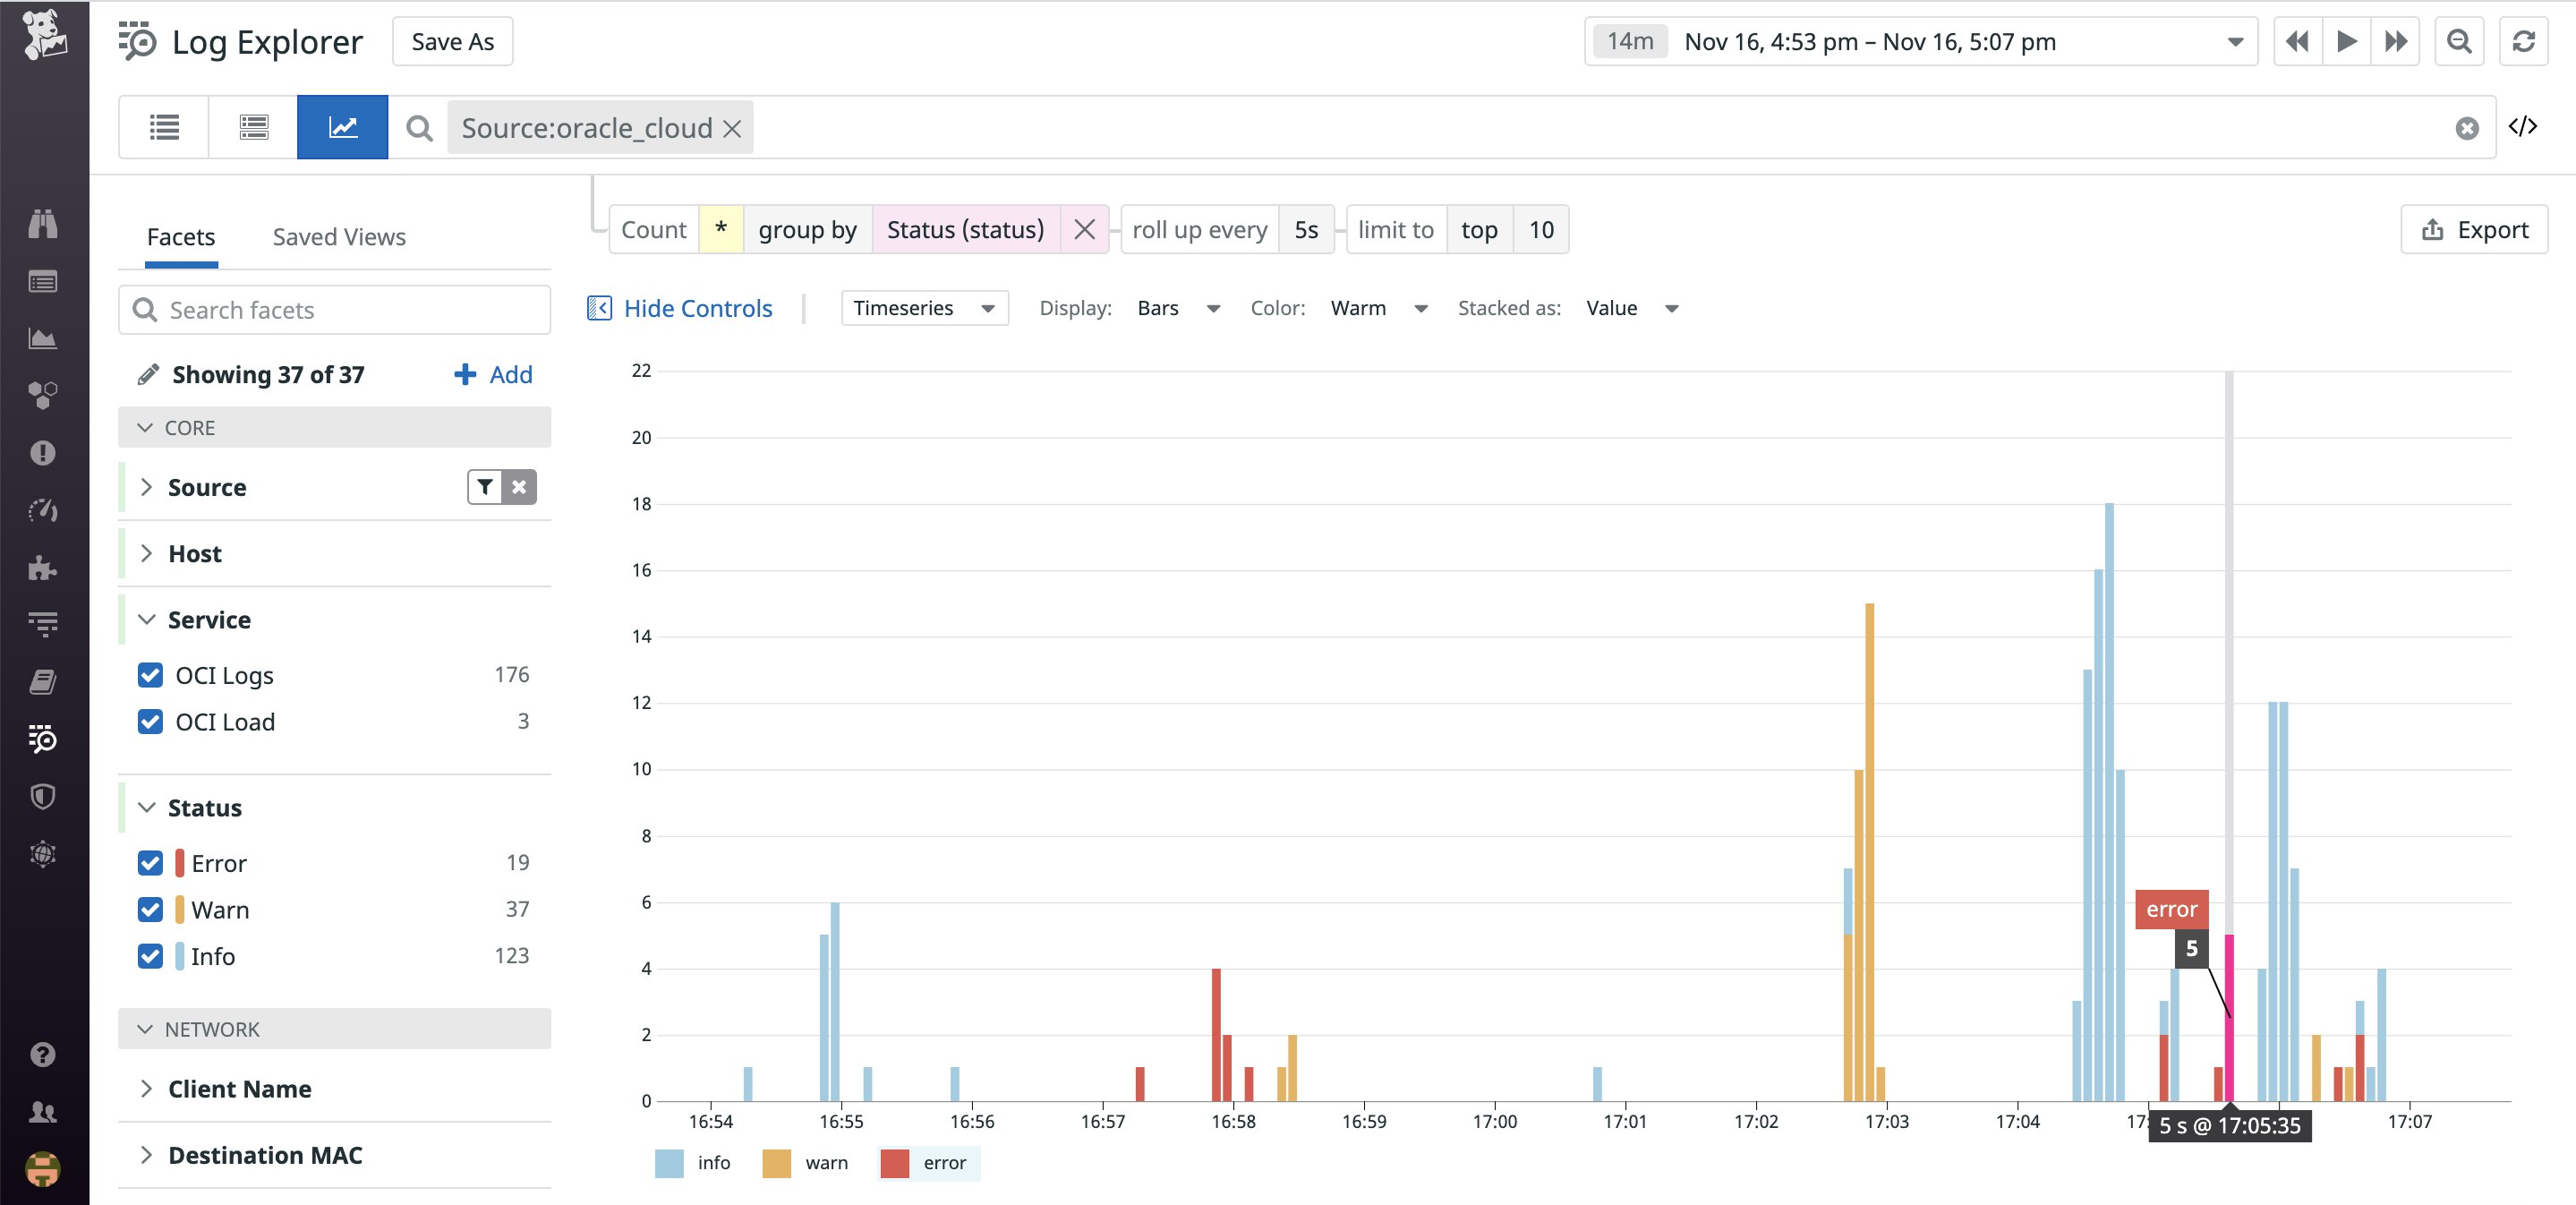
Once Datadog is ingesting your log data, you can begin exploring and analyzing it in the Log Explorer in real time. Datadog automatically parses JSON-formatted logs and extracts key log metadata as attributes that you can use to easily filter, sort, and search your Oracle logs for the exact ones you need. For example, view only error logs from your environment and use log patterns to see which types of errors are the most frequent. You can also filter to show only error logs from your OCI Load Balancers to identify which backends are showing the most problems.
Datadog log analytics lets you build queries and visualize your log data so you can spot high-level issues at a glance. For instance, you can easily create a query to filter and aggregate your logs by error type and then track the results in a bar chart. Or, visualize the average response time recorded by your access logs to monitor your load balancer performance.
Create dashboards from your OCI logs
Once you’ve identified data from your OCI logs that are most important for your situation, you can create a custom dashboard to visualize and correlate key log data from your environment. Add widgets to your dashboards that track data such as the number of authentication errors detected by OCI, the rate of API failures in your environment, and multiple time-series graphs comparing the types of logs generated. This provides a high-level view of the health and performance of your OCI environment at a single glance.
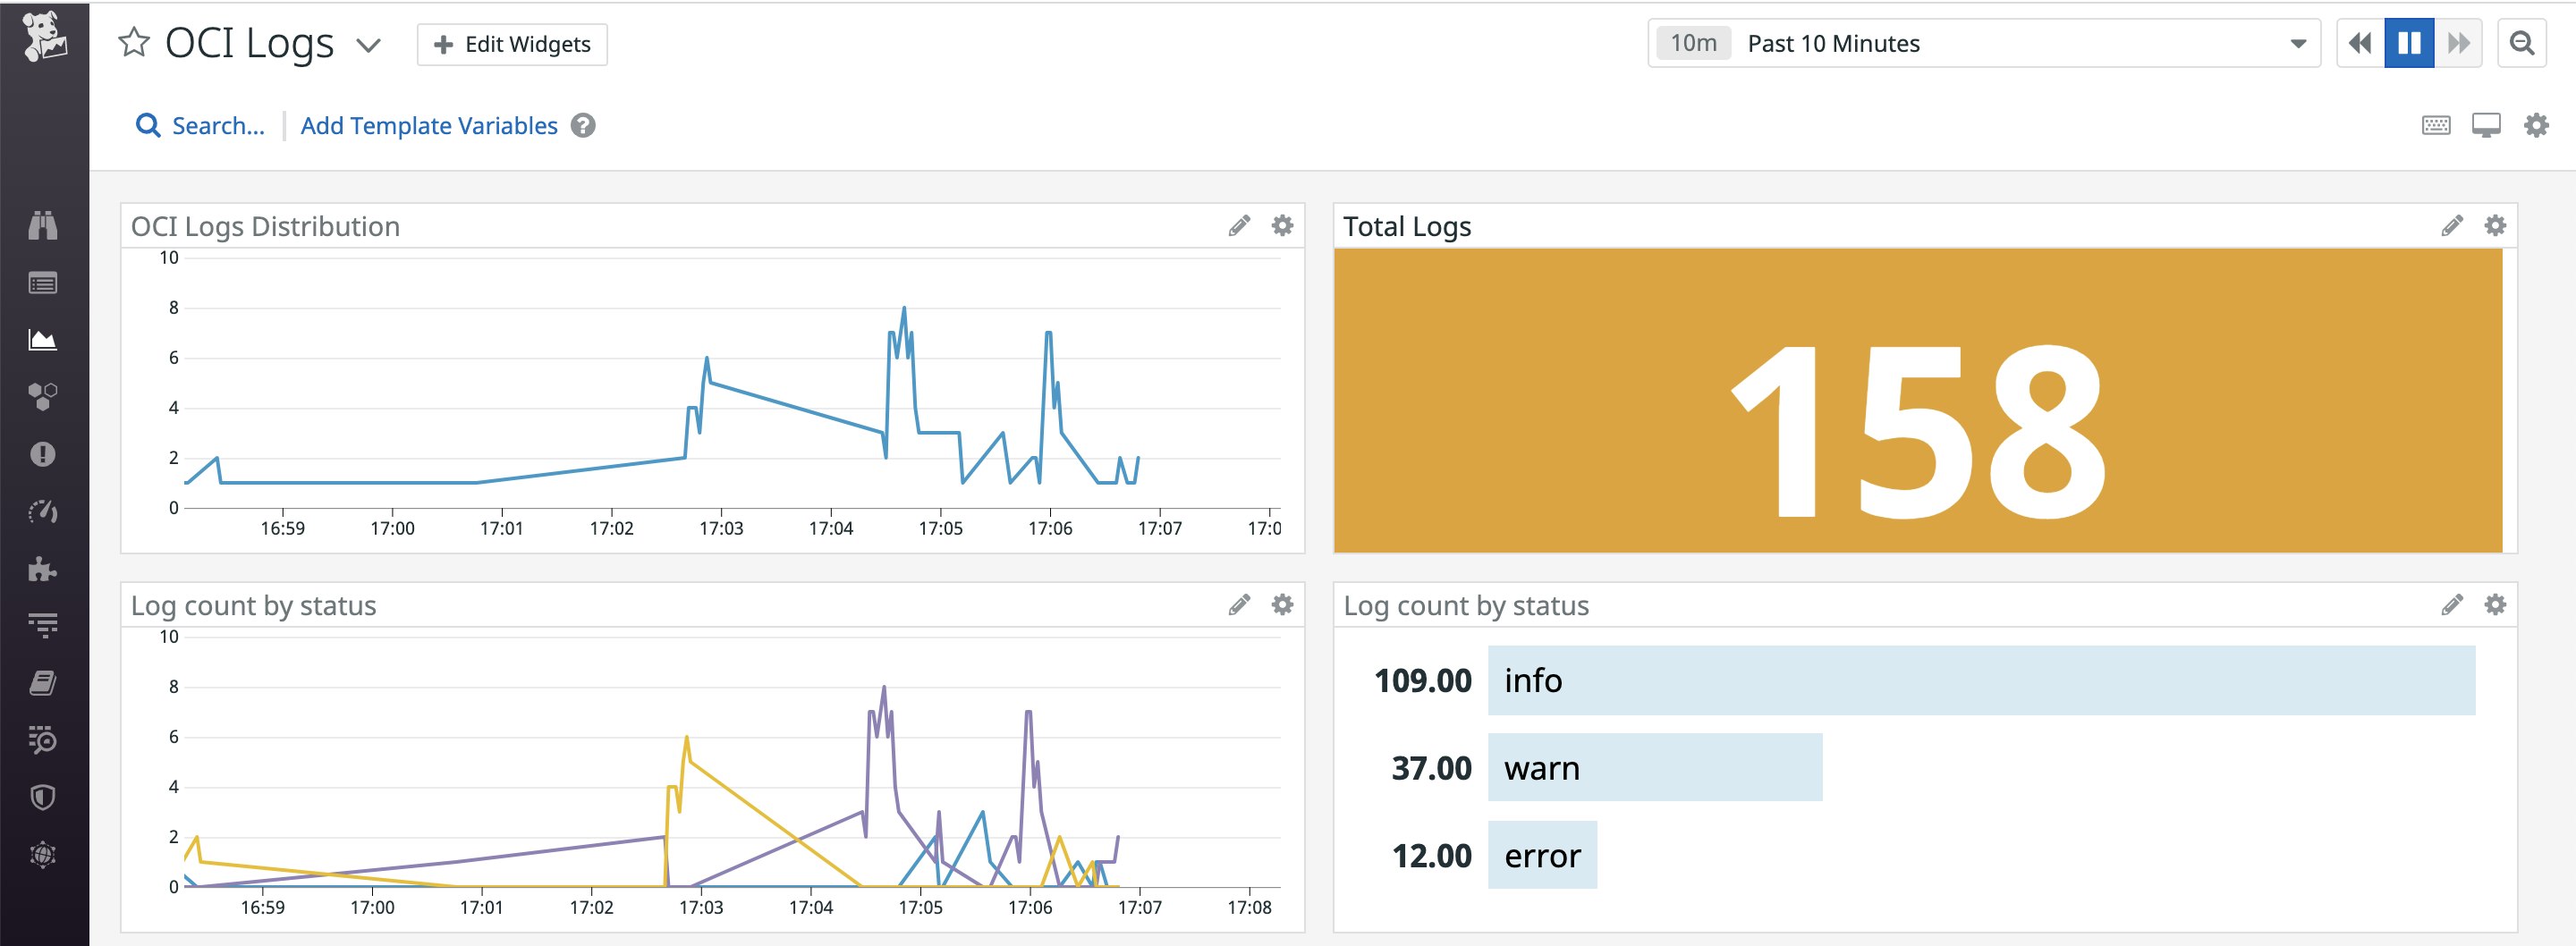
You can also easily visualize your OCI logs alongside monitoring data from the rest of your infrastructure, including key technologies like Oracle Database and Oracle’s Container Engine for Kubernetes. This gives you greater visibility across your stack so you can correlate activity from within your OCI environment with the health and performance of the services you are running.
Secure your OCI environment with Datadog Cloud SIEM
Datadog Cloud SIEM provides a centralized location for your engineering, devops, security, and compliance teams to detect and triage security threats. You can easily create custom Threat Detection Rules that Datadog checks all of your ingested OCI logs against. If any log triggers your ruleset logic, Datadog generates a Security Signal. You can track and examine your environment’s security status with Datadog’s comprehensive Security Signals Explorer, which allows you to quickly filter signals and triage threats to focus your troubleshooting process.
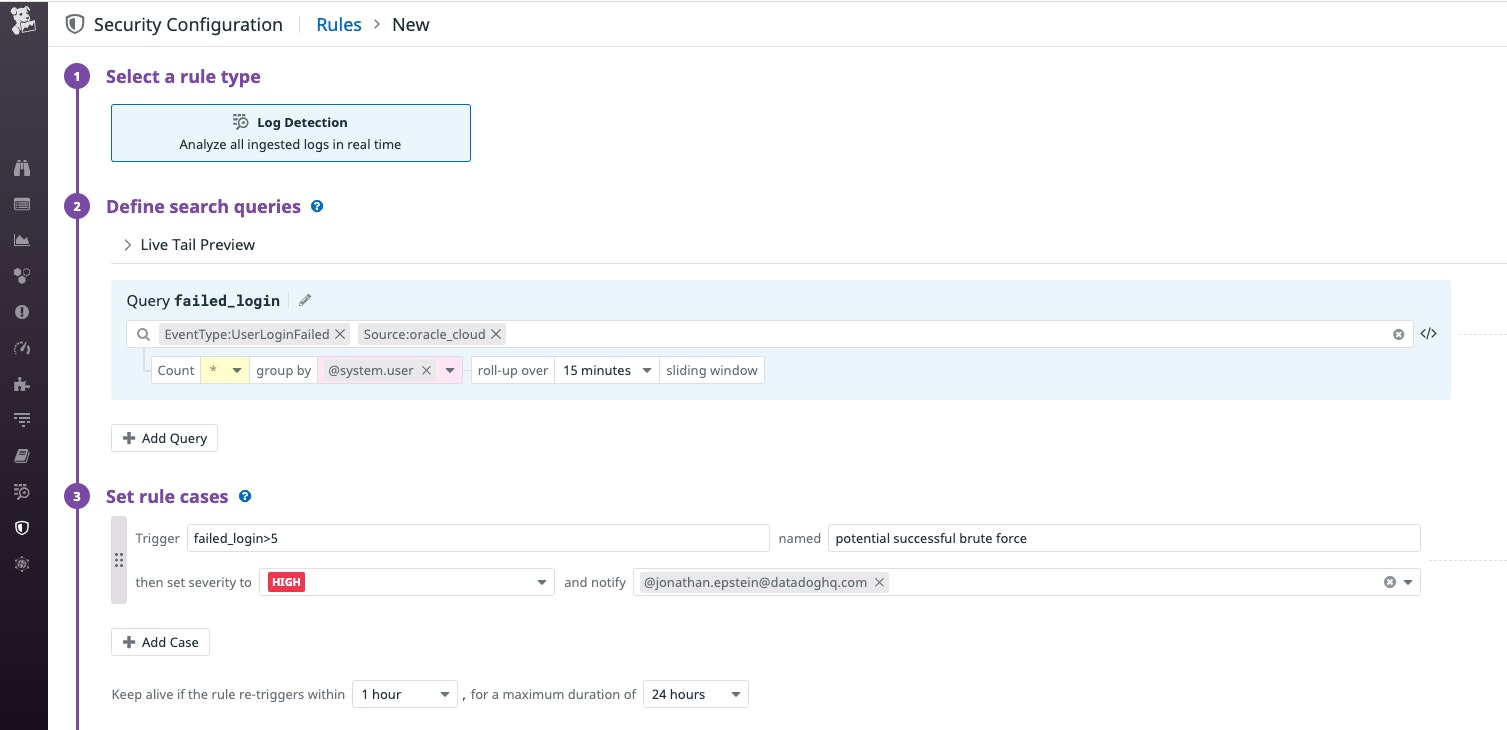
Within the Security Signal Explorer, visualize your Security Signals over time and drill down into the details of each signal to inspect their accompanying features, such as the name of the user or service that triggered the signal and the time at which it was generated. And using Datadog’s integrations with popular collaboration tools like Slack and Jira, you can quickly share threat details with all of your teams, or automate email notifications to be pushed when a certain rule is triggered.
Expand your OCI monitoring reach with Datadog
Datadog’s OCI logs integration gives you real-time visibility into your OCI account activity so that you can resolve operational issues faster and detect potential threats as soon as they occur. We’ll be hosting a joint webinar with OCI on December 2, 2020, where we’ll demo the integration and go over some best practices. To register, create a free Oracle Cloud Customer Connect account. If you’re already using Datadog, you can start using the integration right now. And if you’re new to Datadog, you can get started with a 14-day free trial.

