Scott Dixon
Datadog HQ is a great spot for commuters. Within a block or two of our offices in the New York Times building in midtown Manhattan, you can catch 12 different subway lines and countless bus lines as well. That makes it a snap to get to and from work… most of the time. As has been widely publicized, the NYC subway system has been plagued by service problems (including a recent derailment), and our governor just declared a state of emergency for the MTA.
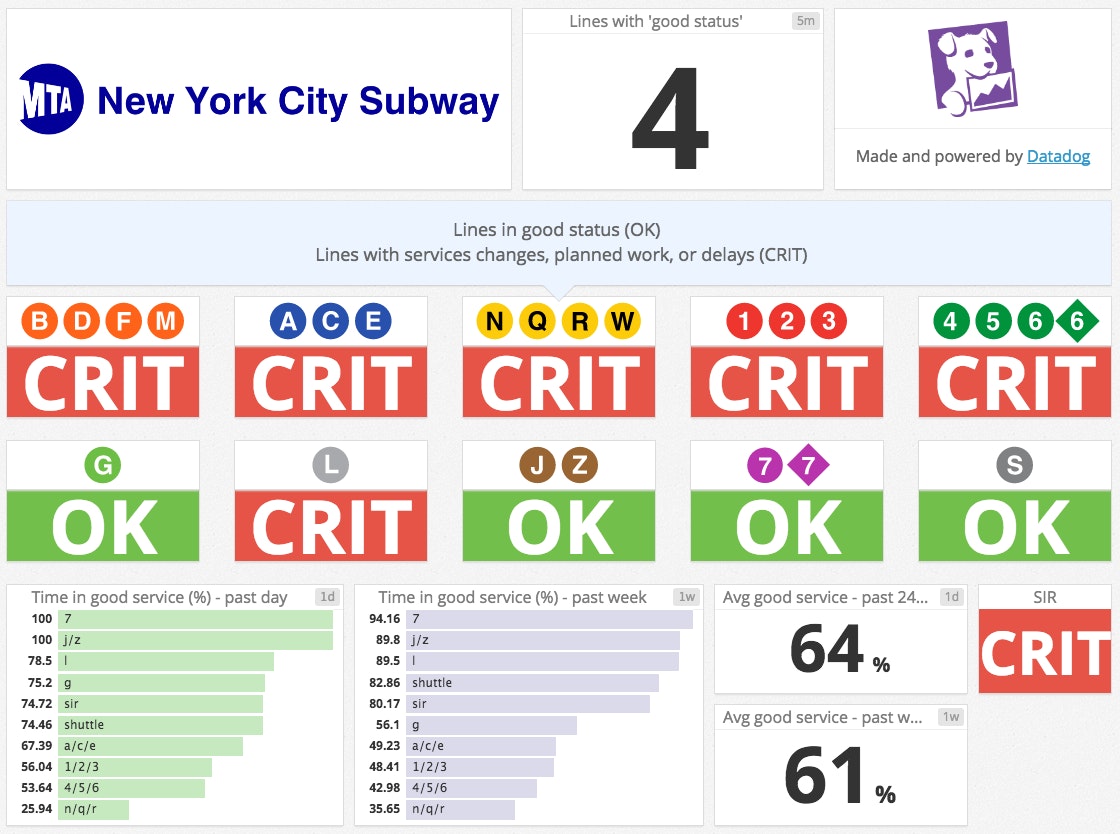
With the train system struggling, I wanted a simple way to check the status of the subway lines before I left home or work. As a solutions engineer, I spend my days helping our customers get the most out of Datadog, which often involves monitoring a variety of unique data streams. So I decided to set up a Datadog dashboard to monitor the real-time status of the New York City subway system—and our MTA Service Tracker dashboard was born.

Getting the MTA data
After poking around the MTA’s available data sources, I decided that parsing the text updates around service status was the easiest and most reliable way to extract meaningful data about the various subway lines. In these updates, the MTA groups lines by service division (such as B/D/F/M or 4/5/6), and declares a status for each, like "good service," "planned work," "service change," "delay," or "suspended.” I saw that I could parse those updates and send the data as custom metrics to Datadog.
Sending the metrics to Datadog
There are a number of ways to get custom metrics into Datadog, including an HTTP API and a whole ecosystem of client libraries. I chose to write a custom Agent check because I already had a Datadog Agent sending metrics to my personal Datadog account, and because the Agent handles a number of boilerplate tasks for me. For instance, I can set a parameter that tells the Agent to run my check every 60 seconds, rather than having to set up a cron job to periodically run my script.
The check parses the service update and creates a custom metric called mta.line_service tagged with the name of the subway line (e.g. line:a/c/e) as well as the status (e.g. status:planned_work). The metric value is either 0 or 1, with 1 representing "good service" and 0 representing degraded service from planned work, a service change, or delays. Since the metric is tagged by line, we can see the number of lines currently running with good service by adding the values together, or we can average the metric values to show the percentage of lines in good service. We can also break that metric down using the line tag to show each line's performance.

I also added service-check widgets to the dashboard to quickly identify lines having issues, with OK representing "good service" and CRITICAL representing degraded service. Service checks in Datadog also allow for a WARNING state, but in the interest of providing meaningful information at a quick glance, I opted to only use OK and CRITICAL for the subway lines.
Consider the source
Because my subway service dashboard relies on updates posted to the MTA website, we need to know when the website is unavailable. Using the Datadog Agent’s built-in HTTP checks, it was easy for me to add a check that automatically pings the MTA website and reports on its availability and responsiveness. That data is visualized at the bottom of the subway status dashboard.

Monitor your world
Datadog users have devised all kinds of creative approaches to monitoring, from keeping an eye on beer temperature to tracking the status of home automation devices. Some of our own engineers even built a dashboard last summer to track the availability of Pokémon Go servers. Want to build dashboards and alerts to monitor the data you care about? Sign up for a free Datadog trial and get started.

