Jean-Mathieu Saponaro
This post is the last of a 3-part series about monitoring MongoDB. Part 1 presents the key performance metrics available from MongoDB: there is one post for the WiredTiger storage engine and one for MMAPv1. Part 2 explains the different ways to collect MongoDB metrics.
If you’ve already read our first two parts in this series, you know that monitoring MongoDB gives you a range of metrics that allow you to explore its health and performance in great depth. But for databases running in production, you need a robust monitoring system that collects, aggregates, and visualizes MongoDB metrics along with metrics from the other parts of your infrastructure. Advanced alert mechanisms are also essential to be able to quickly react when things go awry. In this post, we’ll show you how to start monitoring MongoDB in a few minutes with Datadog.

Monitor MongoDB performance in 3 easy steps
Step 1: install the Datadog Agent
The Datadog Agent is the open-source software that collects and reports metrics from your hosts so that you can visualize and monitor them in Datadog. Installing the agentusually takes just a single command.
Installation instructions for a variety of platforms are available here.
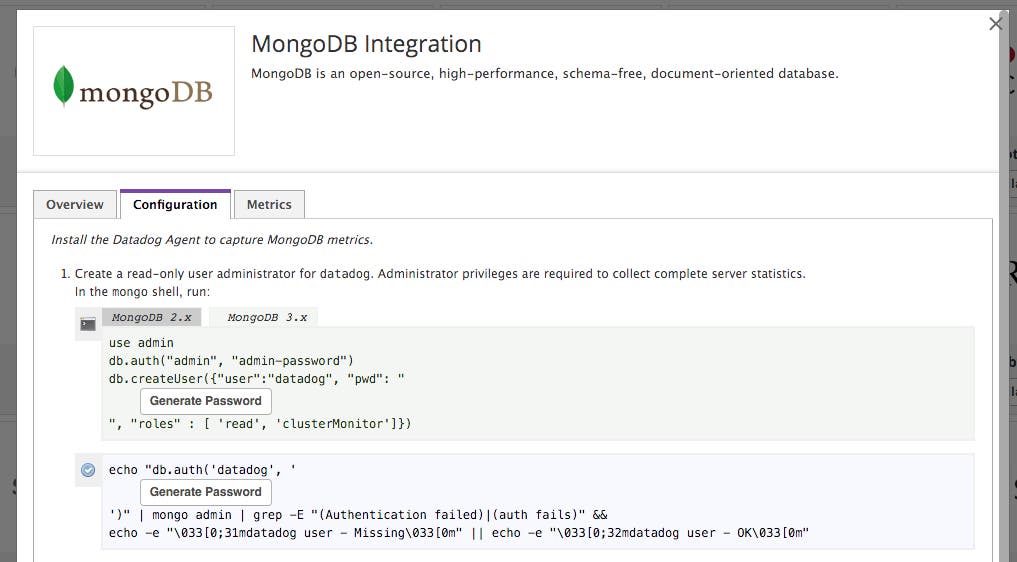
MongoDB also requires a user with “read” and “clusterMonitor” client roles for Datadog so the Agent can collect all the server statistics. The commands to run in the mongo shell differs between MongoDB versions 2.x and 3.x. They are detailed in the “configuration” tab of the MongoDB’s integration tile on the integrations page on Datadog.

As soon as your Agent is up and running, you should see your host reporting metrics on your Datadog account.

Step 2: configure the Agent
Then you’ll need to create a simple MongoDB configuration file for the Agent. For Linux hosts, configuration files are typically located in/etc/dd-agent/conf.d/, but you can find OS-specific config information here.
The Agent configuration file mongo.yaml is where you provide instances informations. You can also apply tags to your MongoDB instances so you can filter and aggregate your metrics later.
The Agent ships with a mongo.yaml.example template, but to access all of the metrics described in Part 1 of this series, you should use the modified YAML template available here.
Step 3: verify the configuration settings
Restart the Agent using the right command for your platform, then check that Datadog and MongoDB are properly integrated by running the Datadog info command.
If the configuration is correct, you should see a section like this in the info output:
Checks======
[...]
mongo------ instance #0 [OK]- Collected 8 metrics & 0 eventsThat’s it! You can now turn on the integration
You can now switch on the MongoDB integration inside your Datadog account. It’s as simple as clicking the “Install Integration” button under the Configuration tab in the MongoDB integration tile on your Datadog account.
Metrics! Metrics everywhere!
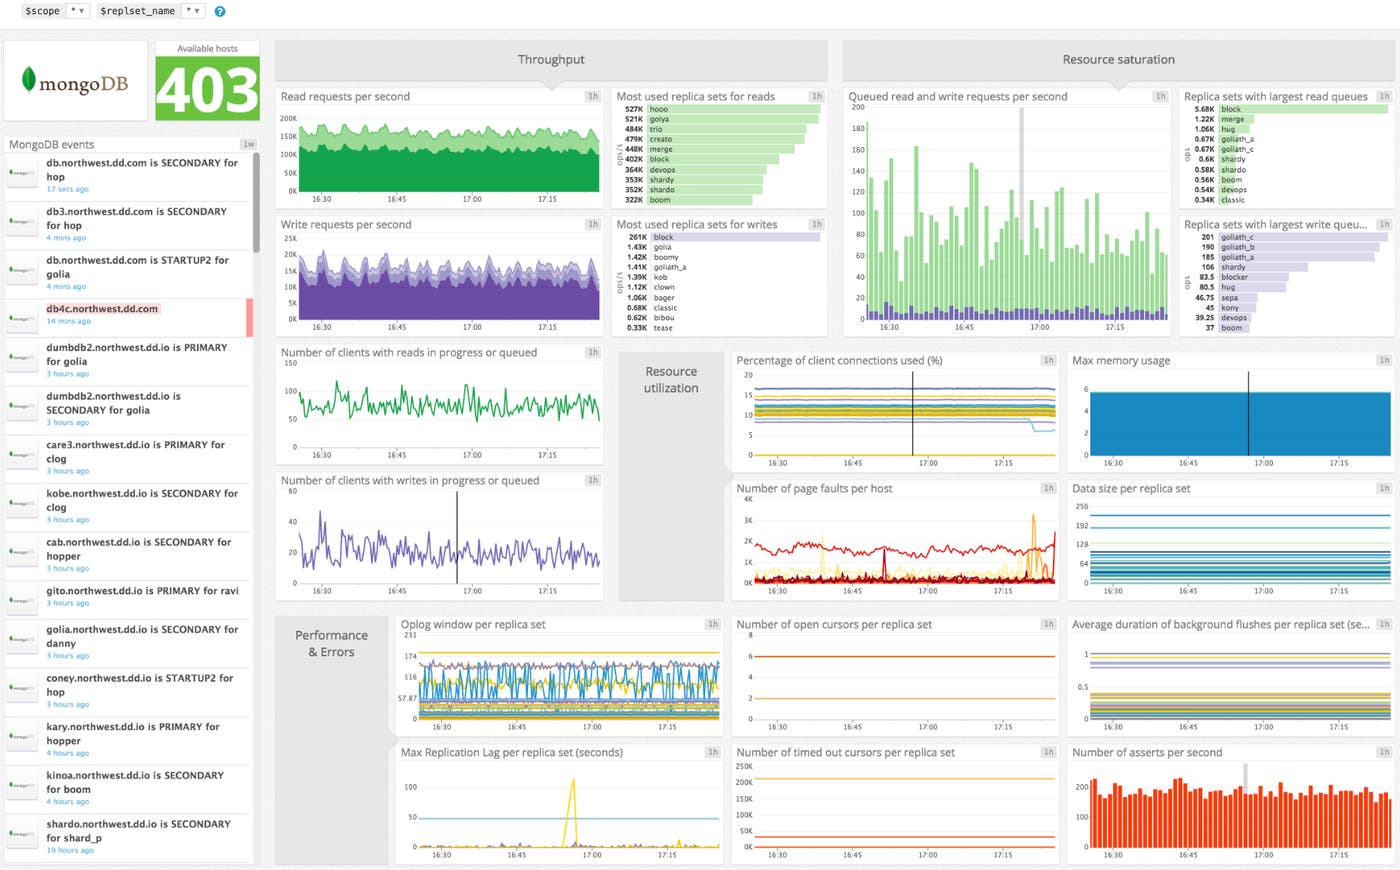
Now that the Agent is properly configured, you will see all the MongoDB metrics available for monitoring, graphing, and correlation on Datadog.
You can immediately see your metrics populating a default dashboard for MongoDB containing the essential MongoDB metrics presented in Part 1. It should be a great starting point for your monitoring. You can clone this dashboard and customize it as you wish, even adding metrics from other parts of your infrastructure so that you can easily correlate what’s happening in MongoDB with what’s happening throughout your stack.

Alerting
Once Datadog is capturing and graphing your metrics, you will likely want to set up some alerts to keep watch over your metrics and to notify your teams about any issues.
Datadog allows you to alert on individual hosts, services, processes, and metrics—or virtually any combination thereof. For instance, you can monitor all of your hosts in a certain availability zone, or you can monitor a single key metric being reported by each of your MongoDB hosts.
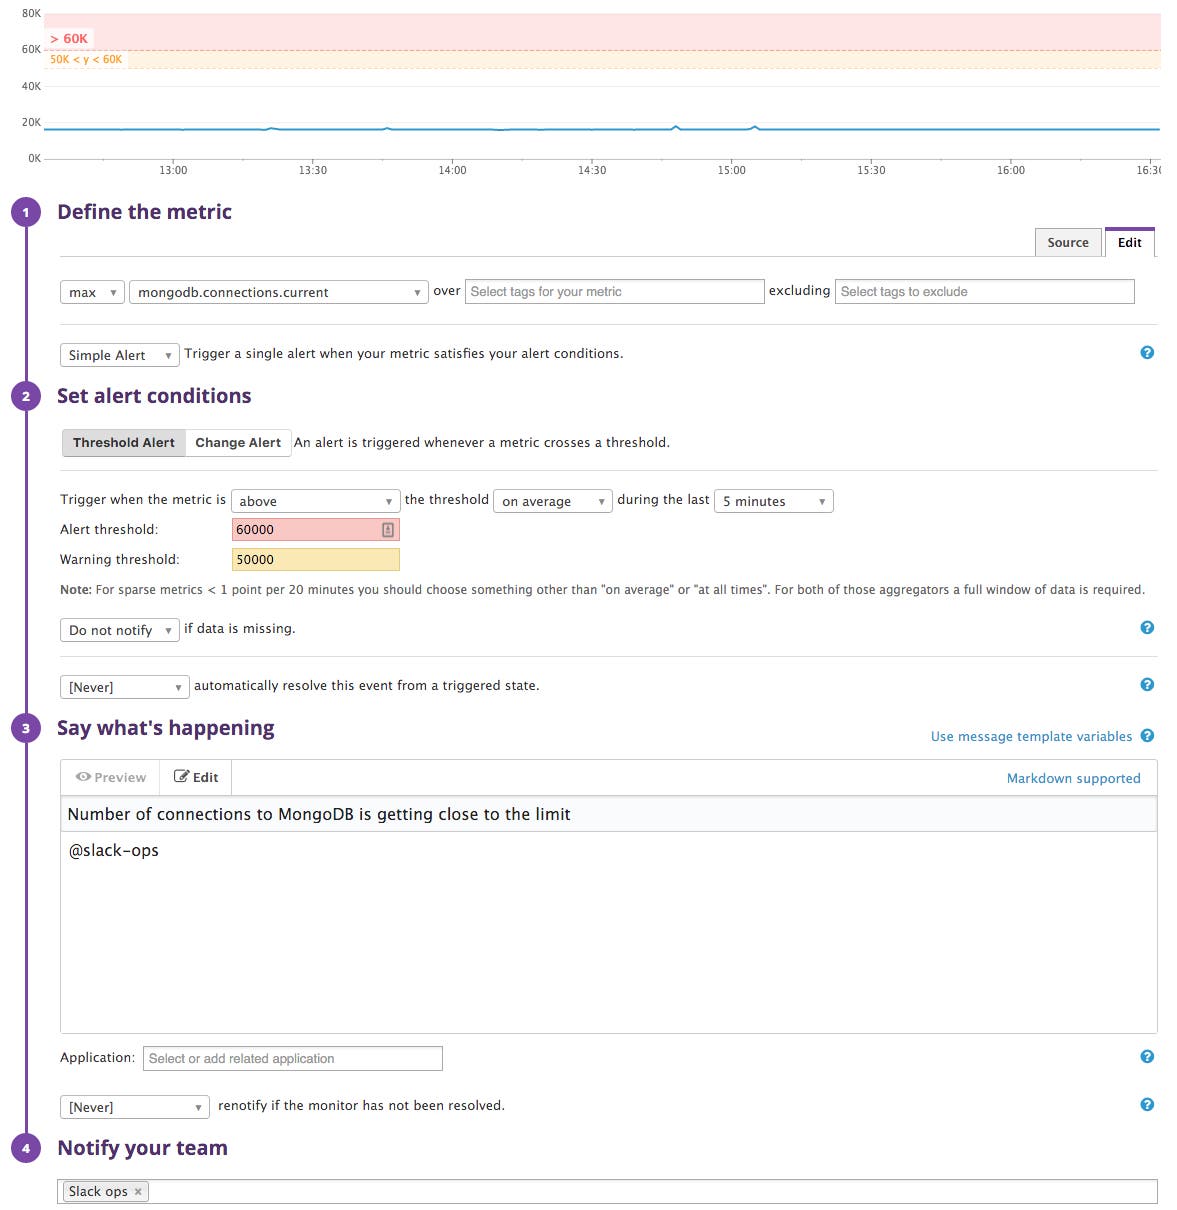
For example, as explained in Part 1, the number of current connections is limited to 65,536 simultaneous connections by default since v3.0. So you might want to set up an alert whenever the corresponding metric is getting close to this maximum.

Datadog also integrates with many communication tools such as Slack, PagerDuty or HipChat so you can notify your teams via the channels you already use.
You are now a MongoDB pro!
This concludes the series on how to monitor MongoDB. In this post we’ve walked you through integrating MongoDB with Datadog to visualize your key metrics and notify your team whenever your database shows signs of trouble.
If you’ve followed along using your own Datadog account, you should now have unparalleled visibility into MongoDB’s activity and performance. You are also aware of the ability to create automated alerts tailored to your environment, usage patterns, and the metrics that are most valuable to your teams.
If you don’t yet have a Datadog account, you can sign up for a free trial and start monitoring MongoDB alongside the rest of your infrastructure, your applications, and your services today.
Source Markdown for this post is available on GitHub. Questions, corrections, additions, etc.? Please let us know.


