


Angelina Jin

David Pointeau
Cisco Meraki provides a range of IT infrastructure devices, like network security appliances, switches, and wireless access points. As your on-prem infrastructure grows and you add potentially thousands of Meraki devices to your network, it becomes a challenge to get visibility across your entire fleet of devices.
With Datadog Network Device Monitoring (NDM), you can now monitor Cisco Meraki’s entire line of corporate IT infrastructure devices, including wireless access points (MR), switches (MS), and network security appliances (MX).
In this post, we’ll go over how you can use Datadog NDM to:
- Visualize the health of your wireless network and identify performance bottlenecks
- Troubleshoot and alert on the health of Meraki devices
- Monitor and take action on network and security event logs
Visualize the health of your wireless network and identify performance bottlenecks
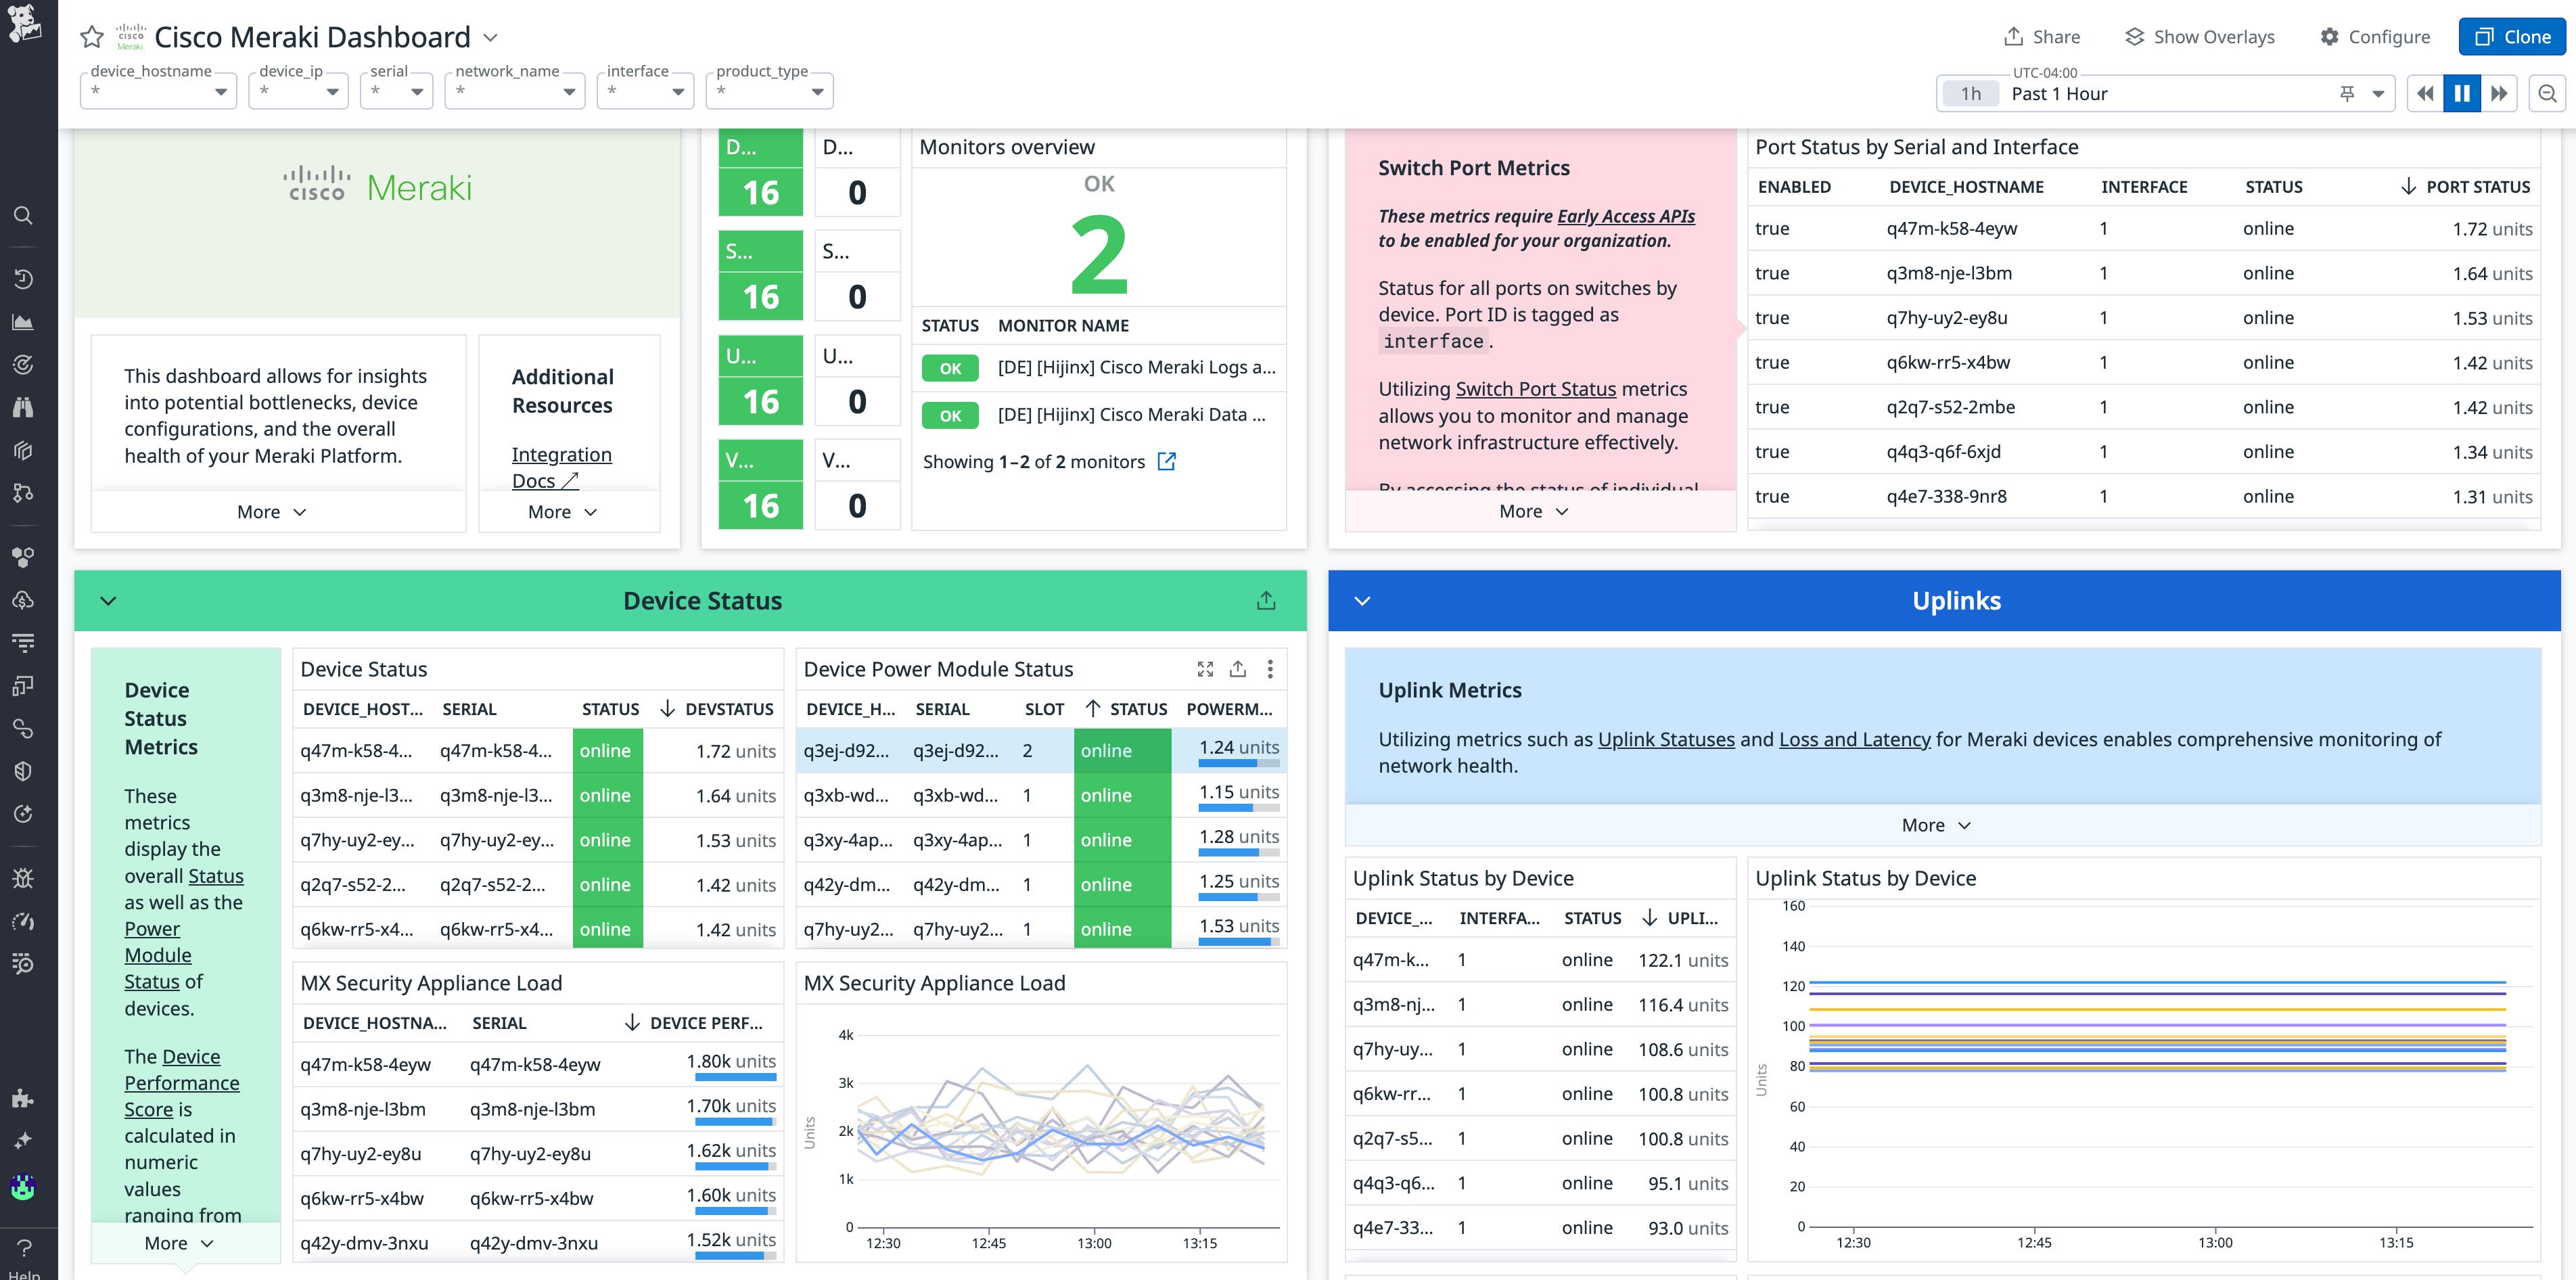
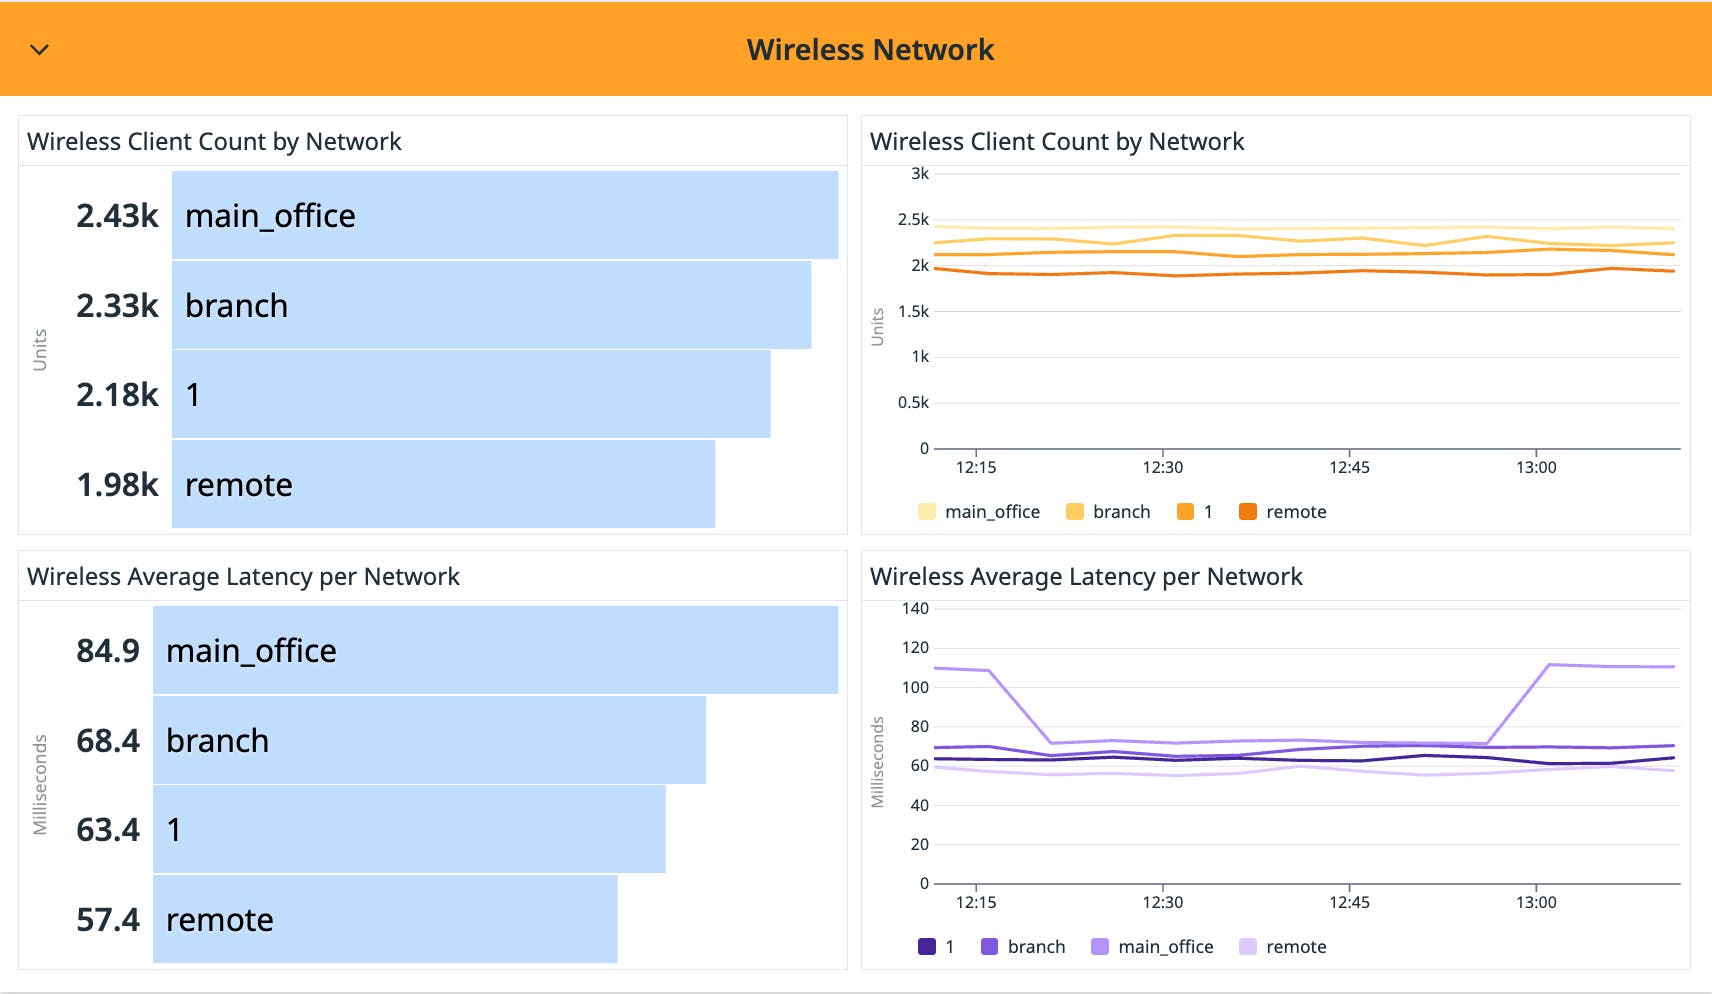
Making sure your network maintains optimum performance is critical for any business. For instance, when networks experience latency issues, video calls may become glitchy and applications can become slow and unresponsive, negatively impacting productivity. From NDM, you can navigate to an out-of-the-box (OOTB) Cisco Meraki integration dashboard that includes an overview of key wireless network metrics, such as the count of clients per network (meraki.ClientCount) and average network latency (meraki.avgLatencyMs).
These metrics provide you with a high-level understanding of your network health, making it easier to identify potential performance issues and load congestion. For example, if you see a high number of clients coupled with high latency, it could be a sign that an access point is overloaded or that there is a bandwidth bottleneck. On the other hand, if you see a low client count and high latency, there may be an issue with the wide area network (WAN) rather than load.
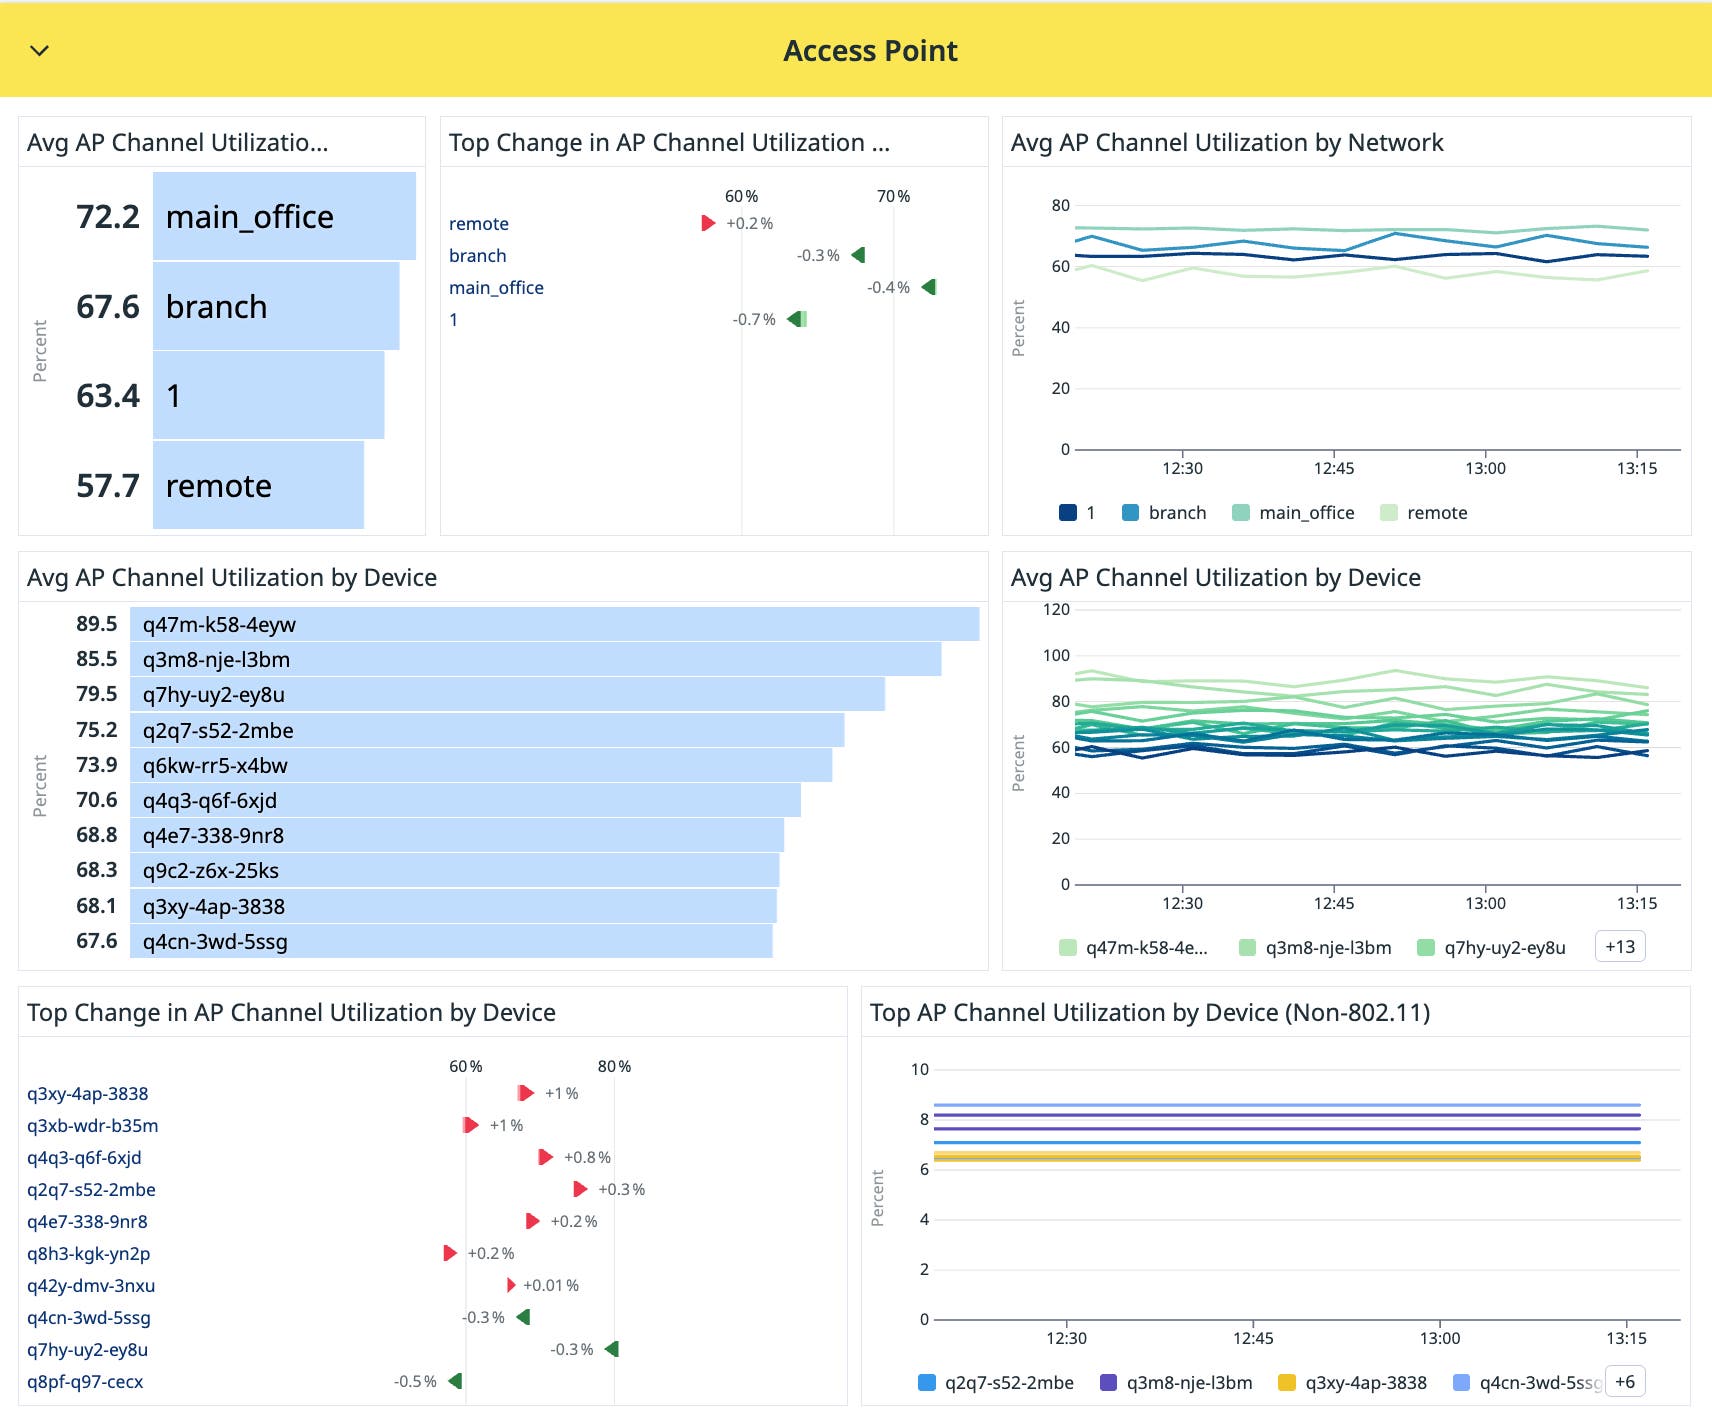
The dashboard also provides insights into access point utilization and channel performance. You can assess whether a wireless channel is overcrowded, and pinpoint periods of high client activity that may be causing congestion.
Troubleshoot and alert on the health of Meraki devices
Cisco Meraki MX security appliances provide centralized, cloud-managed firewall protection, VPN connectivity, content filtering, and SD-WAN capabilities. This wide range of tasks requires MX security appliances to handle many processes at once, utilizing CPU to keep networks secure and running smoothly.
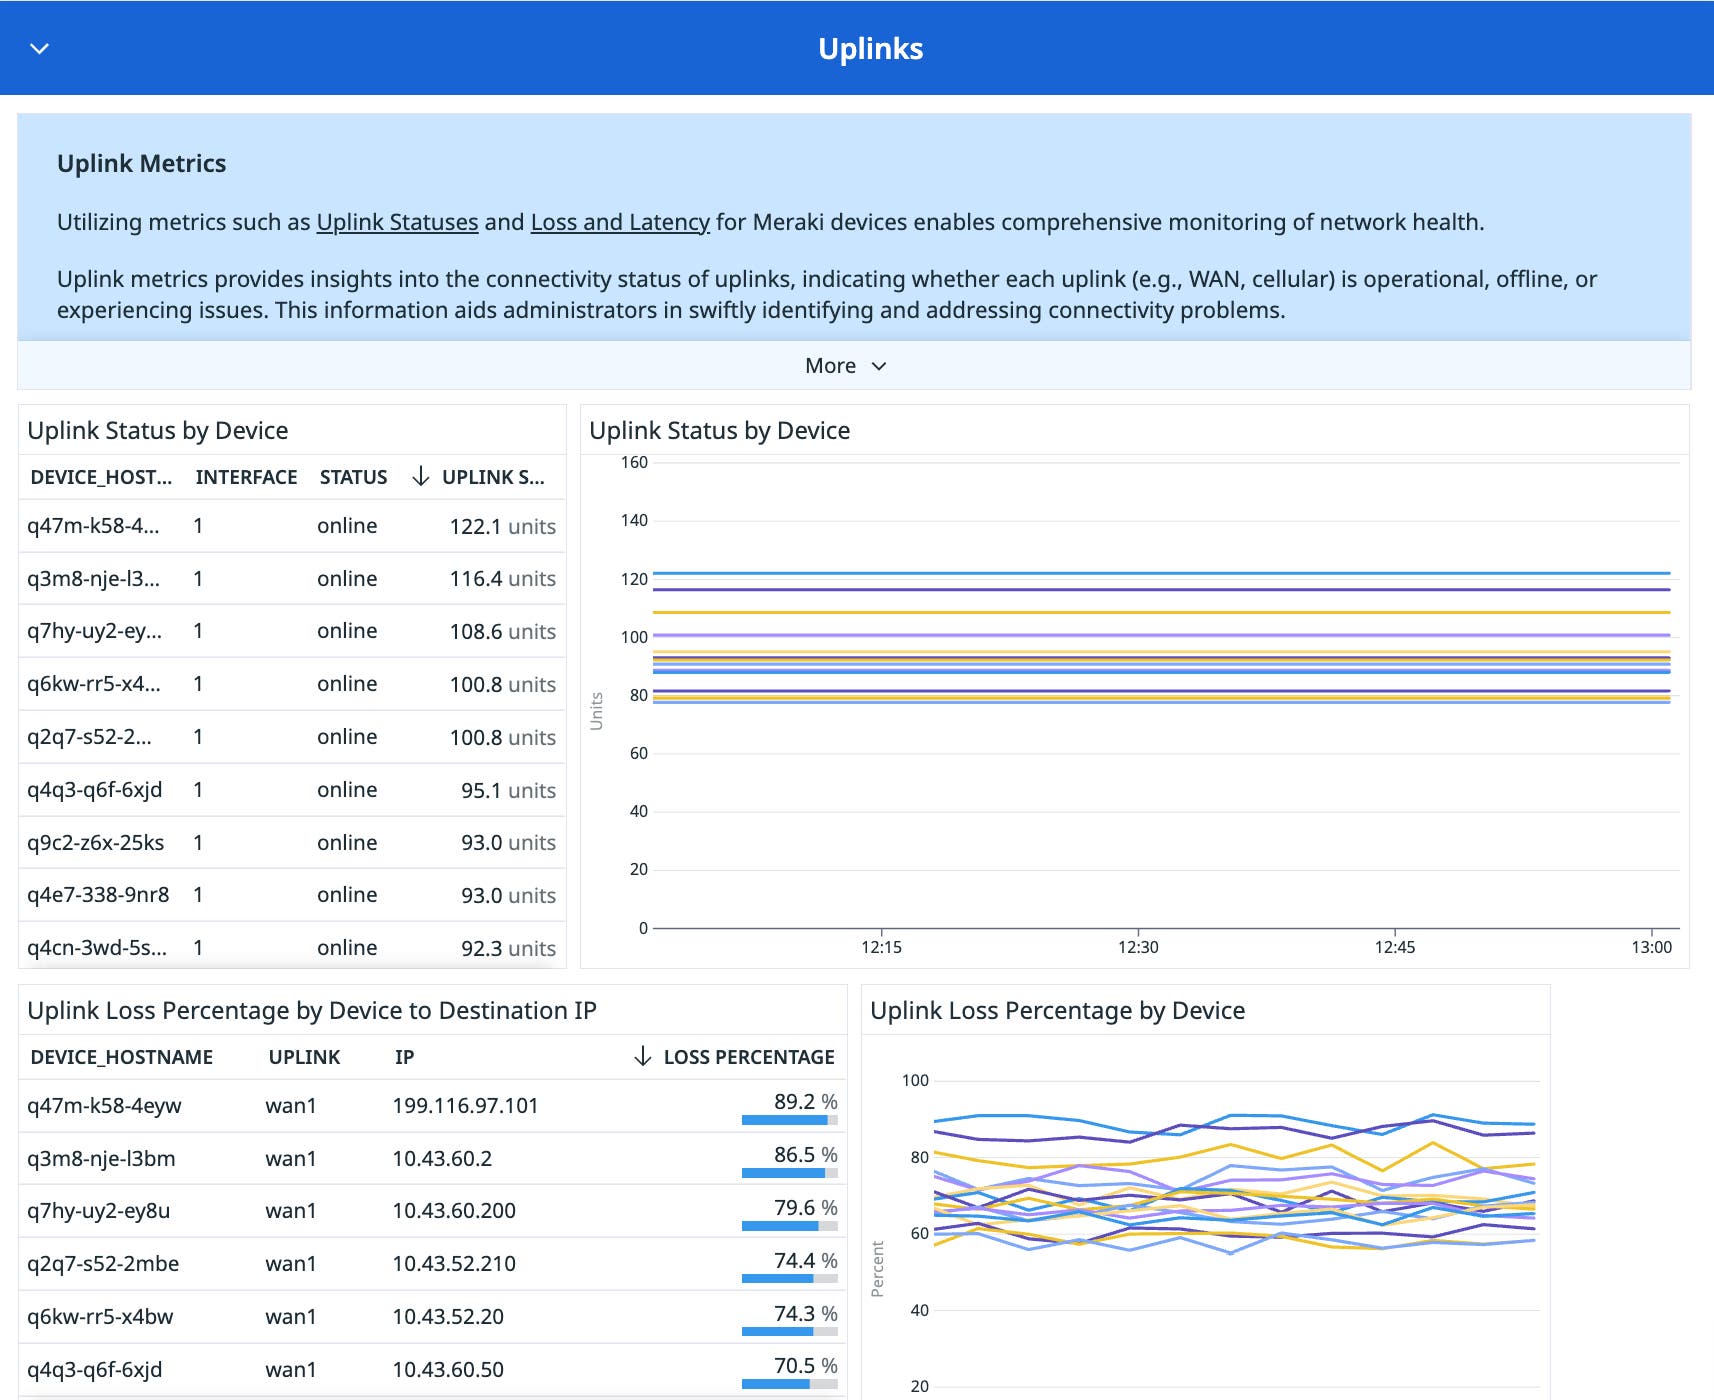
The Cisco Meraki dashboard helps determine whether security appliances are experiencing issues with underlay internet connectivity or overlay VPN tunnels. The dashboard’s “Uplinks” widget visualizes device uplink status and latency metrics so you can quickly assess the health of each WAN connection. This includes identifying packet loss or latency spikes over time that may point to instability.
The OOTB Cisco Meraki dashboard also surfaces device performance scores—which calculates your security appliances’ CPU load—to quickly determine whether any of your devices are strained, and prevent slowdowns from ocurring. If you notice higher device load than expected, consider adjusting device configurations or, if necessary, scaling your fleet.
Monitor and take action on network and security event logs
Datadog also collects and visualizes Cisco Meraki network event logs, which helps network teams stay on top of issues such as configuration changes, packet loss, and VPN connectivity issues. These logs provide valuable visibility into what’s happening across your fleet of network devices.
When used in conjunction with Flex Logs, organizations gain even greater control and scalability. Flex Logs provides customers the flexibility to choose which logs to retain and which use cases to support—whether it’s long-term auditing, advanced troubleshooting, or feeding data into third-party tools for deeper analysis.
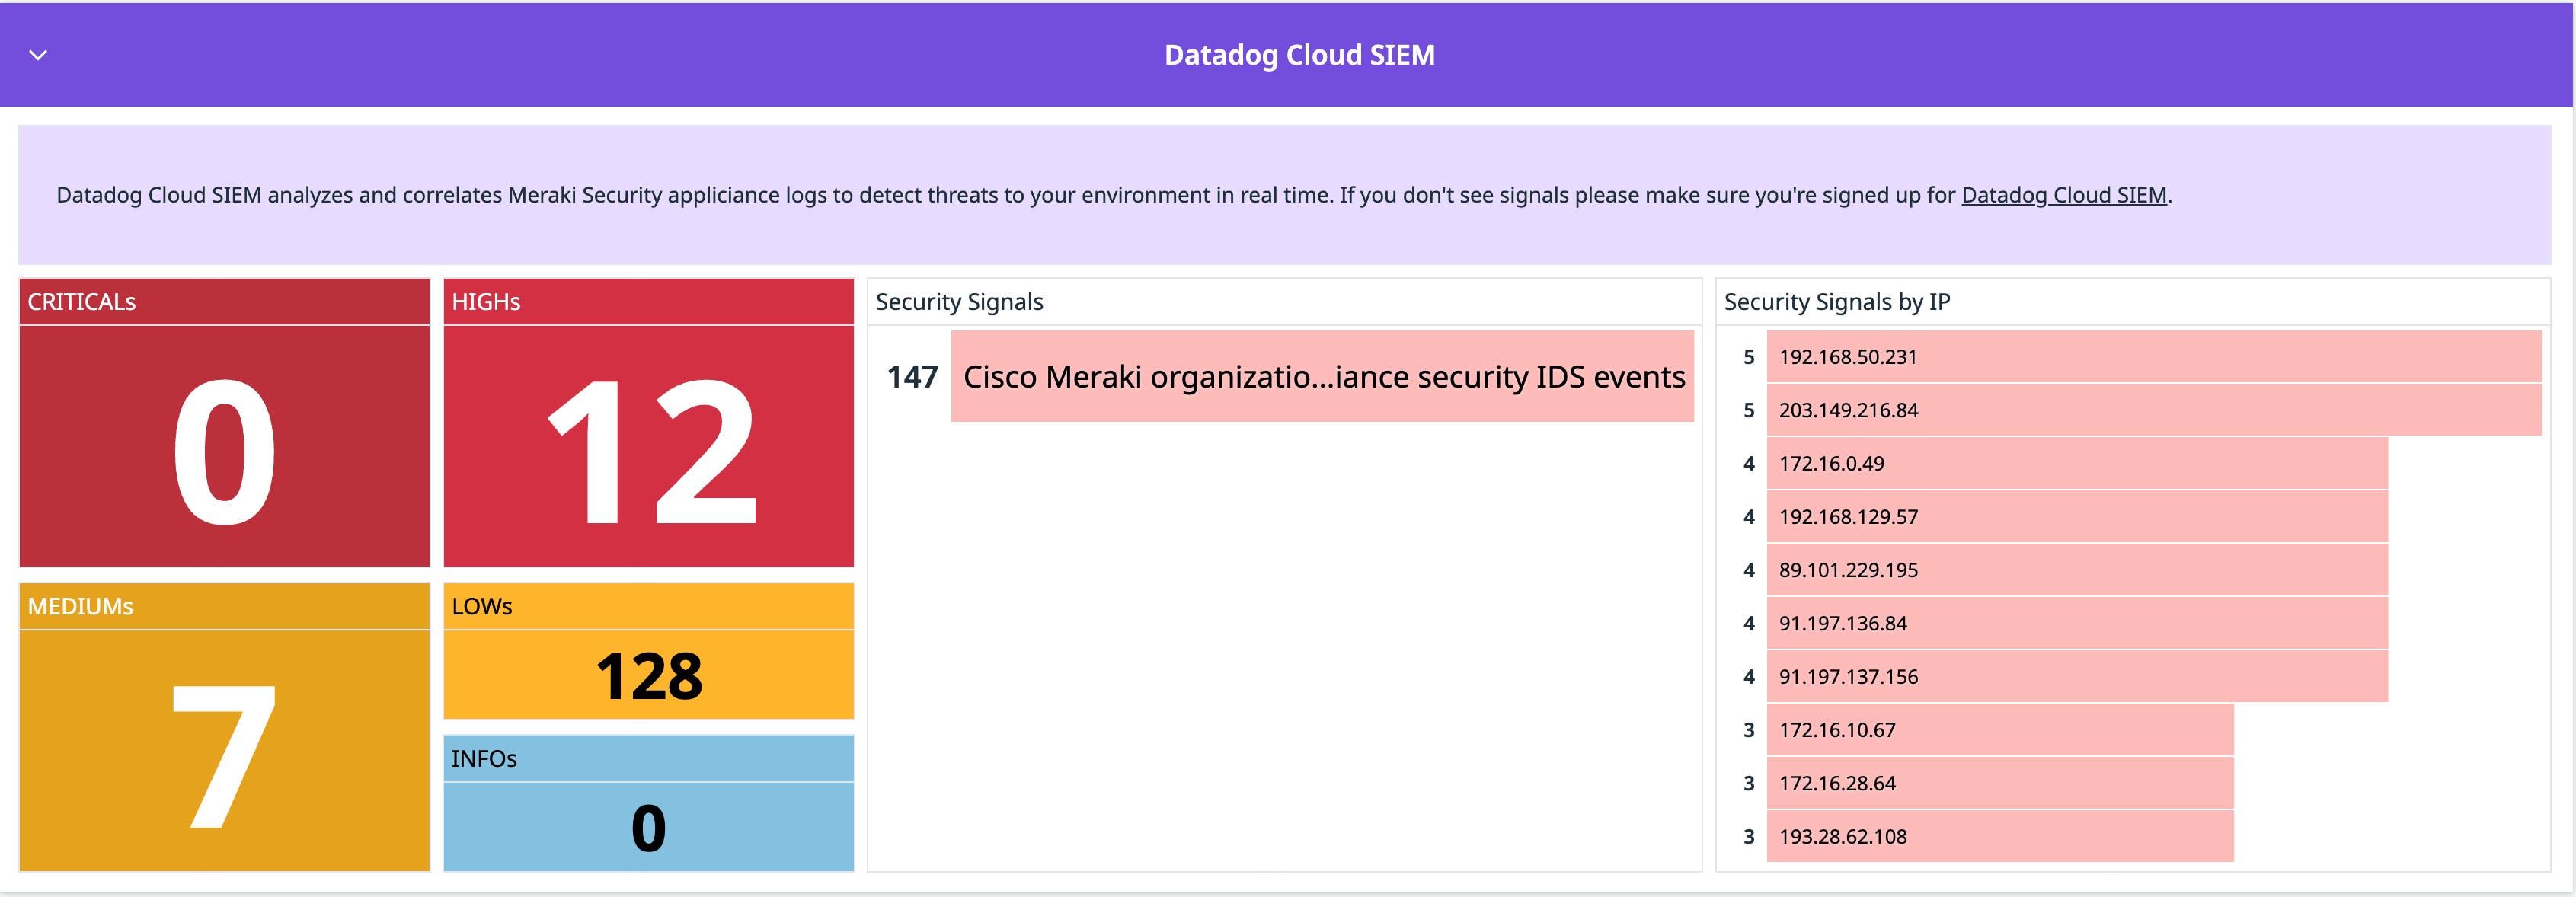
In addition to network events, Datadog also collects Cisco Meraki security event logs that allow you to quickly detect malicious activity. Cloud SIEM analyzes these security event logs to automatically identify when intrusion detection system (IDS) alerts are created by the Meraki MX security appliance. You can also use security event logs to make your own detection rules so that you can respond to potential security incidents that are unique to your specific environment.
Start monitoring your Meraki network and infrastructure
With the Cisco Meraki integration, network teams now have one unified tool to monitor their entire network of Meraki devices alongside traditional SNMP-based network devices in Datadog Network Device Monitoring.
Datadog’s Cisco Meraki integration—alongside hundreds of our other integrations—gives you a comprehensive view of the health and performance of your network as well as the rest of your infrastructure. If you have a Datadog account and want to start monitoring your Cisco Meraki environment, you can get started by visiting our documentation. Otherwise, sign up today for a 14-day free trial.


