Nicholas Thomson
When Kubernetes components like node s, pod s, or containers change state—for example, if a pod transitions from pending to running—they automatically generate objects called events to document the change. Events provide key information about the health and status of your cluster s—for example, they inform you if container creations are failing, or if pods are being rescheduled again and again. Monitoring these events can help you troubleshoot issues affecting your infrastructure.
All components of a cluster create events, so the volume of events generated by your system will grow quickly as you scale your Kubernetes environment. Additionally, events are generated from any change in your system, even ones that are healthy, business-as-usual, necessary changes in a properly functioning system. This means that a large portion of the events generated by your clusters are merely informational and not necessarily useful when troubleshooting an issue.
In this post, we’ll show you:
- How to understand the structure of Kubernetes events
- Which types of Kubernetes events are important for troubleshooting
- How to monitor Kubernetes events

Understand the structure of Kubernetes events
As with other Kubernetes API objects, events are YAML files that contain a specific set of fields that can provide key information about the event. For example, Kubernetes events have an involvedObject field that specifies which Kubernetes component is involved or affected by the event. The value of the type field indicates severity: normal, information, or warning. Generally, normal-type events are not useful for troubleshooting, as they indicate successful Kubernetes activity.
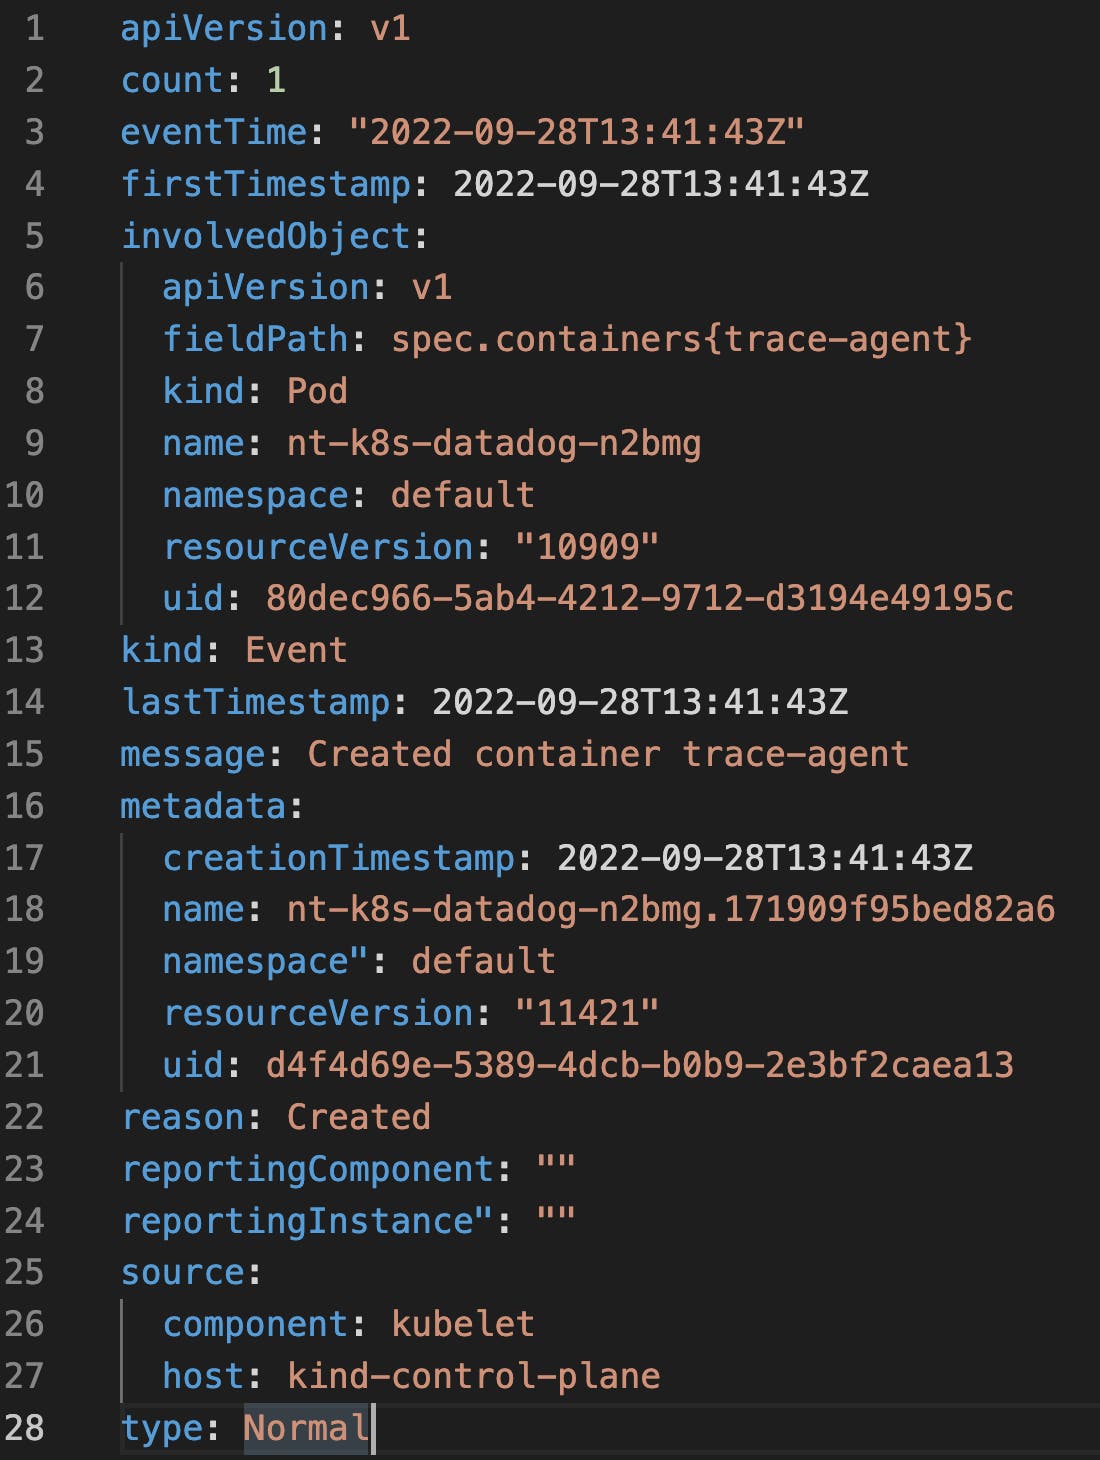
The message field can provide additional context around what action the event is recording, which can be useful for identifying the nature of the problem and where to focus your troubleshooting.
The source field in the YAML file documents the Kubernetes component that generated the event. Most of the events that we will discuss in this post come from the kubelet (e.g., events generated by the node, such as eviction events),
the kube-controller-manager (eviction events based on the node’s readiness), or the scheduler (FailedScheduling events).
Finally, the reason field provides an explanation for the cause of the event. For the purposes of this post, we will use the value of the events’ reason field to separate the events that are relevant to troubleshooting scenarios into different, easily identifiable groups. These include:
Now that we’ve covered some of the information that Kubernetes events include, we’ll dive into key types of events that you should track when troubleshooting issues in your clusters.
Identify which types of Kubernetes events are important for troubleshooting
Failed events
In Kubernetes, the kube-scheduler schedules pods that hold the containers running your application on available nodes. The kubelet monitors the resource utilization of the node and ensures that containers on that node are running as expected. When the kube-scheduler fails to schedule a pod, the underlying container’s creation also fails, causing the kubelet to emit a warn-type event that includes one of the following reasons: Failed (Kubernetes failed to create the pod’s data directories, e.g., /var/lib/kubelet/pods), FailedCreate (Kubernetes failed to create the pod; this event is usually coming from the replicaset ), FailedCreatePodContainer (the pod was created, but it failed to create one (or more) of the containers of the pod), FailedCreatePodSandbox(this is usually related to pod networking, i.e., a problem with the specific CNI of the cluster). Failed events are important to monitor because they mean containers that run your workloads did not spin up properly. The event’s message provides details for the reason for the failed container creation.
Often, container creations fail if Kubernetes cannot find or access the necessary resources. One reason this might occur is that Kubernetes encounters an issue retrieving the container image. As in the example below, the resulting message will say ImagePullBackOff.
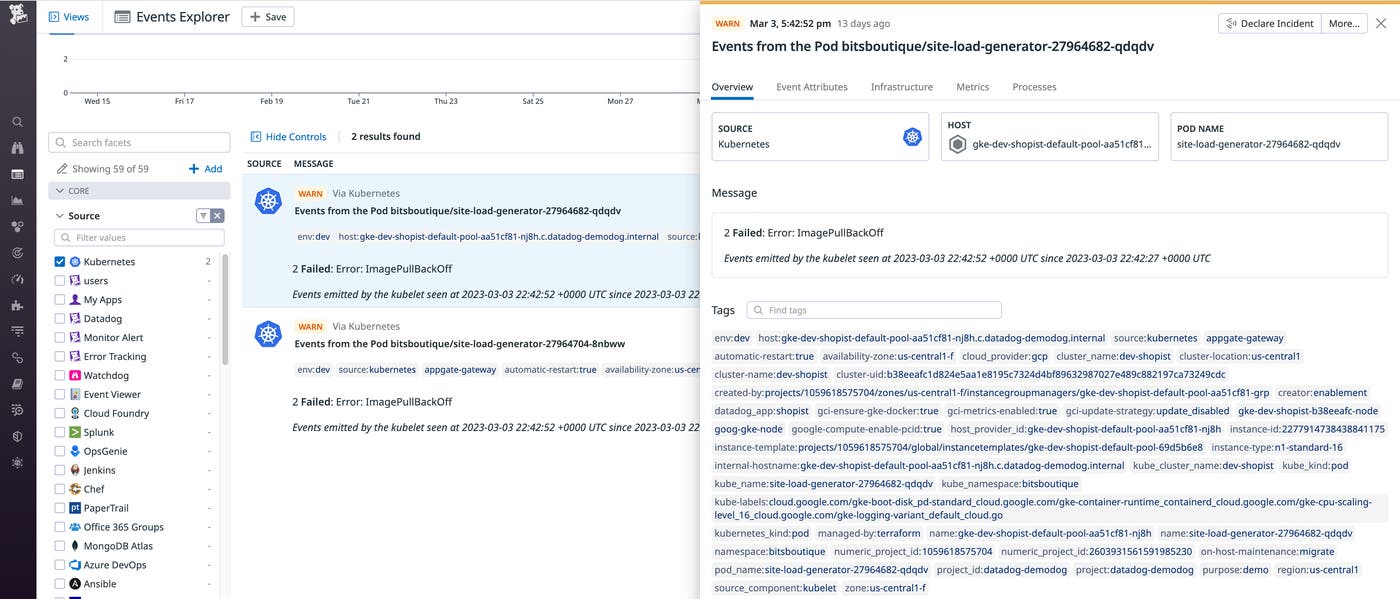
Kubernetes may have failed to retrieve the image because the required secret is missing. Secrets store confidential data (e.g., passwords, OAuth tokens, SSH keys, etc.) separately from your pods, which adds an additional layer of security. If the event message alerts you to a missing secret, you can troubleshoot by creating the secret in the same namespace or mount another, existing secret.
Eviction events
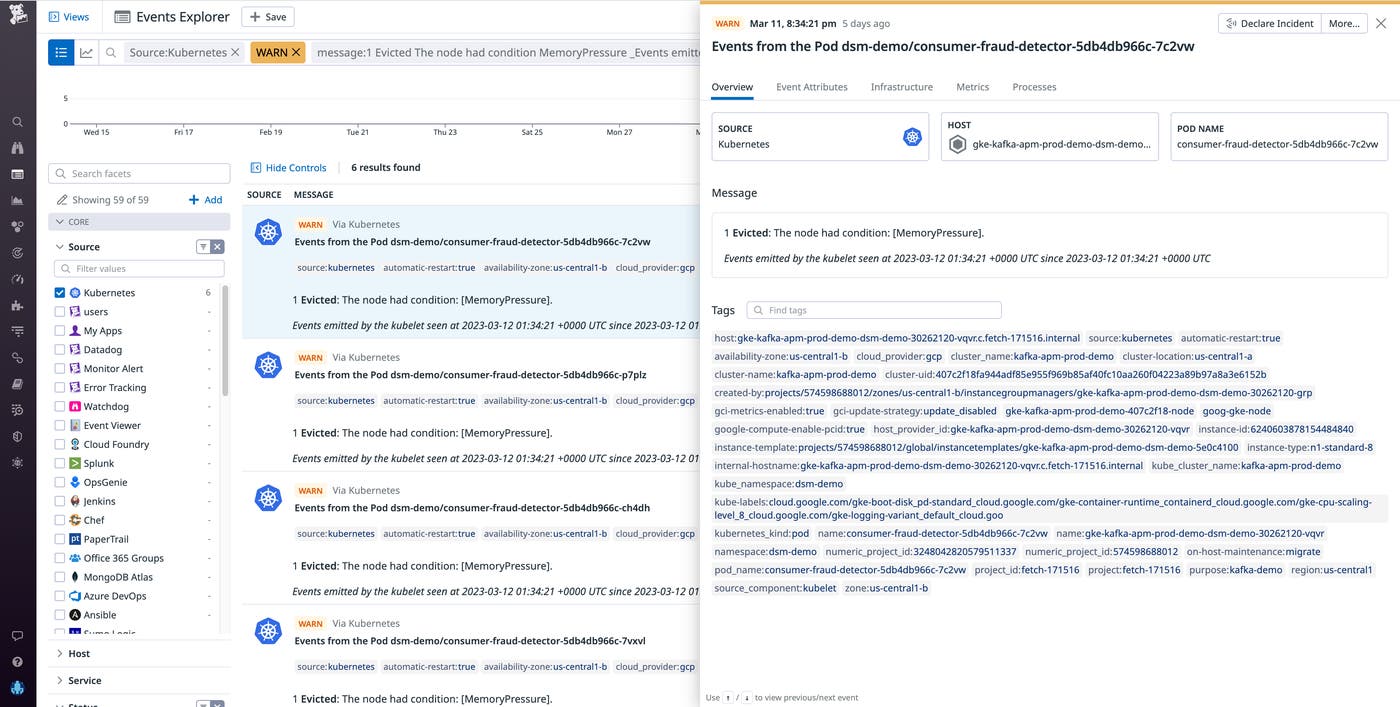
Another important type of event to monitor is eviction events (reason: evicted), meaning that a node is removing running pods. The most common cause of an eviction event is a node having insufficient incompressible resources (e.g., memory or disk). Resource-exhaustion eviction events are generated by the kubelet on the impacted node. When the kubelet determines that a pod is consuming more incompressible resources than its runtime dictates it should, Kubernetes may evict the offending pod from its node and attempt to reschedule it.
If your system generates an eviction event, the event message will provide a jumping-off point to determine how to troubleshoot. For example, say the evicted message says The Node was low on resource: [memory pressure]. This is a Node pressure eviction.
To alleviate the pressure on this node, you can adjust the resource requests and limits for containers on your pods, which will help Kubernetes schedule your pods on nodes that can accommodate their needs. You’ll want to check the resource usage of your containers to ensure they are not exceeding the levels set in their resource requests and limits. For more information on managing resource usage, see our blog post on sizing pods.
Another possible cause of pod evictions is if the node running them is in a NotReady state for longer than the length of time set by the podEvictionTimeout parameter on the node (default five minutes). In this case, the kube-controller-manager will evict all pods on that node so that the kube-scheduler can reschedule them on other nodes.
These eviction events will list the kube-controller-manager in the source field of the event’s YAML file. A node could be in a NotReady state for a variety of reasons—for instance, DNS misconfiguration or kubelet crash. The context in the event’s message will provide a jumping-off point for you to troubleshoot the problematic node.
Volume events
A Kubernetes volume is a directory of data (e.g., an external library), which a pod can access and expose to the containers in that pod so that they can run their workloads with any necessary dependencies. Separating this associated data from the pod provides a failsafe mechanism to retain it if the pod crashes and also facilitates data sharing across containers on the same pod. When assigning a volume to a new pod, Kubernetes will first detach the volume from the node it is currently on, attach it to the requested node, then mount the volume onto a pod.
For example, say you configured the volume to have ReadWriteOnce access mode and attached it to a node. If a pod on another node tries to access the volume,
Kubernetes will not be able to detach the volume from the original node (and thus will be unable to attach it to the second node). This will result in a reason: FailedAttachVolume event when a pod is spun up that requests the still-attached volume, with an error message that could read: Volume is already exclusively attached to one node and can’t be attached to another. To remediate this issue, you can change the access mode to ReadWriteMany.
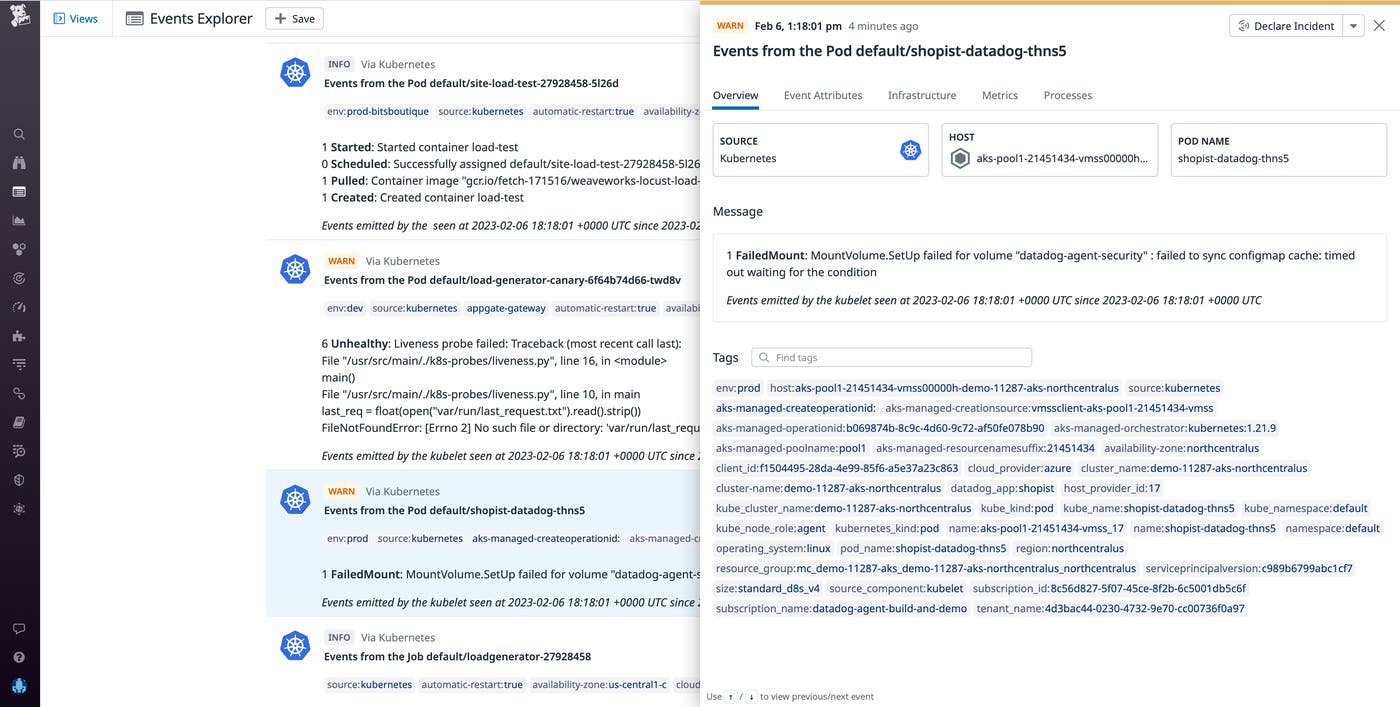
After a volume is detached, the kubelet then attaches it to a new node and mounts it onto a pod being spun up that is requesting that volume. If the kubelet is unable to mount the volume, it will generate an event with a FailedMountreason. A failed mount event can be the result of a failed attach, as mounting the volume is dependent on first attaching it. In this case, the kubelet would likely generate both a FailedAttachVolume and a FailedMount event. However, a FailedMount event could also be a result of other issues, such as a typo in the mount path or host path, or if the node does not have any available mount points—directories within the node’s file system where the contents of the volume are made available.
If a pod is failing to spin up and generates a FailedMount event, first check to ensure that the mount path and the host path are correct. If the paths are correct and thus not the reason for the failed mount, it’s possible that the node doesn’t have any available mount points. You can get around this issue by rescheduling the volume and pod on a new node with available mount points using nodeSelector.
Scheduling events
When the Kubernetes scheduler—which appears as default-scheduler in the From column—can’t find a suitable node to assign pods to, it will generate a reason: FailedScheduling event. Schedule failures can happen for a number of reasons, including unschedulable nodes, unready nodes, or mismatched taints and tolerations—pod properties that help Kubernetes schedule pods on the appropriate nodes—which could be inconsistent due to a typo or misconfiguration in the pod definition file.
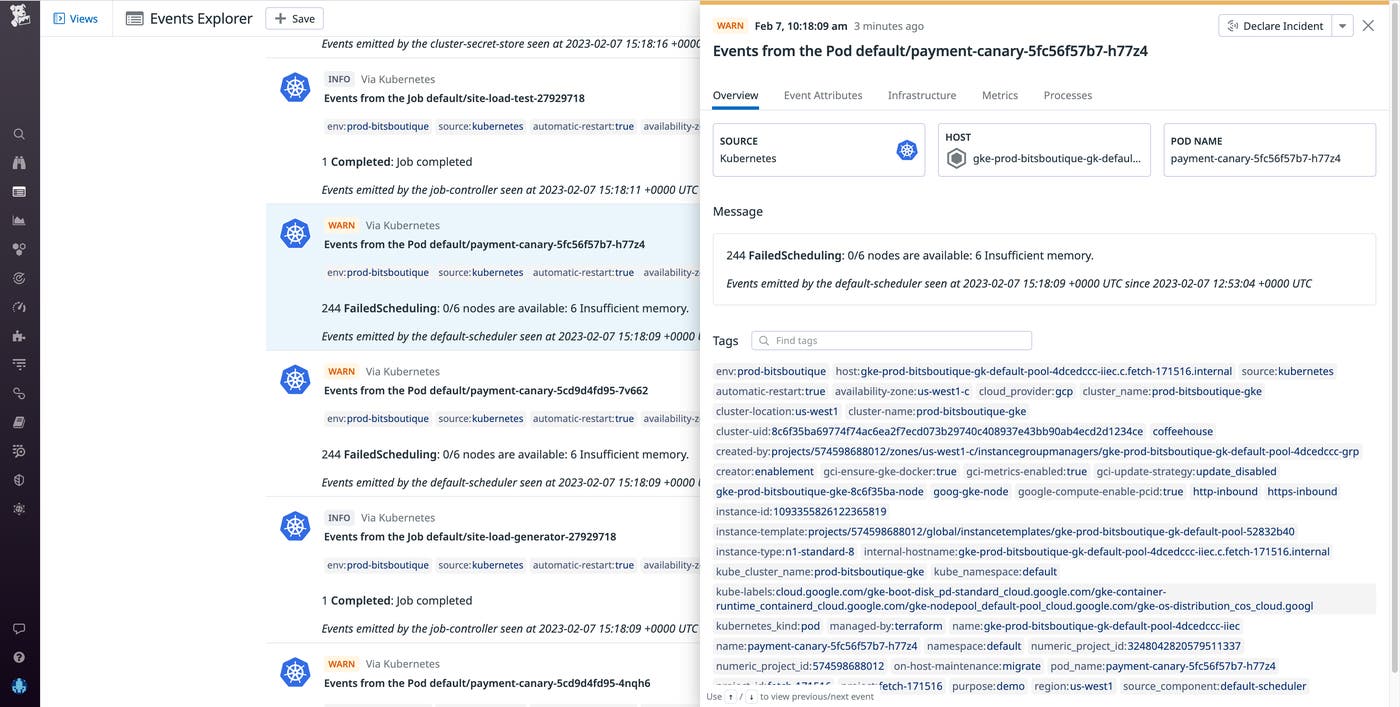
To troubleshoot a FailedScheduling event, check the event message for context around the node failure. An example FailedScheduling event message might be: 0/39 nodes are available: 1 node(s) were out of disk space, 38 Insufficient cpu. Since the scheduler could not find any nodes with sufficient resources to run the pod, a good course of action would be to first ensure that requests and limits on the pod are not preventing the pod from being scheduled. If they are properly configured, you may need to add more nodes to your cluster.
Unready node events
Node readiness is one of the conditions that node’s kubelet regularly reports as either true or false. The kubelet generates unready node events (Reason: NodeNotReady) to indicate that a node has changed from a ready state to not ready and thus is unprepared for pod scheduling. A node can be not ready for a number of reasons—for instance, a kubelet crash or a lack of available resources. The event message provides helpful context around the issue (e.g., kubelet stopped posting Node status indicates that the kubelet has stopped communicating with the API server). It’s worth investigating the reason why the node is not ready before it causes an issue downstream—for instance, a critical part of your application becomes unavailable to customers, costing you revenue and damaging consumer confidence.
Now that we’ve explored some of the most important types of Kubernetes events, next we’ll look at methods for monitoring your events that will help you more easily surface the important ones.
Monitor Kubernetes events
Monitoring Kubernetes events can help you pinpoint problems related to pod scheduling, resource constraints, access to external volumes, and other aspects of your Kubernetes environment. Events provide rich contextual clues that will help you to troubleshoot these problems and ensure system health, so you can maintain the stability, reliability, and efficiency of your applications and infrastructure running on Kubernetes.
Because Kubernetes generates an event to record each change in your system, most will be irrelevant for troubleshooting problems. The challenge of monitoring Kubernetes events is finding the signal in the noise of events when you need to troubleshoot an issue. If you can filter events properly, that signal can provide insights that help you reduce mean time to resolution (MTTR) when issues do occur. We’ll take a look at different methods for monitoring your Kubernetes events so that you can collect, filter, and view only the ones that matter to you. Specifically, we’ll look at using:
Use kubectl
One way to filter your events is with the Kubernetes CLI tool kubectl. You can use kubectl to filter out normal events with the command kubectl get events --field-selector type!=Normal. This will narrow down the output of the command to only events that are of information or warn type, which are likely to have been generated in response to a problem in your system.

To see only warning events, use: kubectl get events --field-selector type=Warning. While this will give you a helpful, high-level overview of the warning events in your system, you may want to get more detailed information from the events. To see a detailed breakdown of your Kubernetes events structured in JSON format, use kubectl get events --output json.
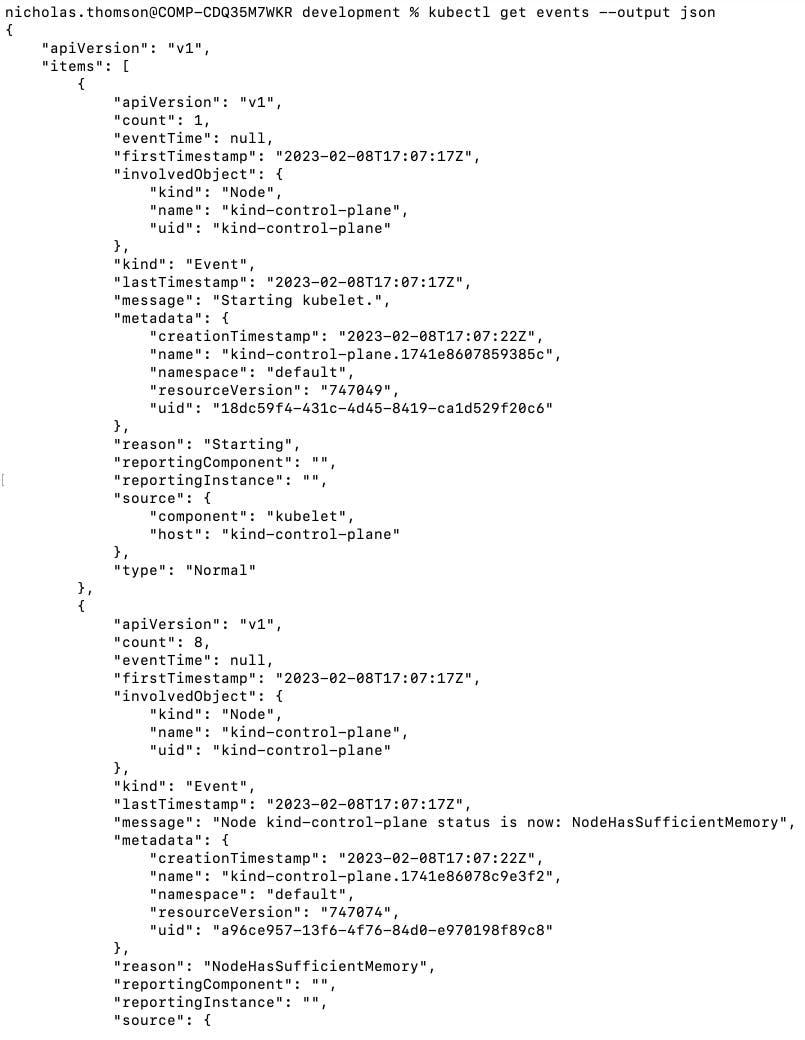
While kubectl provides a good starting point, monitoring events in this manner can quickly become unwieldy, especially as your cluster scales in size and complexity. Additionally, it’s important for teams that use Kubernetes to have event collection strategies, because by default, a Kubernetes cluster only retains events for an hour. The most effective way to monitor Kubernetes events is to send your events to a monitoring service like Datadog, which offers real-time event collection and retains events for 13 months by default. It can be useful to keep events in storage for writing incident postmortems, security investigations, or compliance audits.
Monitor Kubernetes events at scale with Datadog
Datadog provides a host of monitoring support for Kubernetes events, including a filterable event feed that allows you to correlate Kubernetes events with events from other areas of your environment, as well as metrics and other telemetry. It also provides the ability to create custom metrics from your events, monitors to alert you to critical events, and the ability to add events to your timeseries and dashboards to facilitate cross-team collaboration. To learn more, see our documentation.
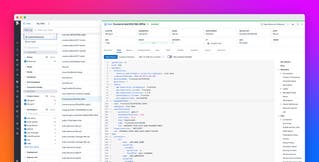
After you set up the integration, Kubernetes events will start streaming into the Events Explorer:
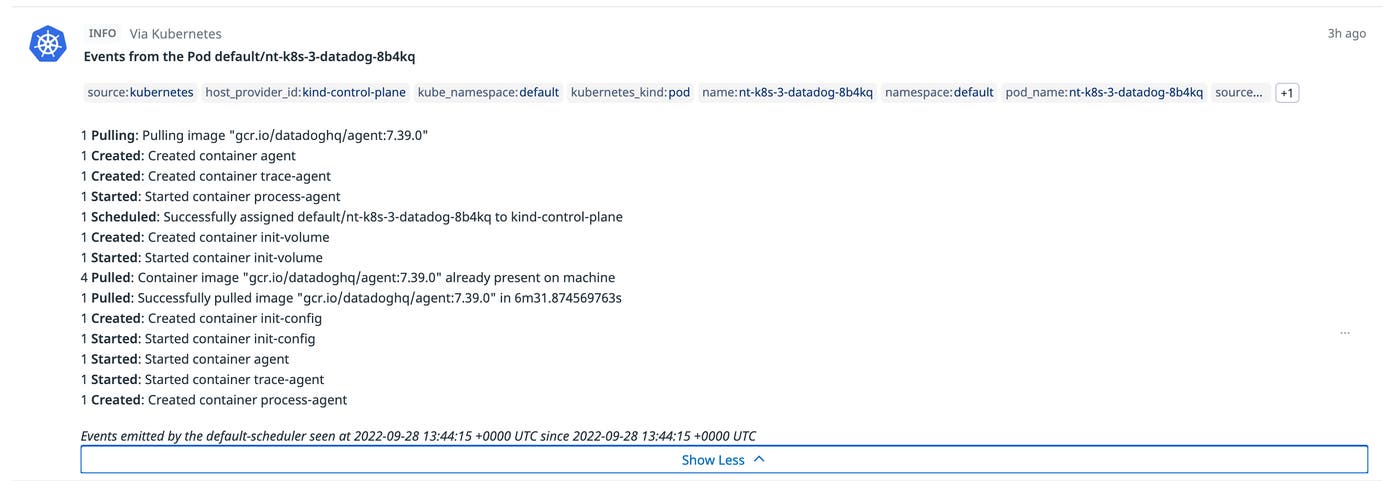
The Events Explorer provides you with a high-level overview of the health of your cluster, which you can easily scope down to show you only specific event types. Let’s say you narrow down your search to show only warning events. When you look into these warnings, you find that many of them are FailedScheduling events. With this knowledge in hand, you can troubleshoot the impacted node before the issue degrades your end-user experience.
You can also view Kubernetes events on the out-of-the-box Kubernetes dashboard and use Datadog to create custom monitors on your Kubernetes events. For instance, you could create an alert that notifies you when events with a warning type are higher than normal, or when out-of-memory evictions reach a certain threshold.
Troubleshoot more efficiently with Kubernetes events
Kubernetes events provide key information around what is happening in your environment, and monitoring them enables you to more easily determine the cause of problems with your containerized workloads. Identifying the types of events that can help you troubleshoot—such as container creation failed events, eviction events, volume events, scheduling events, and unready node events—is essential for faster troubleshooting and root cause analysis.
A monitoring platform like Datadog can help you monitor your Kubernetes events, especially at scale. Datadog enables you to store events for a long period of time, access the nested and linked data in an event, consolidate your data in a unified Events Explorer, tag events, and create monitors to track anomalous events.
If you’re new to Datadog, sign up for a 14-day free trial, and leverage Kubernetes event collection to expedite your investigations.
