K Young
Etcd is a distributed key-value store produced by CoreOS that was purpose-built to manage configuration settings across clusters of Docker containers, machines, or both. By activating the etcd integration within Datadog, you can ensure that configurations provided to your machines are consistent and up to date throughout your cluster.

Throughput
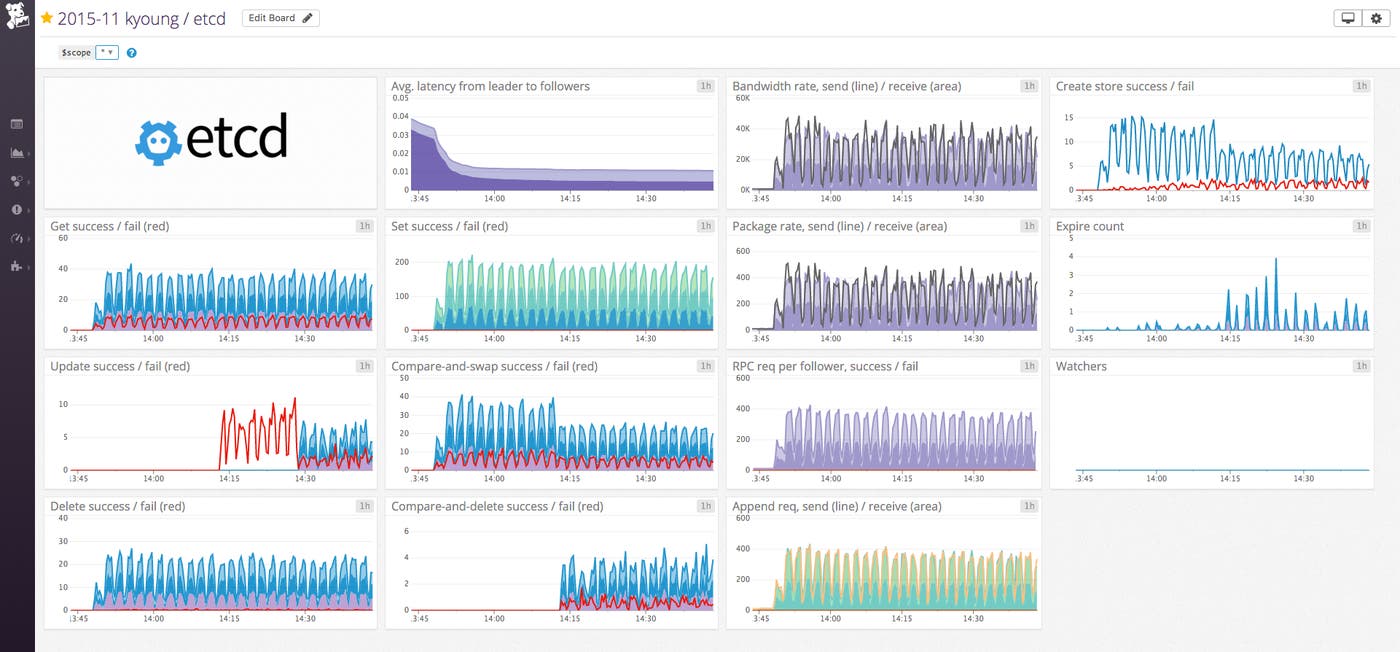
As soon as you turn on the Datadog etcd integration, you’ll be ready to monitor etcd with a default screenboard like the one above. The dashboard includes throughput metrics tracking the rates of successful directory or key creation, plus writes, updates, deletes, and two atomic operations for “compare and swap” and “compare and delete”.
You’ll also have:
- Package and bandwidth send and receive rates. (Leaders send, followers receive.)
- Append requests, which are messages to replicate the Raft log entries between leader and followers. (Here’s a great visual explanation of Raft.) Appends are triggered by both write operations and internal sync messages. However, etcd may internally batch operations, so do not expect a 1:1 correspondence between operations and appends.
Depending on your settings, there may be baseline sync activity that by default will measure at around five messages per follower per second. This will be visible in both the package rate and append requests metrics, as seen in the screenshot from an idle three-node cluster, below.

As always with Datadog, you may want to set alerts on the aggregate metrics to send small anomalous changes to your event stream, and to notify a human of large anomalies as they may represent problems upstream or with the health of etcd itself.
Errors
When DML operations (e.g. get, set, update) do not succeed, they are recorded by etcd as failures. Depending on your usage, failure may or may not be an error. For example, if you try to delete a value that does not exist—which may be expected by your application—etcd marks that operation as a failure. If you start seeing an anomalously large number of operations fail across the cluster, you may want to be alerted.
Failure rates of the leader’s Raft RPC requests to followers are available via the etcd.leader.counts.fail metric.

Latency
You can observe latency between the leader and each of its followers via the following metrics in Datadog: etcd.leader.latency.current, etcd.leader.latency.avg, etcd.leader.latency.min, etcd.leader.latency.max, etcd.leader.latency.stddev. If your average latency gets too high or if the standard deviation gets too wide, you may want to receive an alert.
Other
Depending on your application, you may want to use these additional metrics:
- The number of queries that are watching for changes to a value or directory:
etcd.store.watchers - The rate at which values or directories are expiring due to TTL:
etcd.store.expire.count
Datadog’s etcd integration documentation is available here.

Tags
Tagging is at the heart of scalable monitoring, so in addition to your custom tags, all of a node’s metrics are auto-tagged with leader/follower status. For instance you can isolate metrics from the leader by filtering for etcd_state:leader.
If you already use Datadog, you can start monitoring your etcd cluster immediately by turning on the integration. If not, here’s a 14-day free trial of Datadog.
Acknowledgments
Thanks to Yicheng Qin of CoreOS for his technical assistance with this article.


