David M. Lentz
IBM DB2 is a database management system that runs on a wide range of technologies, including Linux, UNIX, Windows, mainframes, and IBM Power Systems. You can deploy DB2 in a clustered environment to provide high availability, making it suitable for a wide range of enterprise and customer-facing applications. We’re pleased to announce that Datadog now integrates with DB2 so you can monitor the health and performance of your DB2 instances alongside related applications and the infrastructure that runs it all.
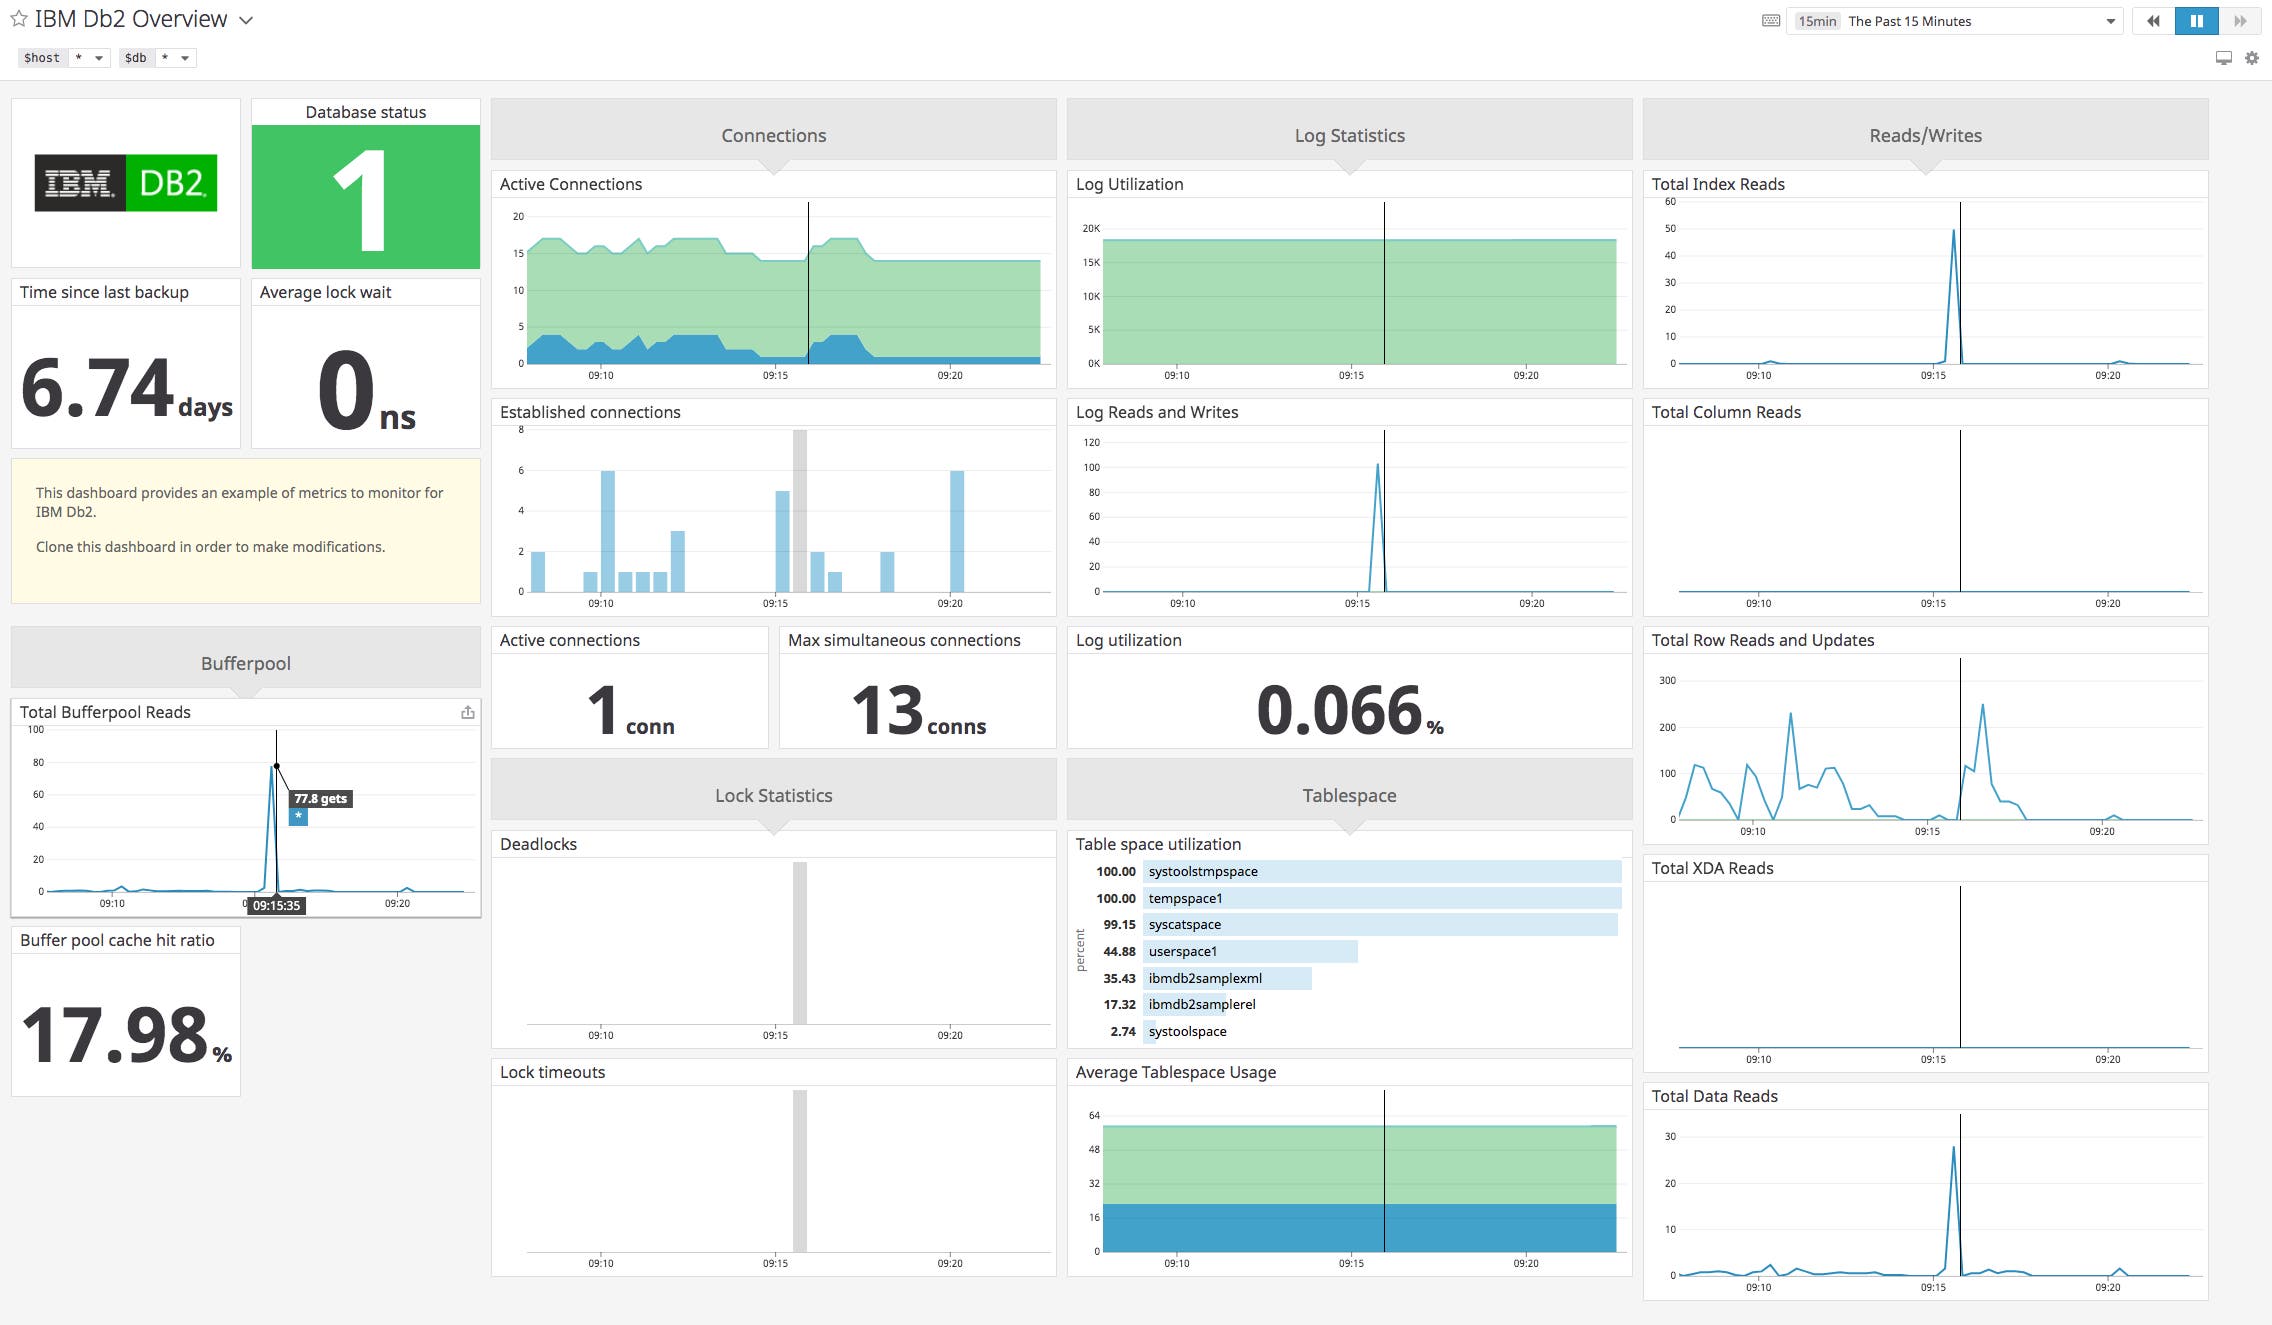
Our DB2 integration includes a built-in dashboard that displays key metrics about your instances’ availability, connections, query rates, and more. Your DB2 dashboard is a helpful starting point for troubleshooting issues and finding opportunities to optimize your DB2 infrastructure. It’s easy to add more detail to your dashboard, for example to display information about the resource usage of your DB2 servers.
Cache it if you can
To minimize the time your application spends reading data, you can cache query results in a
buffer pool—memory space that’s allocated to DB2 when the database server is started.
You should optimize your buffer pools to maximize the number of queries served from the cache, which is much faster than reading data from disk. You can monitor the performance of your buffer pools with the ibm_db2.bufferpool.hit_percent metric, which measures the percentage of read requests served from the cache. The screenshot below illustrates a rising buffer pool hit percentage, indicating that DB2 is increasingly able to serve data from its cache.
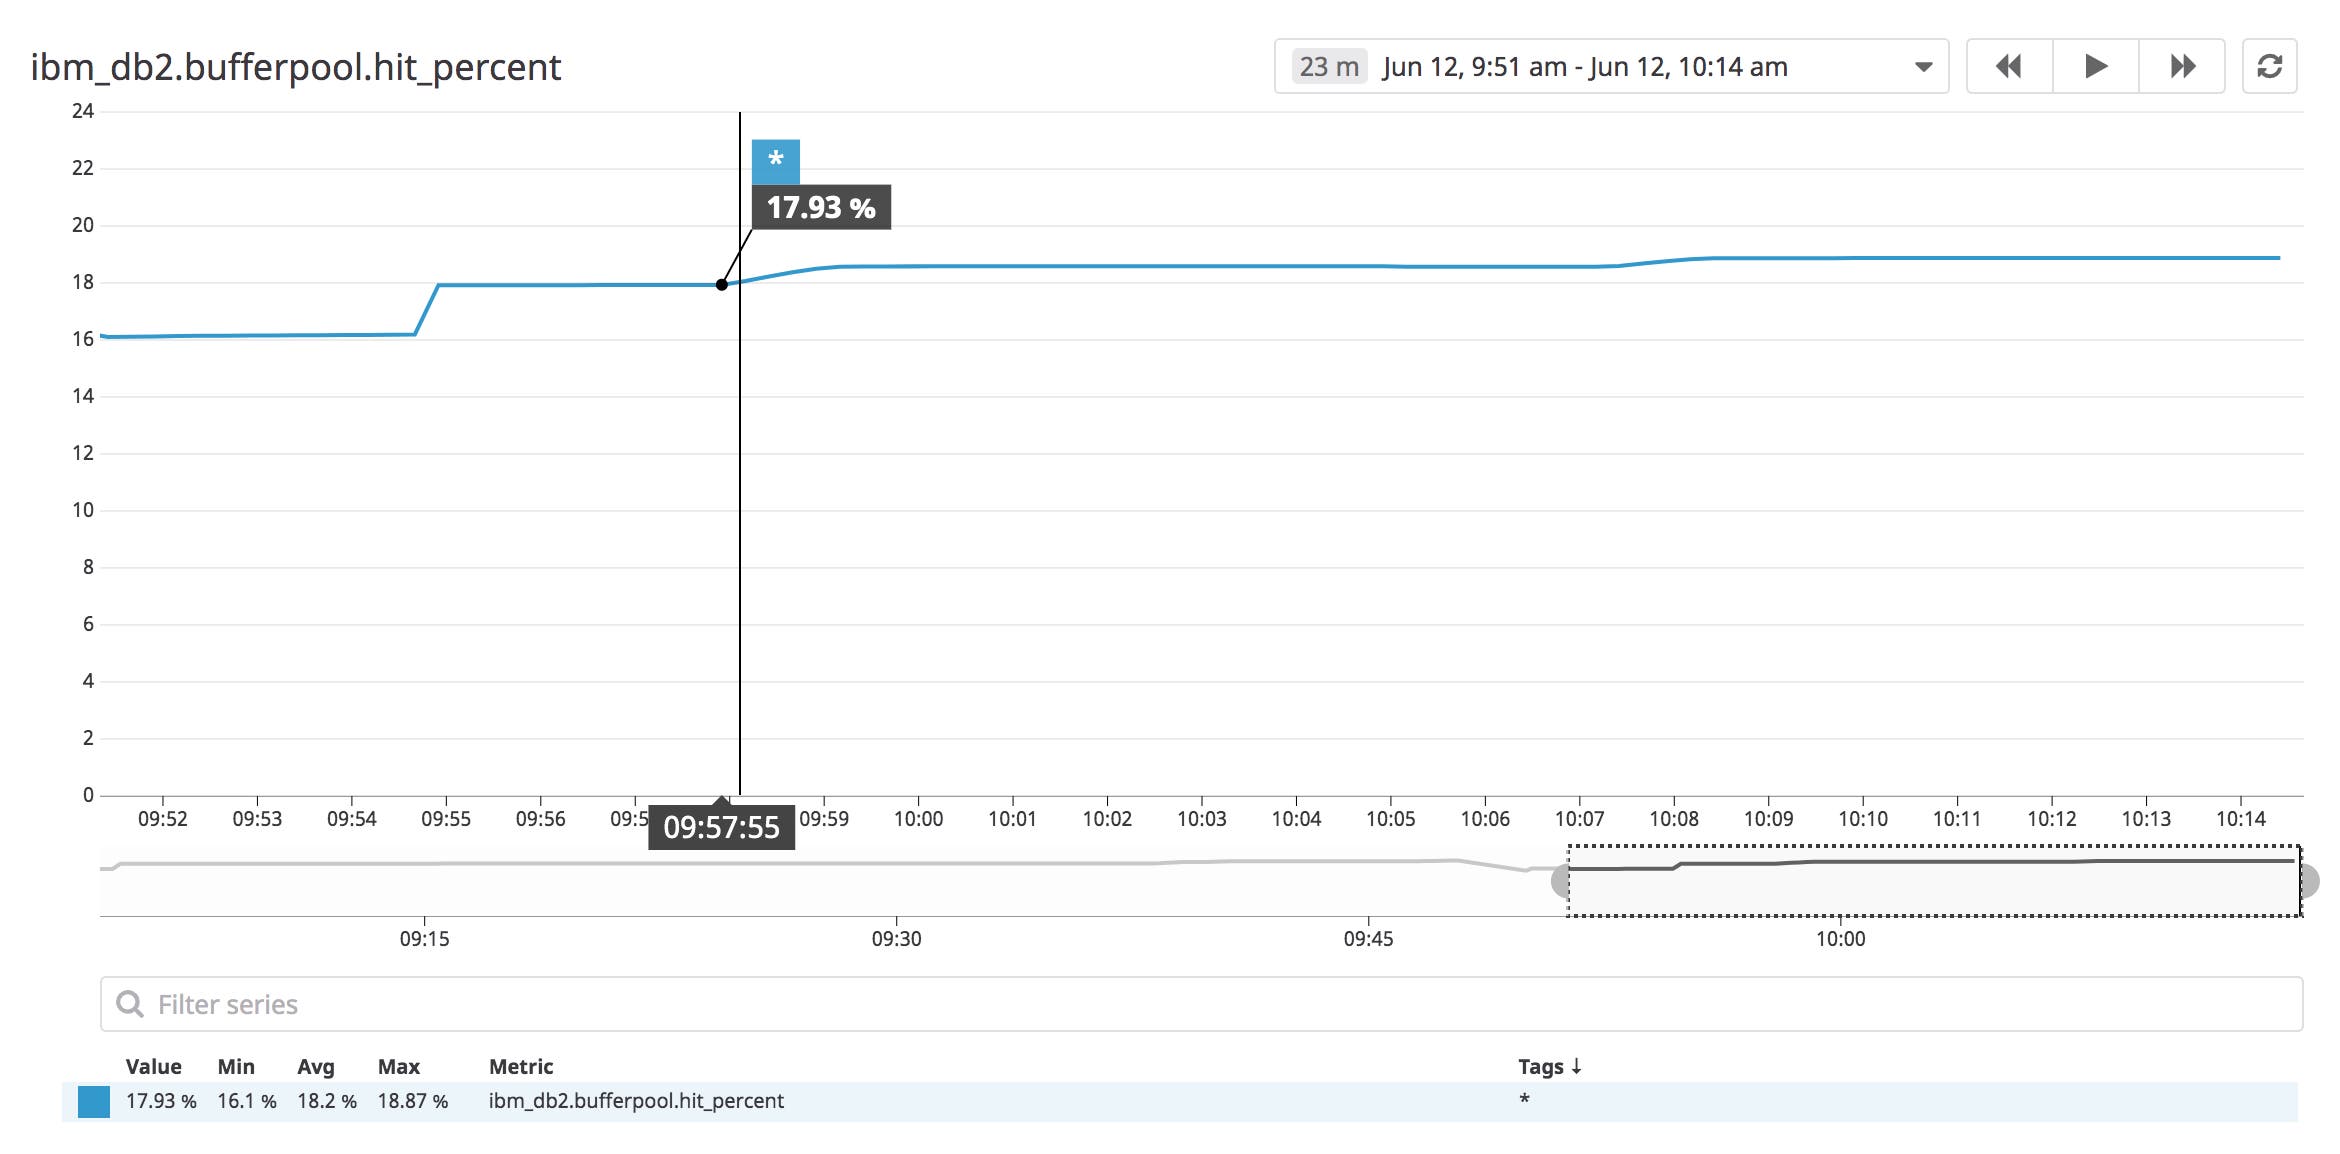
If your buffer pool hit percentage is low, it may affect the performance of your application. You can create an alert that will automatically notify you if ibm_db2.bufferpool.hit_percent falls below your desired limit. This way, you can take action before your application suffers any performance problems.
If you determine that you need to increase your buffer pool hit percentage, you can:
- configure DB2 to prefetch data into the buffer pool.
- expand the buffer pool. Refer to your Datadog dashboard to see if your DB2 host has free memory that you can allocate to increase the size of the buffer pool. If not, you should consider adding memory to the host. You can gain insight into your host’s memory usage by using DB2’s memory tracker command,
db2mtrk, to examine how your database server is using available memory.
See the DB2 documentation to learn more about managing your buffer pool.
Watch for inefficient queries
An efficient query can find and return the desired data without reading more table rows than necessary. To achieve this, you need to add indexes to your database, which allows DB2 to efficiently find and return the desired data without needing to read all of the rows in the table.
You can create a graph that compares how many table rows DB2 reads versus how many rows it returns, and use that to determine where adding an index can increase efficiency. In the screenshot below, each bar shows the number of table rows read (ibm_db2.row.reads.total, in light blue) compared to the number of table rows returned (ibm_db2.row.returned.total, in dark blue).

If a graph like this shows DB2 reading lots of rows and returning only a few, you can improve the efficiency of your queries by adding indexes. DB2 supports different types of indexes, so you can add the indexes that will be most beneficial for your application’s specific query patterns and data constraints.
In addition to indexing your data, you can improve the performance of your read queries by optimizing them. To learn about how DB2 processes SQL statements and the different ways you can optimize your queries, see the DB2 documentation.
Bring DB2 logs into Datadog
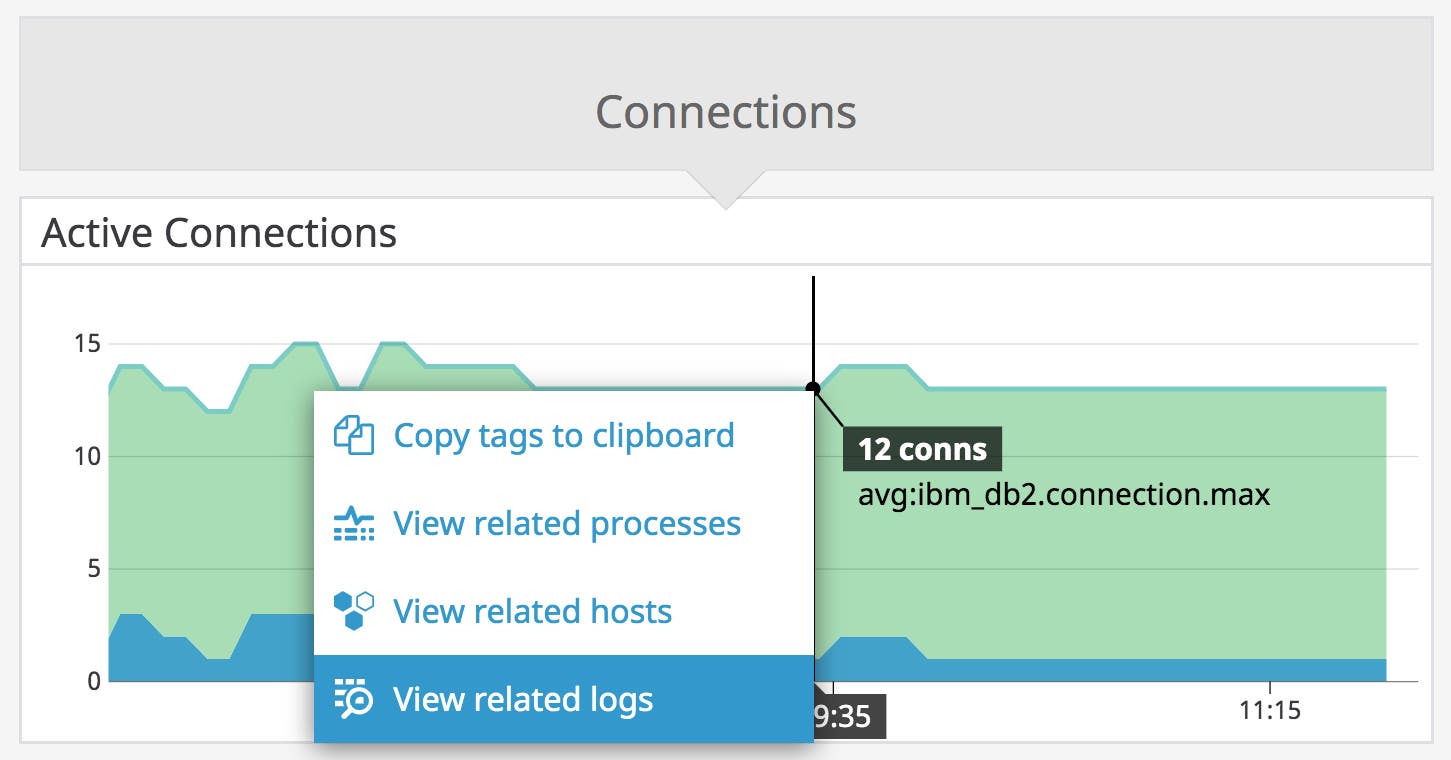
You can also collect and analyze DB2 diagnostic logs to get deeper insights into your DB2 metrics. The db2diag.log file stores administrative and diagnostic messages from your DB2 server, which can be valuable for troubleshooting. Once you’ve configured the Datadog Agent to collect logs, you can easily pivot from your DB2 dashboard to see related logs, which can provide useful context for debugging.
You can search, filter, and view your DB2 logs in the Log Explorer. The screenshot below shows how you can filter for DB2 logs by searching for source:ibm_db2 (which is specified in your DB2 integration’s configuration file). You can use facets and measures to filter the list even further, for example to isolate logs from a single DB2 host for targeted troubleshooting. The log displayed here shows an error that can occur if the database manager shuts down incorrectly or conflicts with another database manager instance.
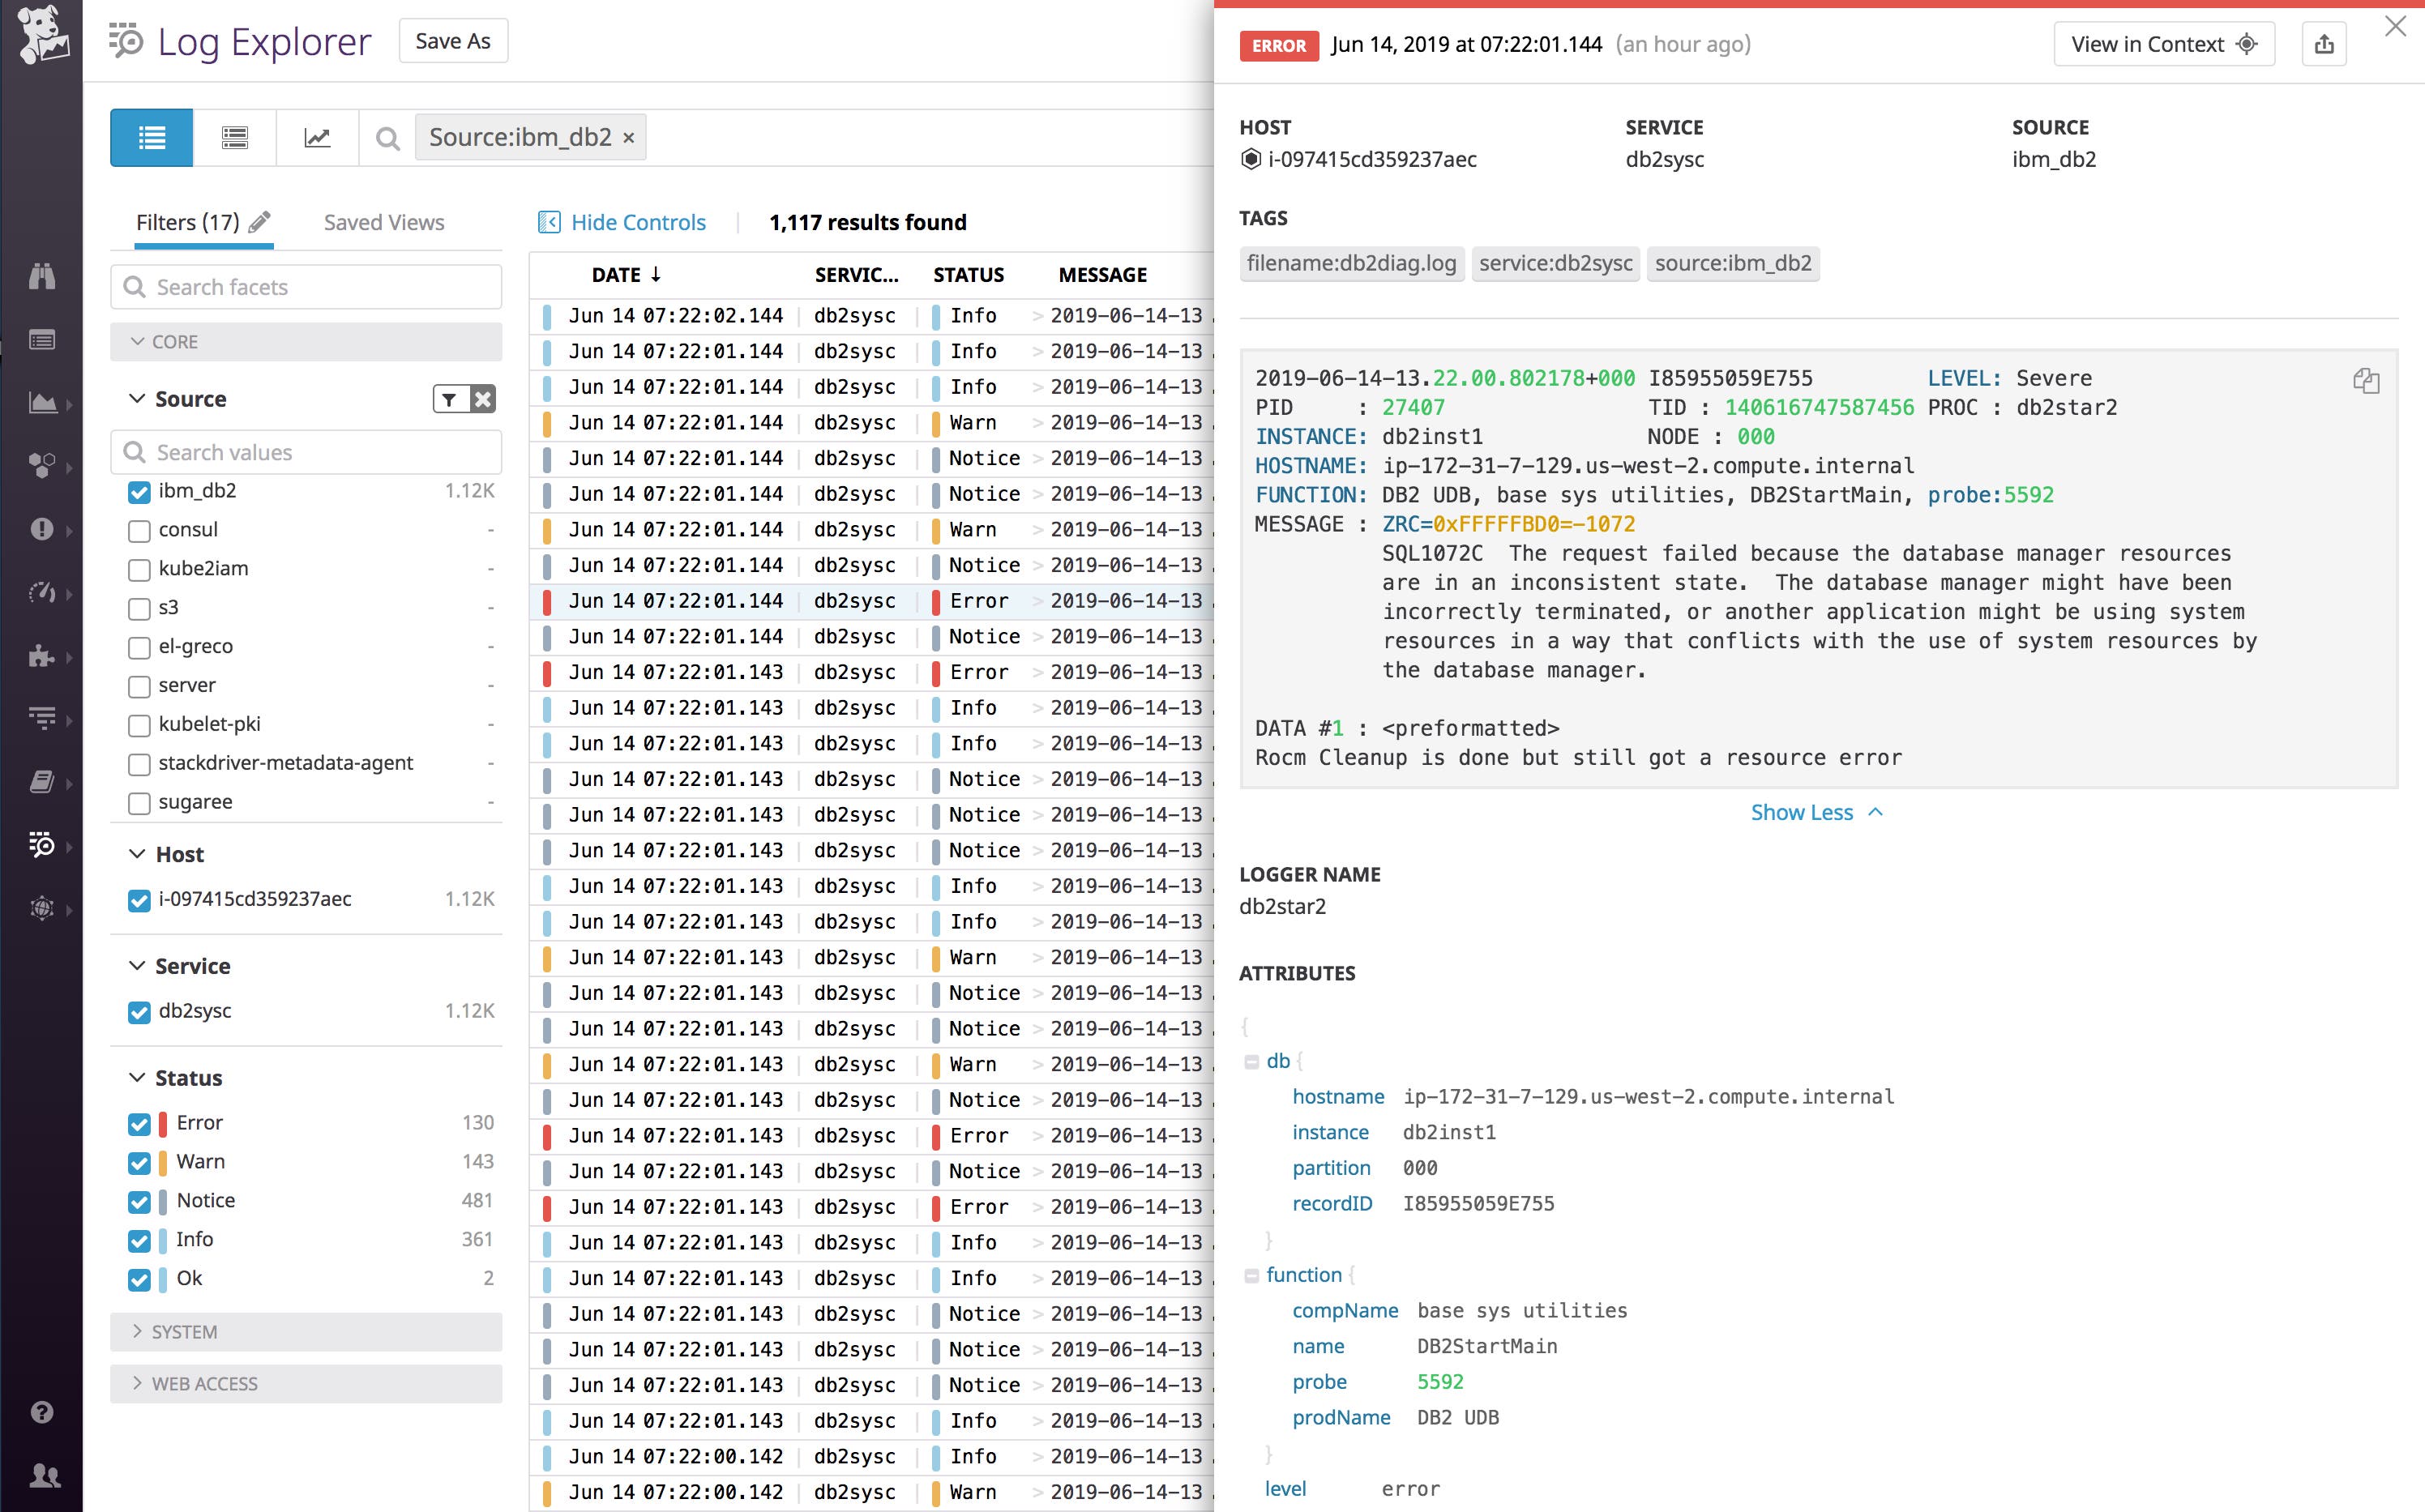
IBM recommends providing relevant entries from db2diag.log when you contact them for support. The DB2 dashboard and the Log Explorer make it easy for you to locate relevant log entries. You can even copy them to your clipboard with a single click to share them.
Start monitoring DB2
Once you’ve integrated DB2 with Datadog, you can get real-time visibility into DB2’s performance and spot areas you can optimize. Datadog integrates with more than 1,000 technologies, so you can monitor DB2 alongside related services like IBM MQ and WebSphere Application Server. If you’re not already using Datadog, you can start a full-featured two-week free trial.
