Abril Loya McCloud
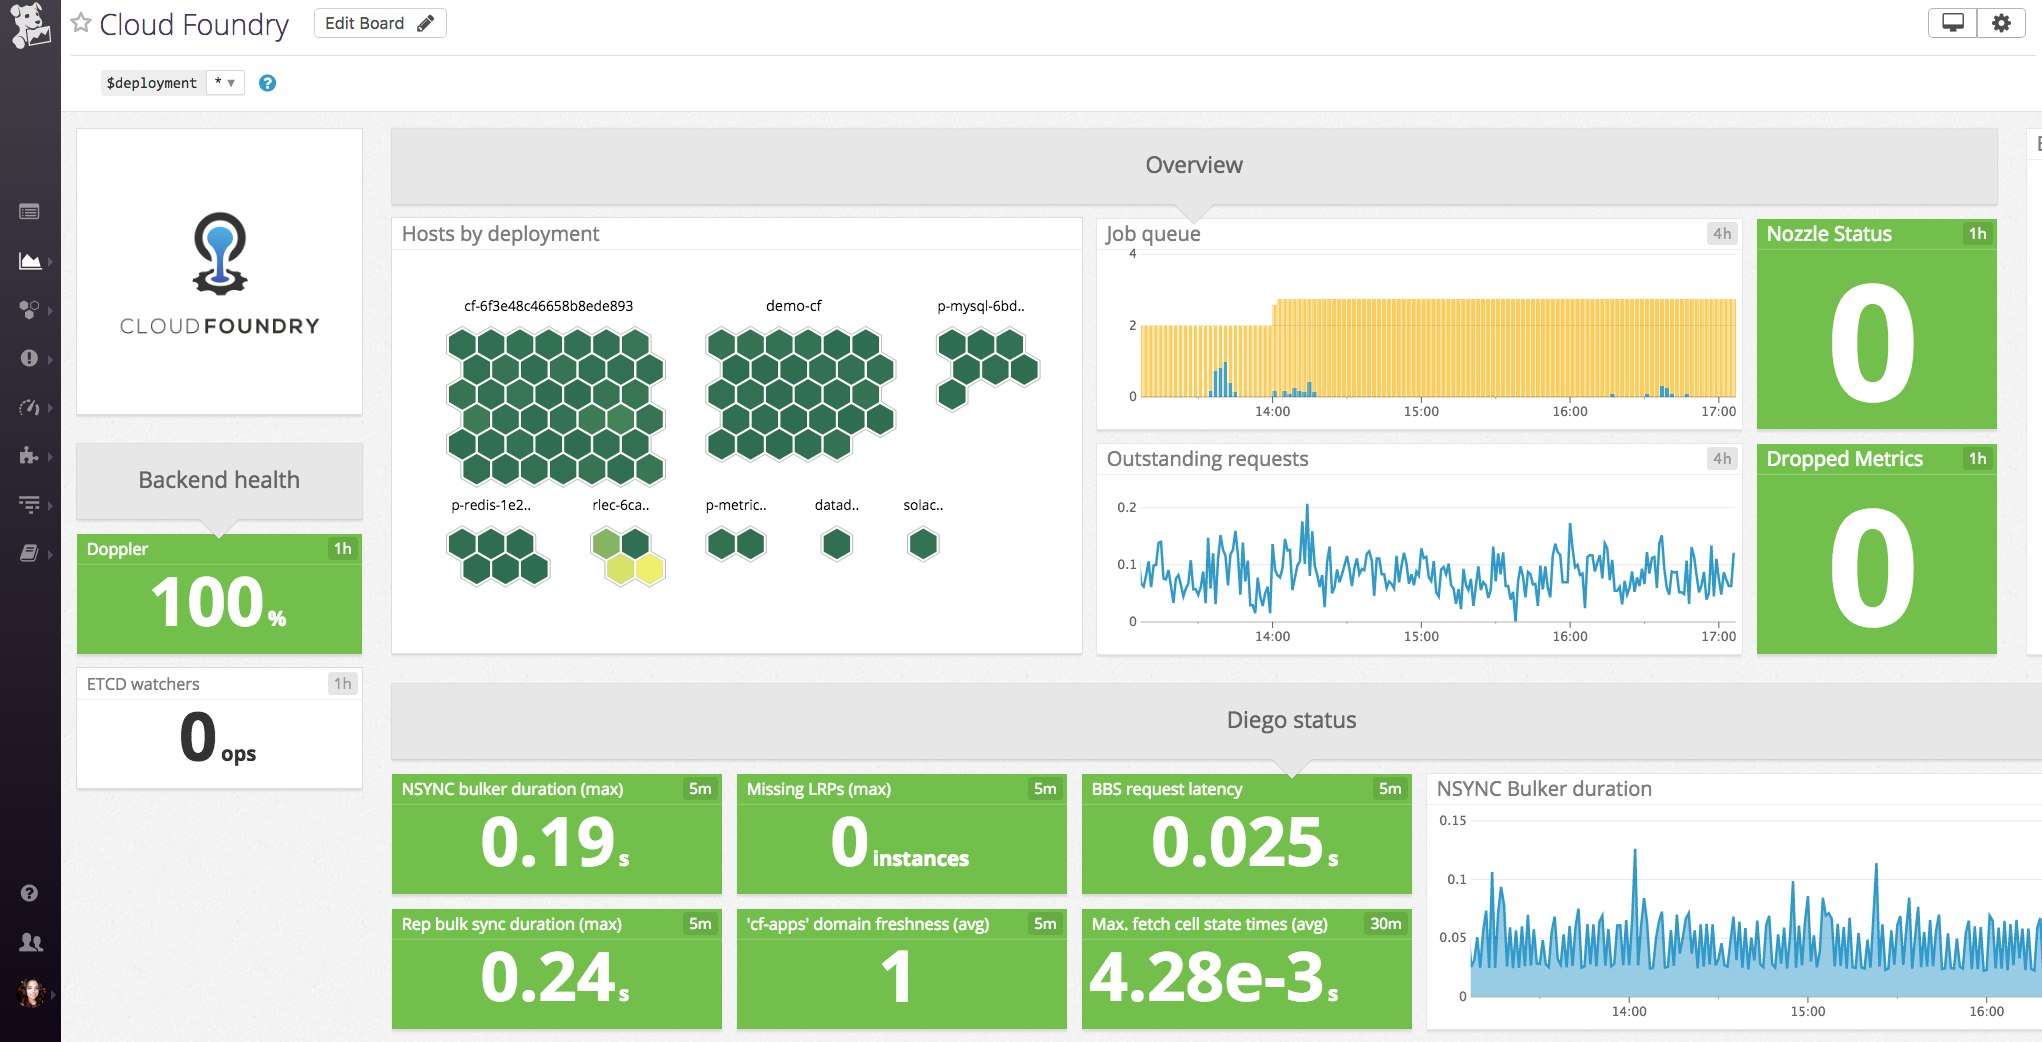
Cloud Foundry is an open source platform for developing applications and deploying them on any infrastructure. Cloud Foundry also provides a number of features that support distributed systems and microservice architectures. Because of the central role played by the Cloud Foundry platform in deployment and operations, monitoring your Cloud Foundry components is a must for maintaining the health and performance of your applications. Datadog is happy to announce our new Cloud Foundry integration, designed to help Cloud Foundry operators automatically monitor the health of their clusters.

Understanding Cloud Foundry
Before diving into how you can monitor Cloud Foundry clusters along with the rest of your infrastructure in Datadog, we’ll quickly review how Cloud Foundry works. Cloud Foundry serves as a layer between your applications and your infrastructure, making your applications infrastructure-unaware. Cloud Foundry automatically provisions resources and services for your applications, which can run in virtually any environment. To accomplish this, Cloud Foundry uses four main components, as outlined in their documentation:
- BOSH: creates and deploys cluster components and VMs that Cloud Foundry runs on top of your physical infrastructure.
- Cloud Controller: API server that provides endpoints for clients to access system resources.
- Router: routes incoming traffic to VMs and containers to meet demand when used with a load balancer.
- Diego: container orchestrator.
Each Cloud Foundry component, including the Cloud Controller VM and router VM, generates logs and metrics. Loggregator aggregates these logs and metrics into a data stream called the Firehose. Log and metric outputs in the Firehose can be filtered by applying “nozzles.”
Monitoring Cloud Foundry
Datadog collects metrics via a Firehose nozzle to determine cluster health by component and by resource consumption. Metrics are collected from critical Cloud Foundry components, including BOSH, Cloud Controller, Loggregator, router, and Diego. Datadog also monitors the nozzle providing data to ensure it is keeping up with Firehose for accurate metric and event information. The full list of metrics can be accessed in our Cloud Foundry documentation.
Metrics from these components are collected and visualized so you can monitor their performance, identify patterns and anomalies, and create alerts. An unexpected increase in the rate of 5xx code responses from your router, for example, could be symptomatic of flawed application code being deployed and would warrant immediate investigation. Setting an anomaly alert on any metric will automatically notify you when performance deviates from the norm, helping you make sure your application development and deployment go smoothly.
Get started
To monitor your Cloud Foundry clusters automatically, you can upload the Datadog Agent release to your BOSH Director, configure the Agent as an add-on to deploy, and add a UAA client for the Datadog nozzle as outlined in our documentation. You can also monitor BOSH deployments by configuring the BOSH Health Monitor Datadog Plugin as detailed here. Once you’re set up, the Agent will automatically monitor the function and processes of each component through the Firehose nozzle.
If you’re already a Datadog customer, you can start monitoring your Cloud Foundry clusters immediately. Otherwise, sign up for a free trial to gain deeper insight into your cluster health.


