Abril Loya McCloud
AWS Redshift is a fully-managed data warehouse designed to handle petabyte-scale datasets. Redshift is beloved for its low price, easy integration with other systems, and its speed, which is a result of its use of columnar data storage, zone mapping, and automatic data compression.
Data warehouse performance is important for both end-user experience as well internal business intelligence and analytics. In the case that Redshift performance degrades, you want to know right away. Fortunately, with Datadog’s Redshift integration you can automatically collect and visualize overall Redshift health and individual cluster health metrics to help you ensure your cluster performs optimally.
(Red)Shift your data into gear
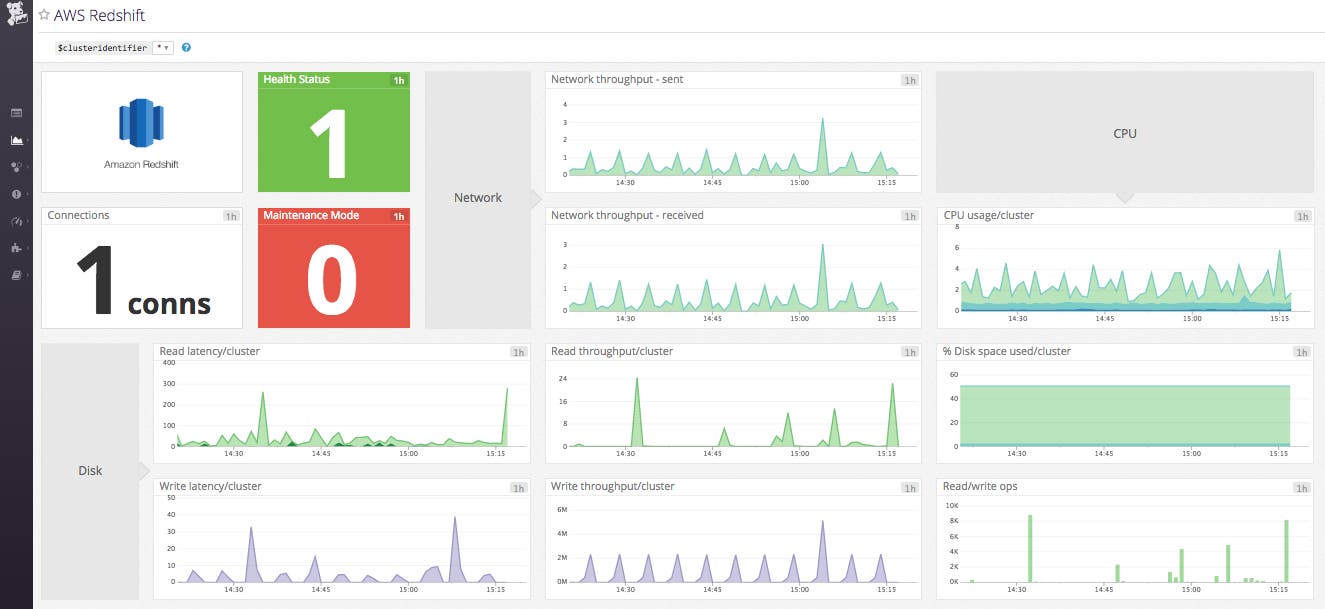
Datadog’s Agent automatically collects metrics from each of your clusters including database connections, health status, network throughput, read/write latency, read/write OPS, and disk space usage. The out-of-the-box Redshift dashboard provides you with a visualization of your most important metrics.

Datadog allows you to easily keep track of your disk usage by displaying both the percent of disk space your clusters are currently using as well as the rate at which bytes are read and written from your disk per second. Low disk space can indicate a need to add or change nodes, vacuum your tables, or archive data Redshift may be querying unnecessarily. Do keep in mind that vacuuming tables will temporarily use more disk space and slow performance as the command is performed.
Network throughput and IOPS are also key metric groups to monitor. Throughput refers to data transfer speed while IOPS (input/output operations per second) measures the number of operations completed per second from beginning to end. Network throughput, shown in bytes/s, refers to the rate at which data is sent and received by your individual nodes and their respective clusters.
Reduced performance can be addressed in a few ways. A good place to start is ensuring your Workload Management (WLM) is configured properly to prioritize queries and distribute workload across queues. You can also add system resources to your cluster by increasing the number of nodes, resizing the existing nodes, or changing the type of nodes it contains. Redshift nodes are available in two varieties: dense storage nodes and dense compute nodes. Dense storage nodes use hard disk drive storage and are ideal for large data workloads while dense compute nodes use solid state drive storage and are better for high-performant workloads. Depending on the size and rate of growth of your Redshift datasets, changing your node type can make a difference in performance.
Stay ahead of the curve
Once you’ve established baselines for your cluster metrics, you can also set up custom alerts to notify you in case of important changes in any of your metrics. Alerts can inform you of sudden degraded performance or give you ample warning that it may be time to scale up.
In case you do experience any performance issues, you can also use Datadog to correlate your Redshift metrics with metrics from the rest of your infrastructure and get to the bottom of your performance issues quickly.
Get started
If you’re already a Datadog customer using the main AWS integration, you can enable Redshift metric collection by checking the box within the integration configuration screen within the app. Otherwise, you can sign up for a free Datadog trial and start monitoring your clusters today.


