Mary Jac Heuman
With AWS’s announcement that macOS instances are available on Amazon EC2, iOS, macOS, and Safari developers now have the opportunity to move their build and test pipelines to the cloud and take advantage of all that the AWS ecosystem has to offer. Developers using xCode or Swift looking to modernize their CI/CD pipelines can enjoy the same flexibility and cost benefits as their Windows and Linux counterparts, including access to key AWS services for security, storage, and networking; freeing up on-site storage; and automated infrastructure updates and maintenance.
With Datadog, you can easily monitor your macOS EC2 instances along with the rest of your stack. The Datadog Agent fully supports macOS 10.10 and above, giving you insight into the health and performance of your instances. And with our AWS integration, you can get out-of-the-box visibility across all your AWS services.
Get the whole picture of your macOS instances
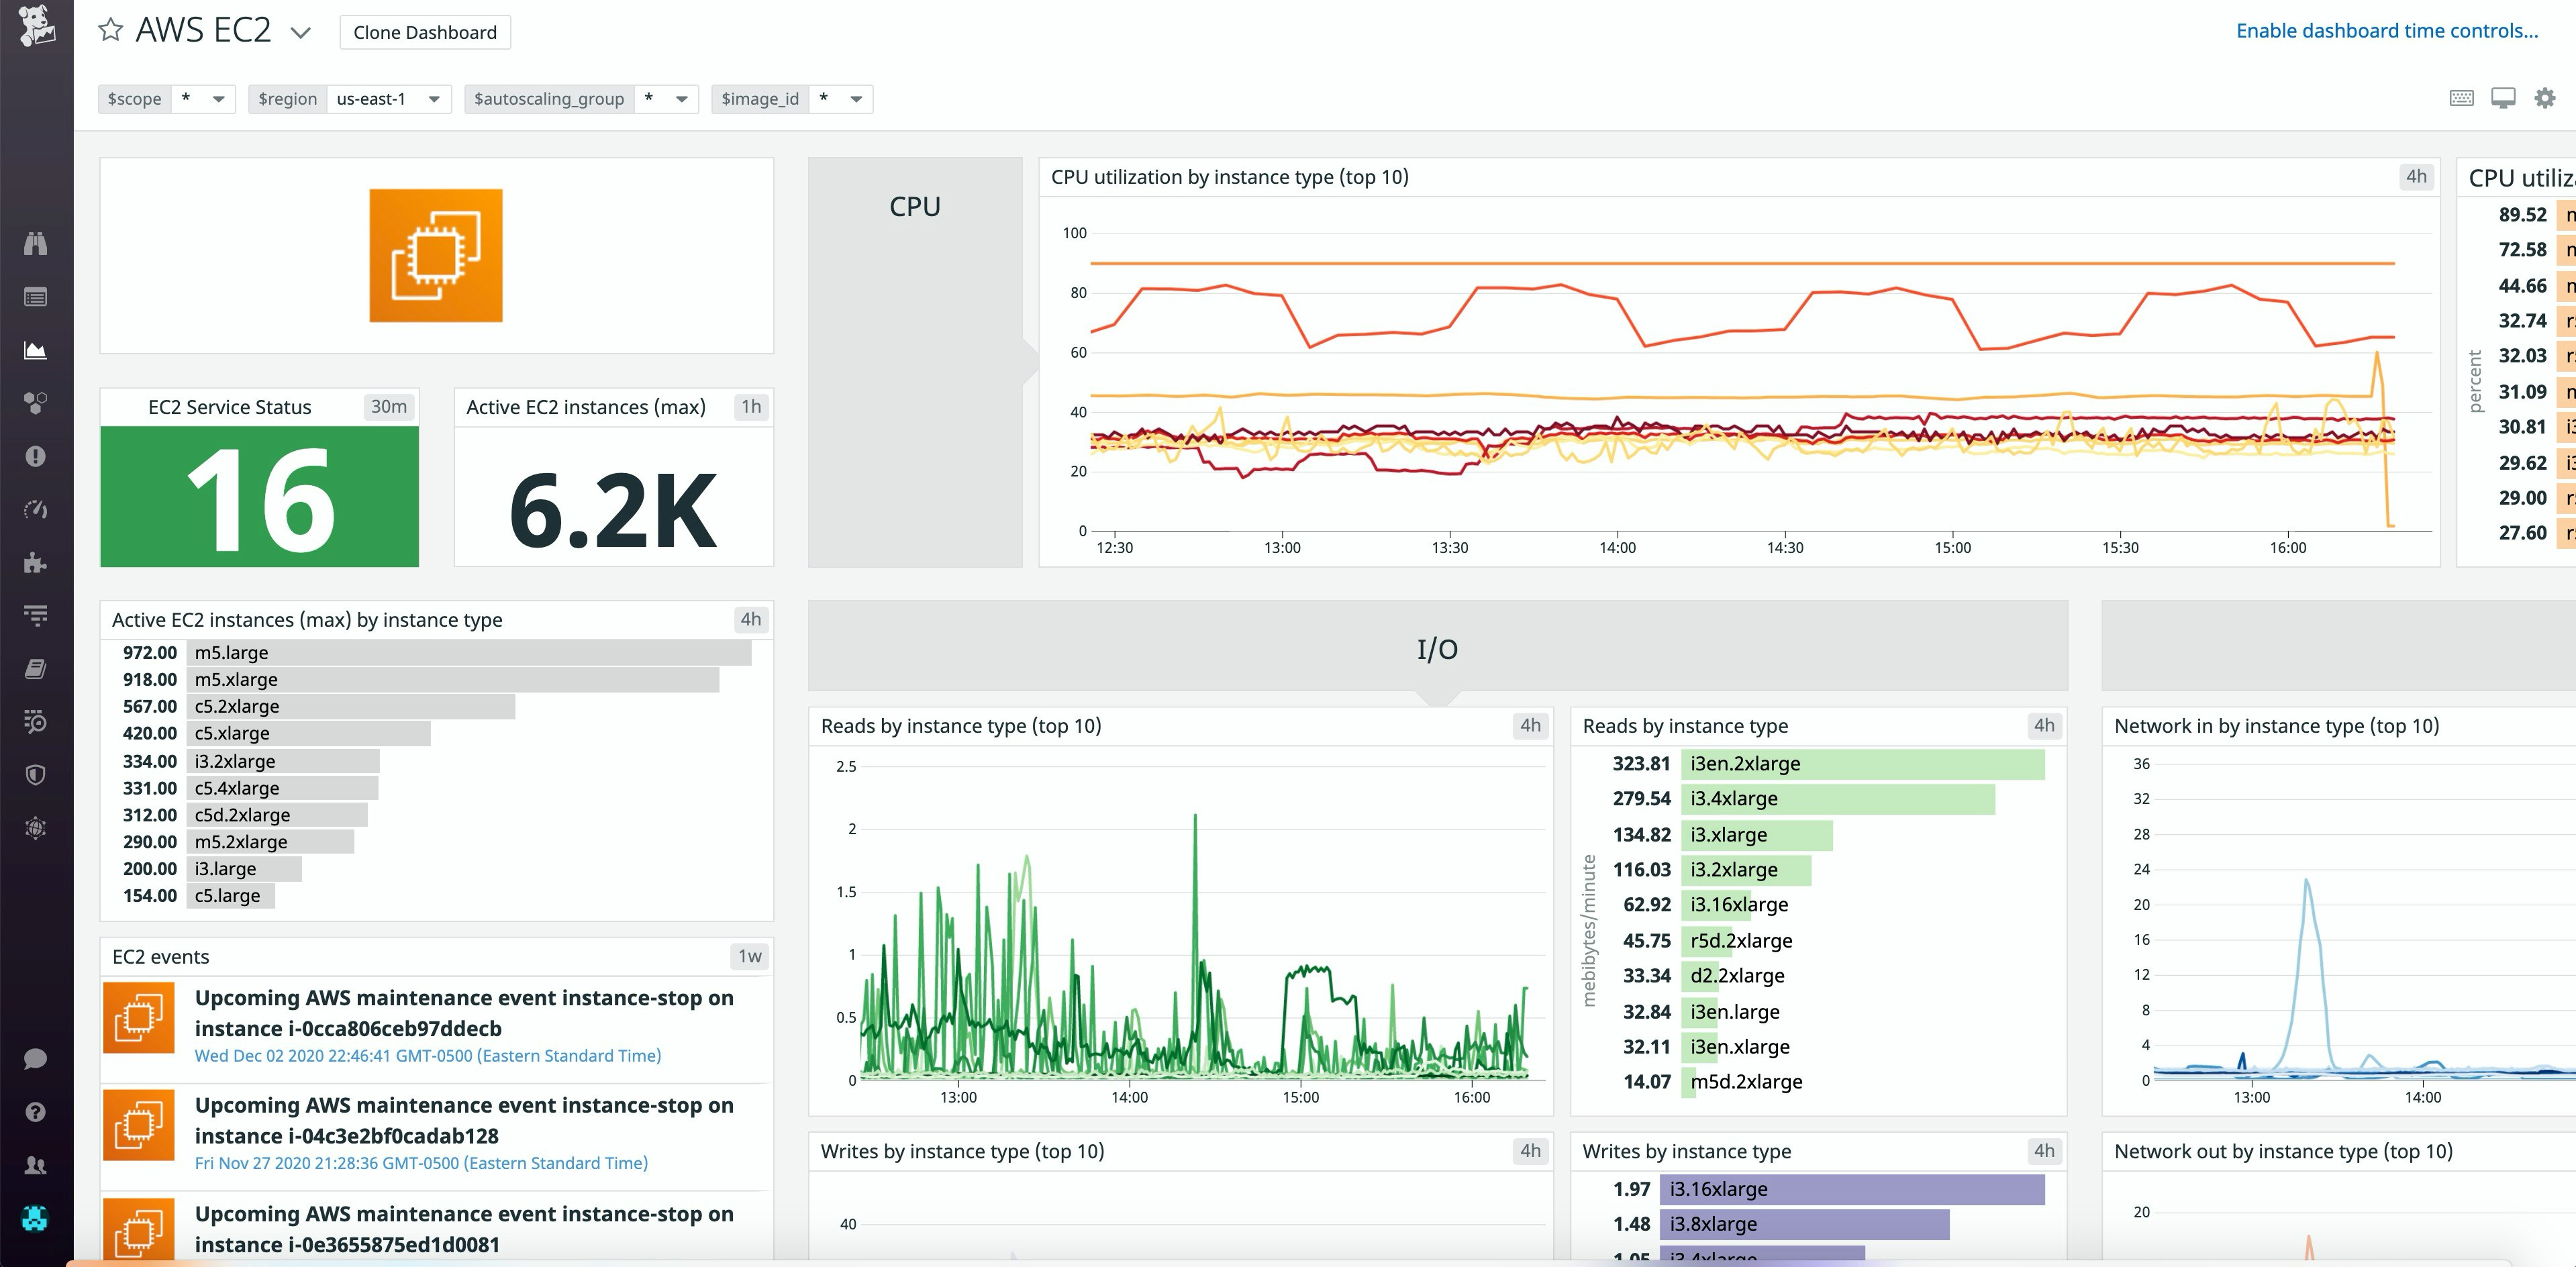
Once you’ve enabled the AWS integration, Datadog will immediately begin collecting CloudWatch data from all of your instances and populate an out-of-the-box dashboard that visualizes key EC2 metrics. These include CPU utilization, disk I/O, and network throughput, helping you identify, for example, parts of your EC2 infrastructure that are experiencing heavier than usual load. You can easily scope and customize your dashboards further to fit your needs by showing, for instance, a detailed cost breakdown of your AWS services, or metrics from other AWS services and parts of your stack.

For even more granular insights into your instances, you can deploy the Datadog Agent. Installing the Agent enables you to collect additional system-level metrics as well as metrics, logs, and traces from any of the 1,000 integrations you might be running on your instances.
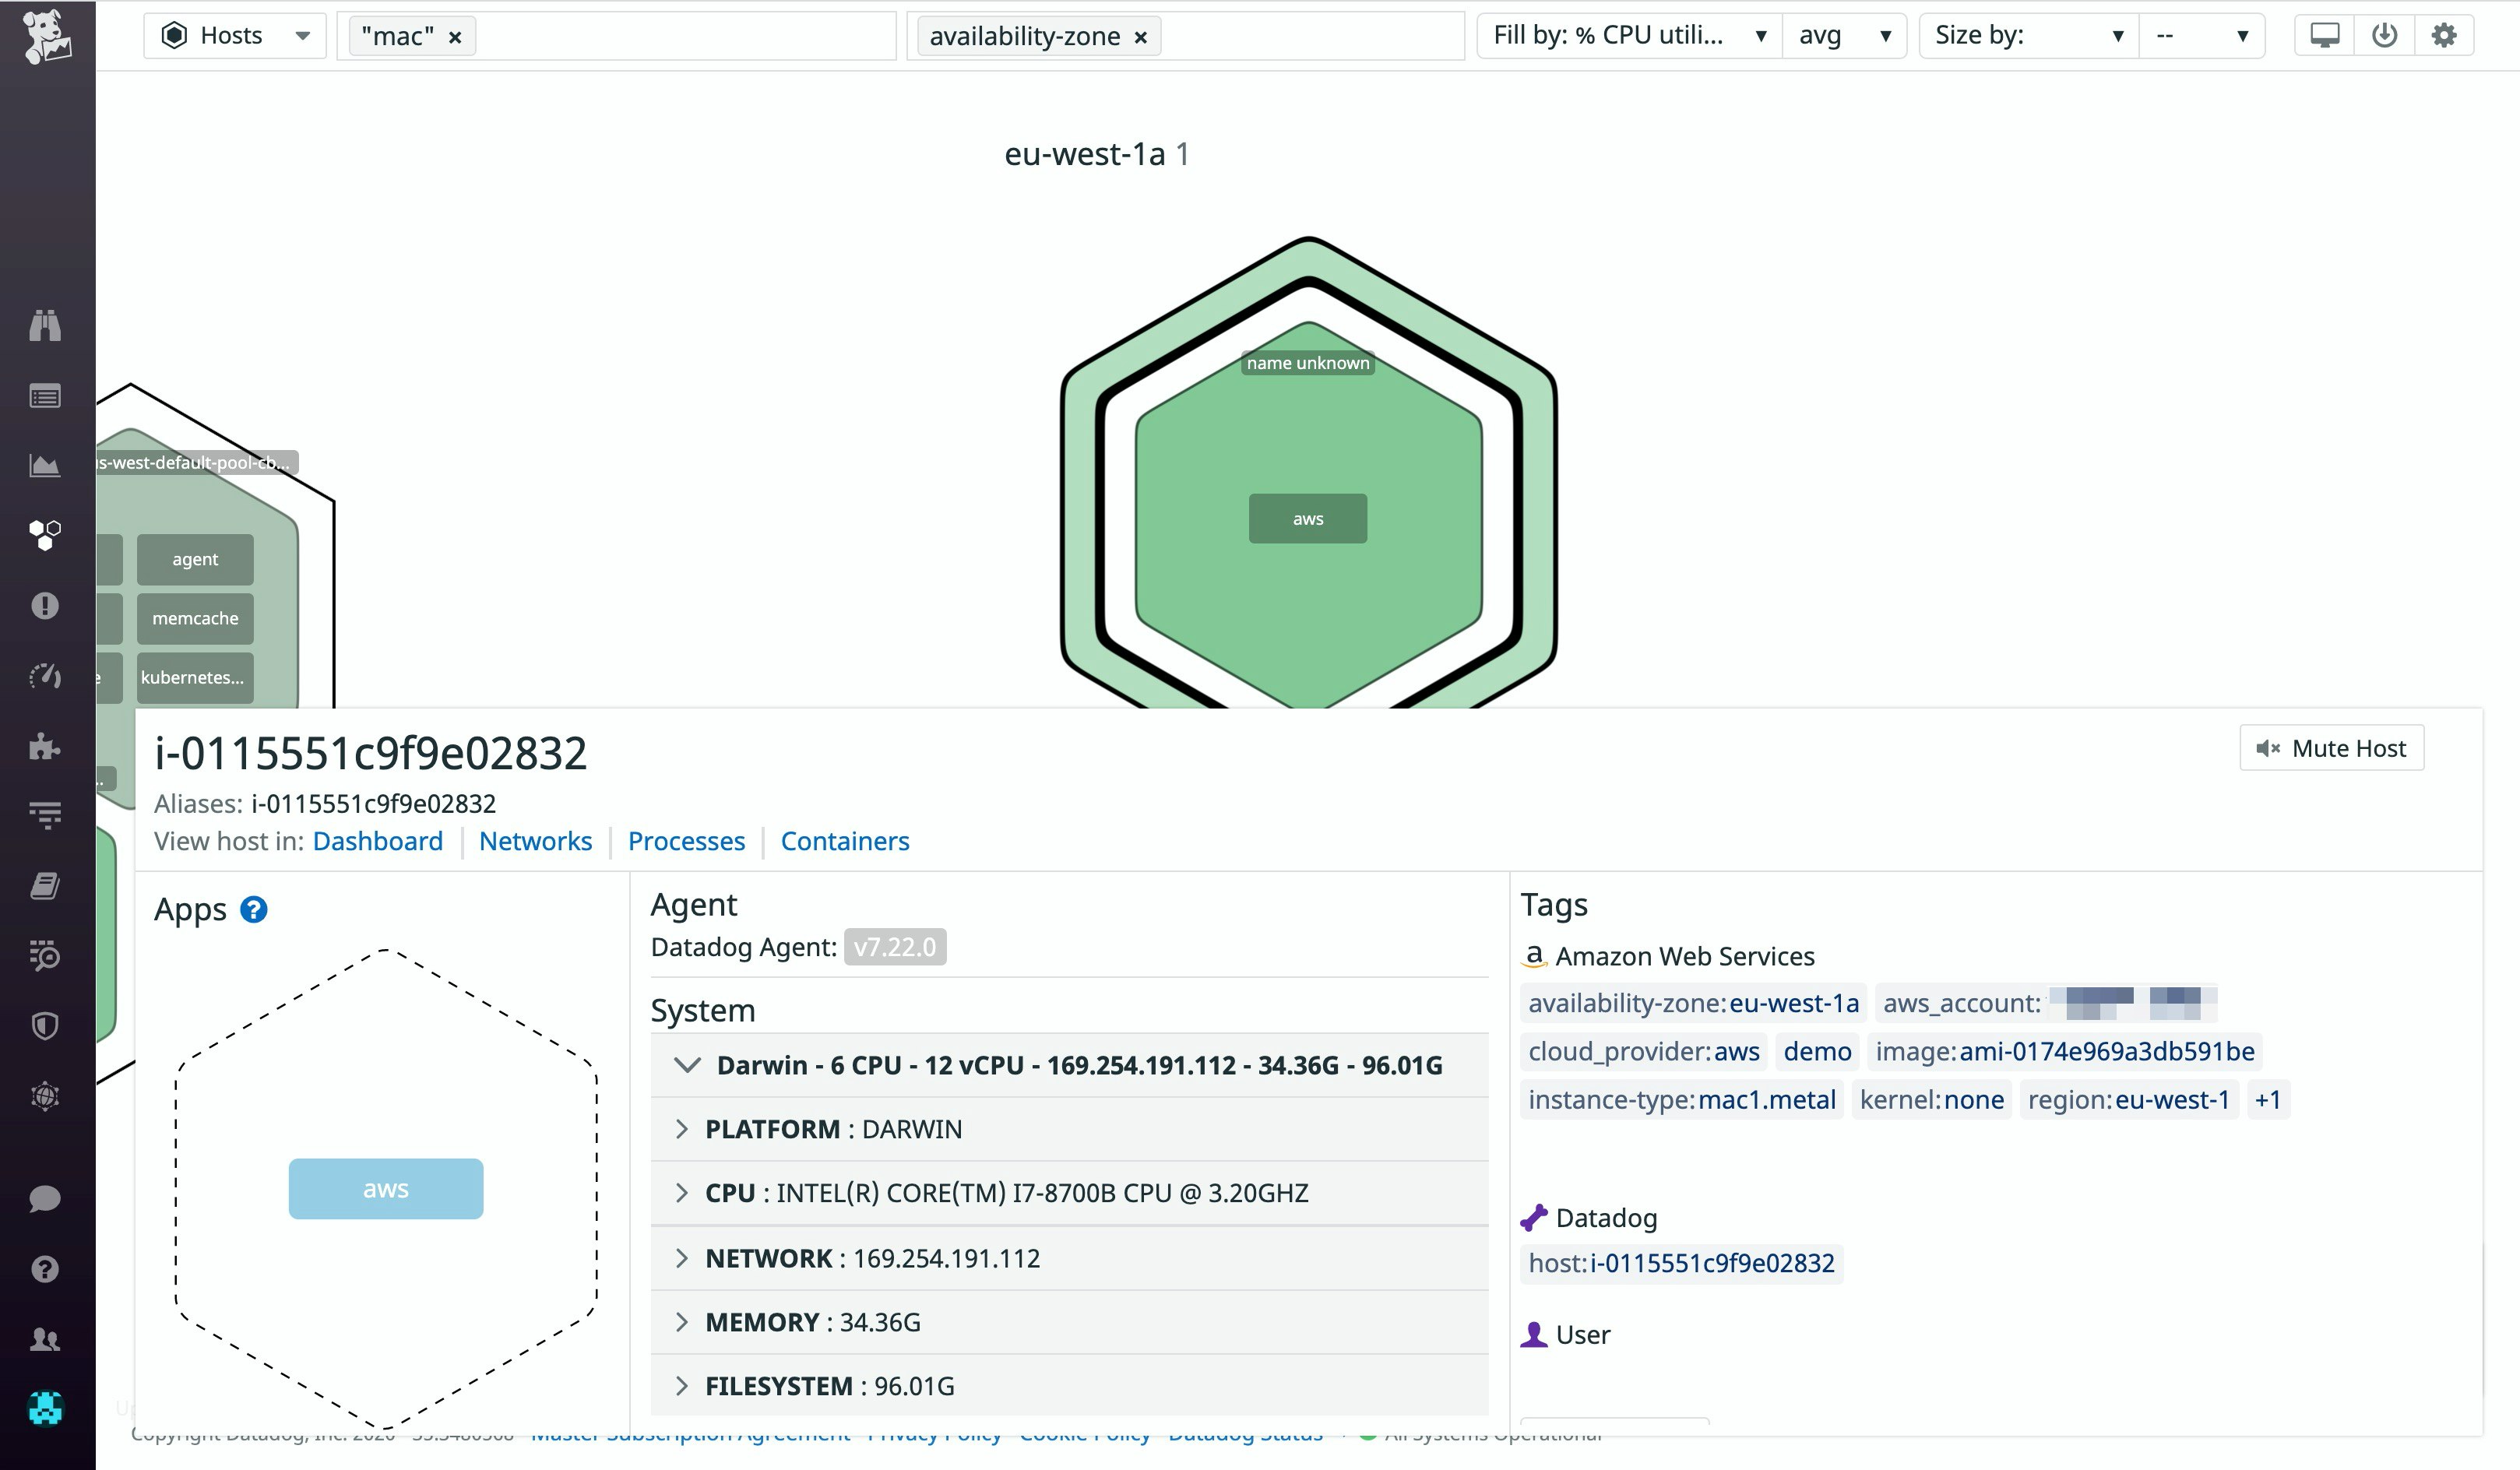
The Host Map gives you an overview of your entire EC2 instance infrastructure and lets you visualize key health indicators like CPU and memory usage. For quick organization, you can group and filter your hosts by tags, like availability zone or instance type. With this high-level view, you can ensure that instances are acting as expected and know exactly where to start investigating when problems arise.

Monitor each step of your development lifecycle
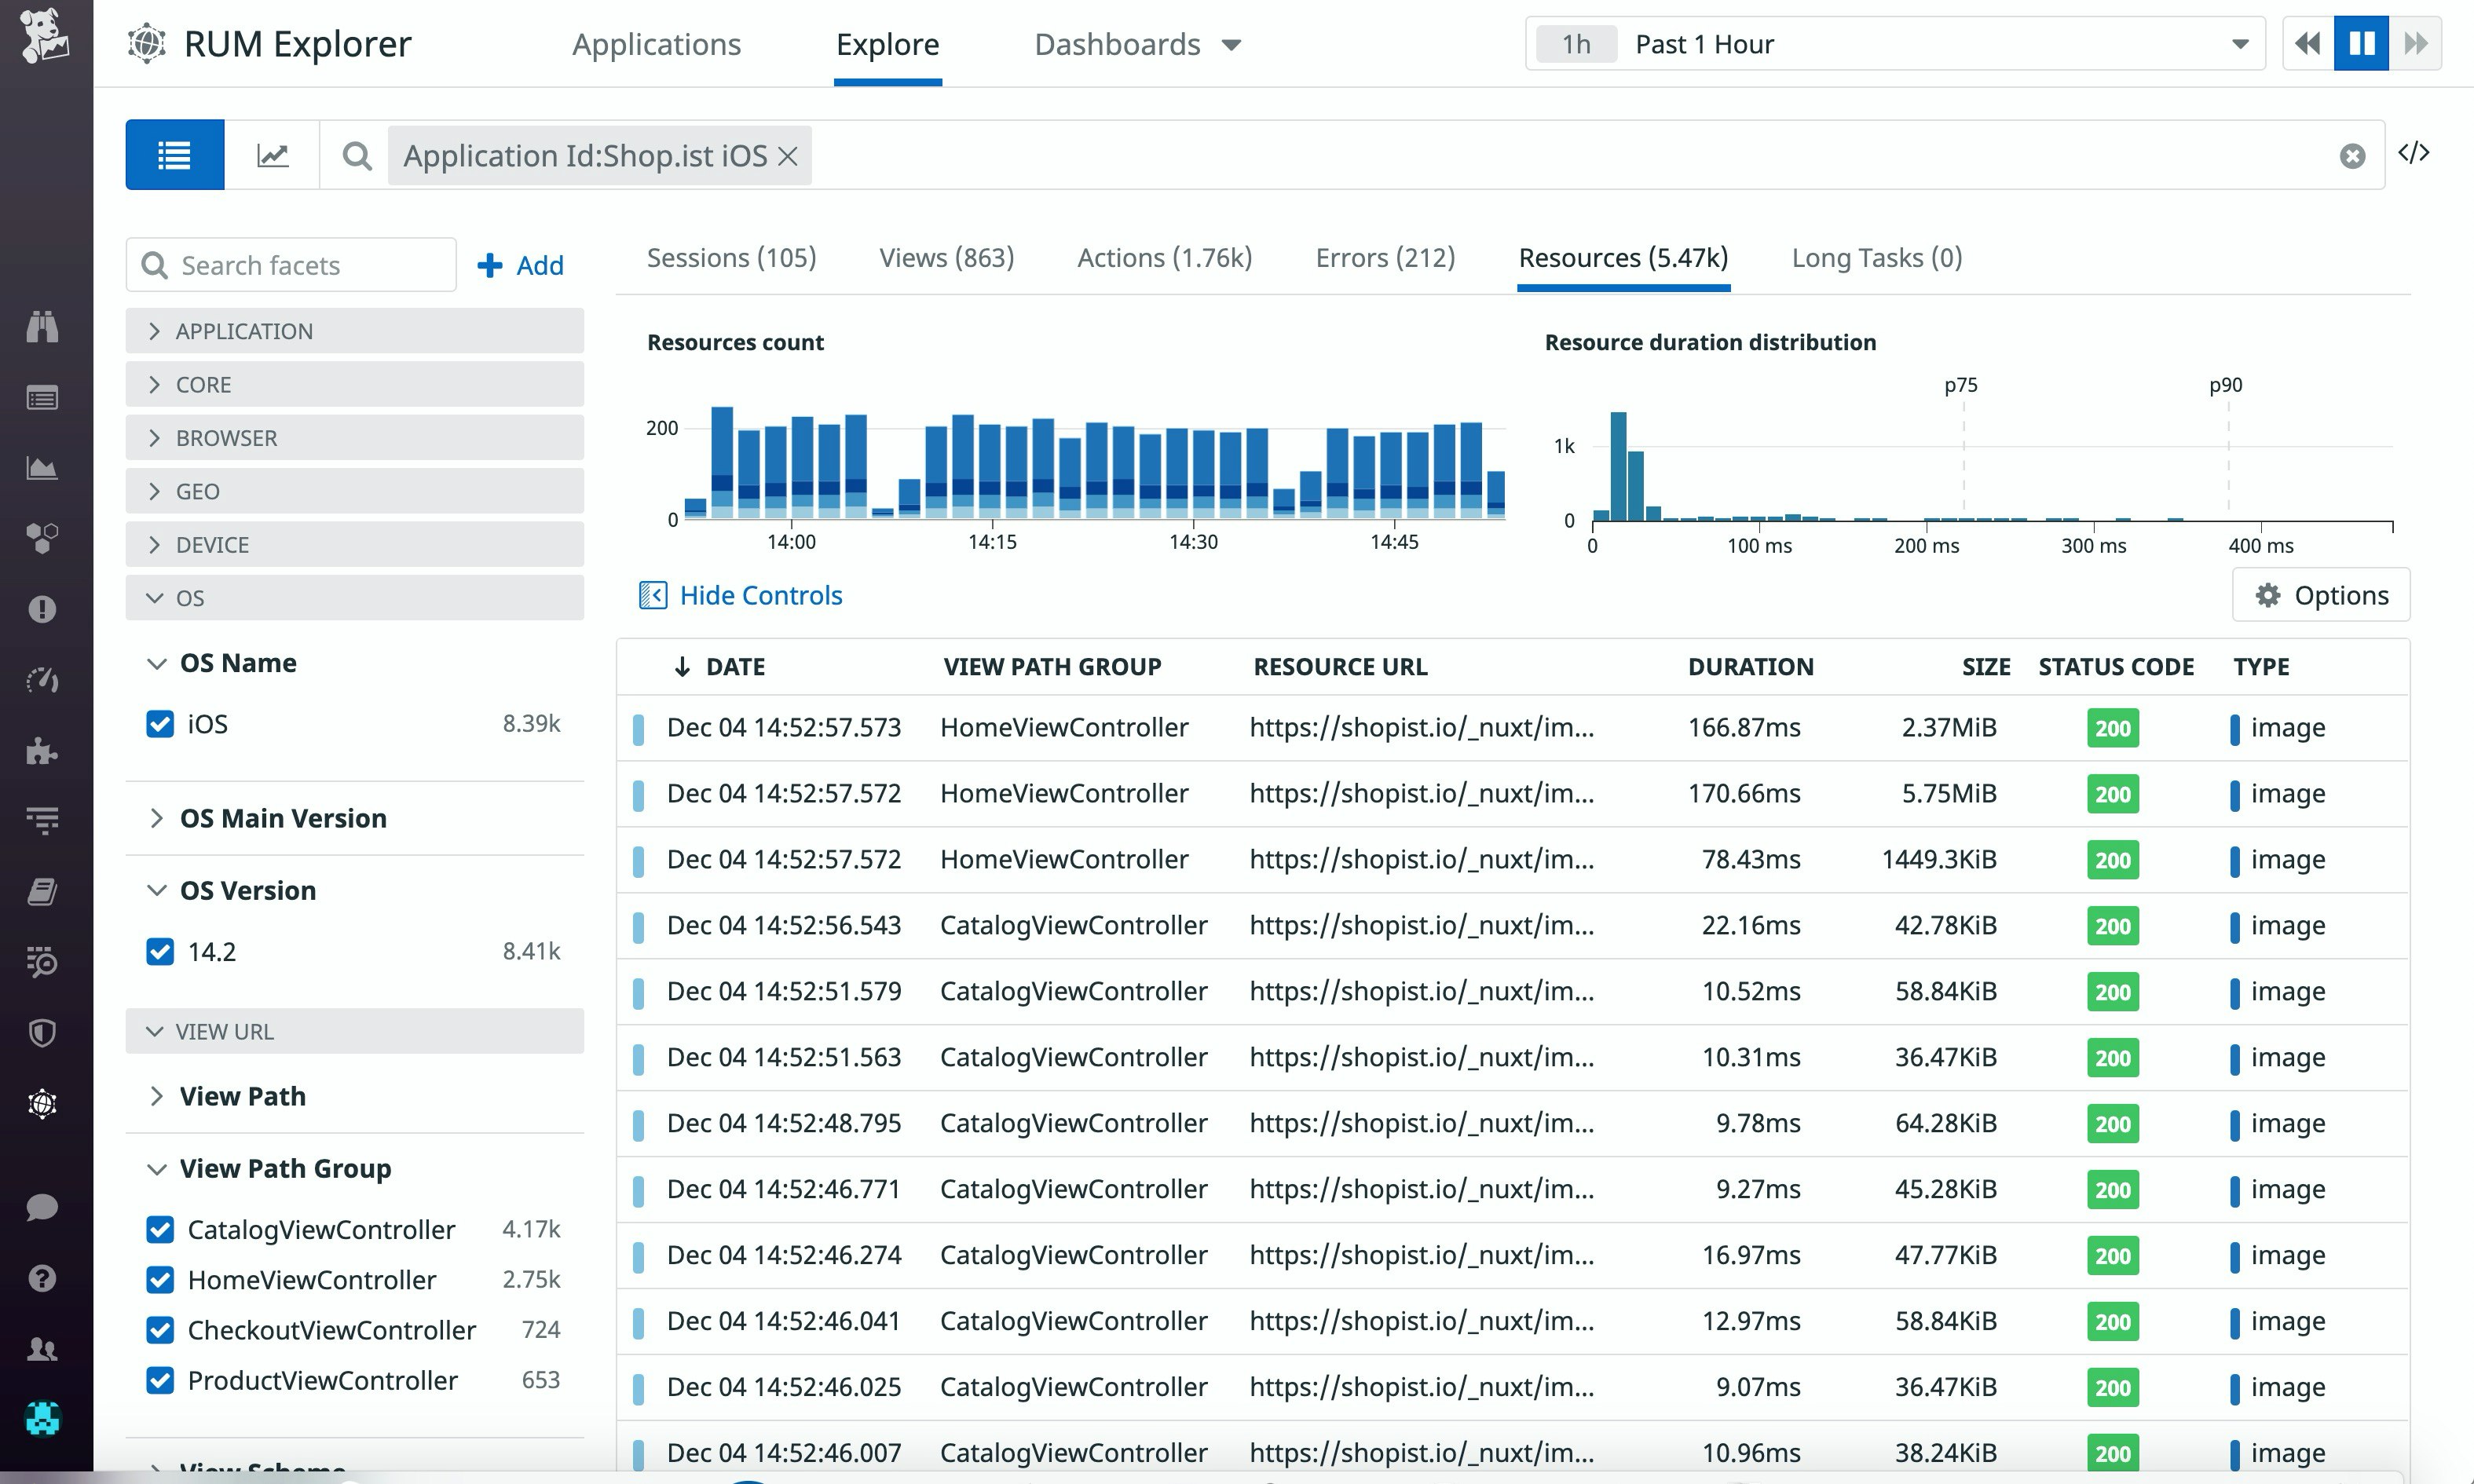
For Mac developers who can now integrate AWS EC2 into their development pipelines, Datadog offers a whole suite of tools to continuously monitor CI/CD workflows. Integrations with popular continuous integration services mean you can track the health and performance of your build-test pipelines alongside metrics, logs, and traces from your applications and underlying infrastructure to identify problems and make intelligent decisions on development. For example, create a dashboard that visualizes Jenkins build jobs with your instances’ CPU usage in real time to see if any builds cause unusual spikes. Once your iOS application has been deployed to the App Store, you can use Mobile RUM to monitor real user interactions with it to give you insights on engagement, performance, and errors.

Monitor all your Macs today
With AWS’s support for macOS EC2 instances, developers of macOS and iOS applications can move their build-test pipelines to the cloud. But along with increased flexibility and cost-effectiveness, end-to-end visibility into your entire stack and CI/CD workflows is vital to monitoring the health and performance of your applications and underlying infrastructure. Datadog offers everything you need to get insights into the performance of your macOS instances alongside the rest of your stack, so you can identify and troubleshoot problems when they arise.
Get started monitoring your macOS instances today by deploying the Datadog Agent and setting up the AWS integration. Or, if you’re new to Datadog, you can start a free 14-day trial here.


