Idan Gindi

Ariana Ling

Mallory Mooney
Today's modern applications are made up of thousands of loosely connected private and publicly exposed APIs, each serving a specific function. This dynamic API landscape, in combination with the decentralized nature of microservice development, can be overwhelmingly challenging to manage—let alone govern or secure adequately. API sprawl is often created as a result, leading to fragmented or nonexistent internal API documentation, knowledge bases, and toolsets. These environments can also introduce orphaned and zombie APIs, which make applications more vulnerable to an attack. Together, issues like these create an imbalance between developing new features and triaging performance and security issues, which ultimately leads to product instability.
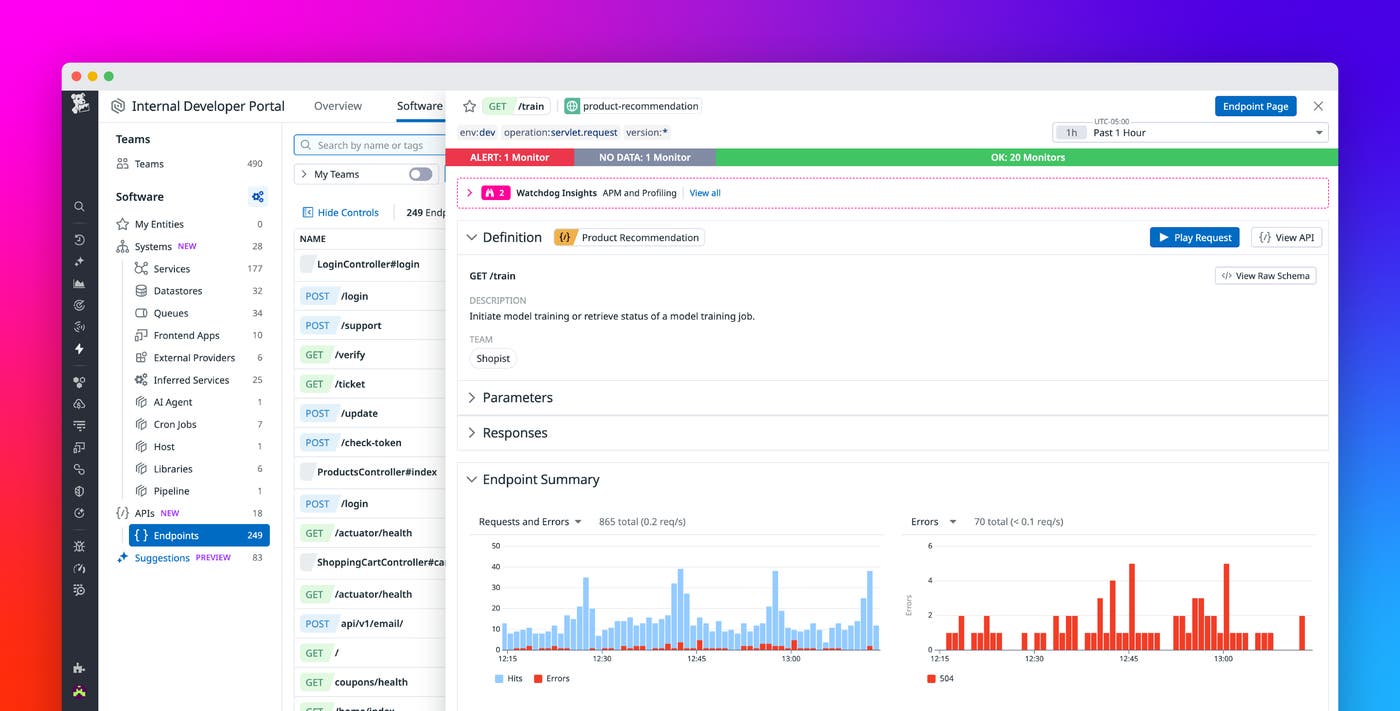
To help solve these challenges, we're excited to announce that Datadog's Software Catalog includes a unified, manageable inventory of all of your team's APIs and their endpoints. The catalog leverages Datadog's distributed tracing capabilities to automatically discover which endpoints are running in production, providing complete transparency into your API landscape. This visibility allows you to monitor endpoint performance, efficiently document and manage your APIs, and more. In this post, we'll walk through how Software Catalog's unified view for all of your internal and public-facing APIs enables your teams to:
Get complete context with Datadog's API-centric visibility
Microservice architectures provide a decentralized approach to development, enabling your teams to independently manage their own services. While this approach offers teams greater flexibility in how they build applications, it creates the burdensome responsibility of managing API sprawl.
Datadog Software Catalog provides the critical, real-time context you need for managing API sprawl via its API Explorer. Now you have a centralized location where you can:
Visualize how each of your managed and unmanaged API endpoints are connected
Find unmanaged, legacy, or shadow APIs in production that lack proper documentation
Understand which API endpoints are seeing traffic across all services and environments
Quickly see which endpoints, managed or unmanaged, are performing poorly or throwing errors
To build this consolidated view, Software Catalog uses your OpenAPI specification files together with existing tracing telemetry and metadata to automatically discover and enrich APIs with performance data and relevant tags. Now you can easily search for and group endpoints based on a specific service, team, or business logic to get a meaningful, aggregated overview of your application structure. For example, you can view all API endpoints under a particular API grouping, running under a service, or owned by your team:
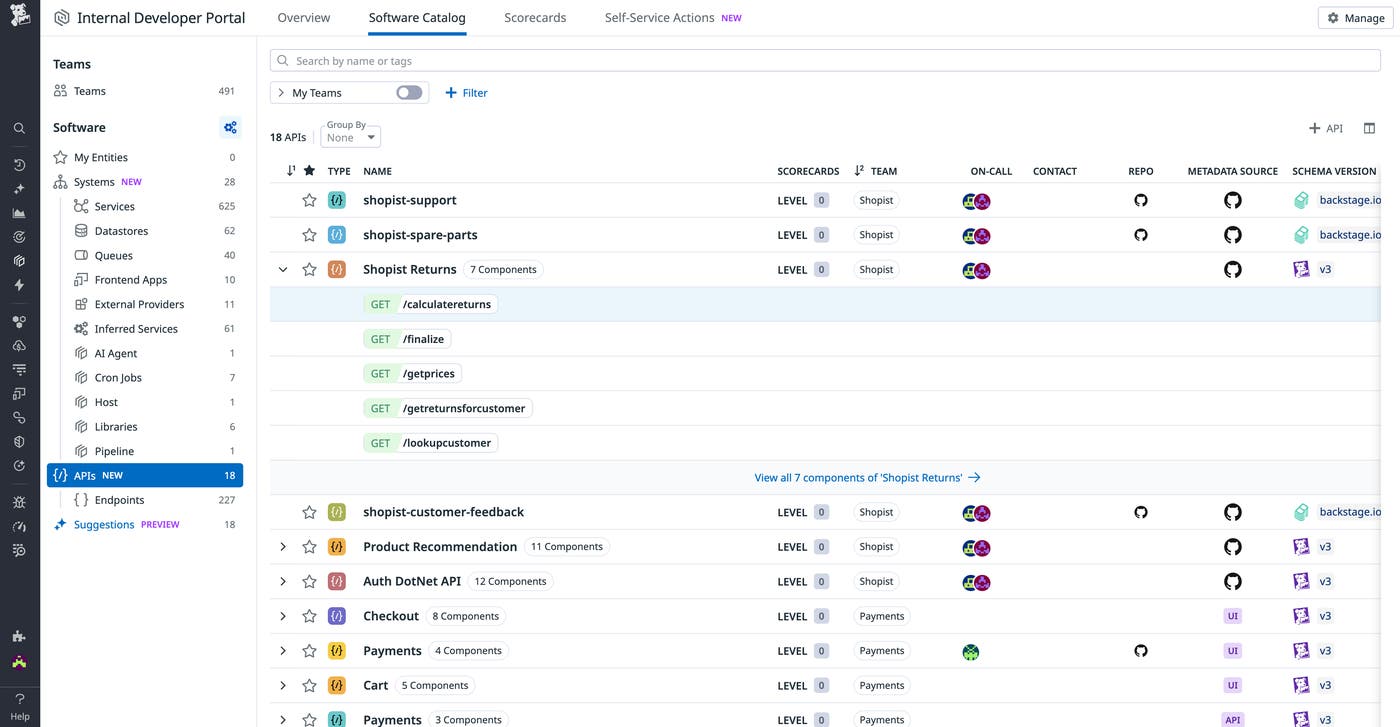
Endpoints without an owner or specified API can include those that are out of compliance with your governance policies or missing specification files. Not having a clear ownership model for your APIs significantly complicates triage efforts during incidents. With Software Catalog's API explorer, you can quickly identify these types of endpoints in your environment, ensure they are adequately documented, and align them with your internal policies.
Improve API performance and reliability
Your API architecture is designed to support and interact with multiple application services and resources. When an endpoint's performance degrades, you need to efficiently analyze all affected sources in order to resolve the issue before it affects end users. API performance issues, such as high latency or errors, can quickly lead to bottlenecks—or even outages—in applications.
Datadog Software Catalog mitigates these types of scenarios by providing visibility into when business-critical API endpoints deviate from historical performance trends. This enables you to:
Detect and efficiently investigate APIs that are underperforming
Keep track of an API's reliability via its triggered alerts, test results, and security signals
Create alerts based on predefined key performance metrics like latency and error rate
Standardize API testing and improve test coverage with Synthetic Monitoring
Having a single place to track API performance and reliability allows you to easily take action when an issue occurs. From Software Catalog's API explorer, you can select a poorly performing API endpoint—such as one experiencing high latency—to view more details:
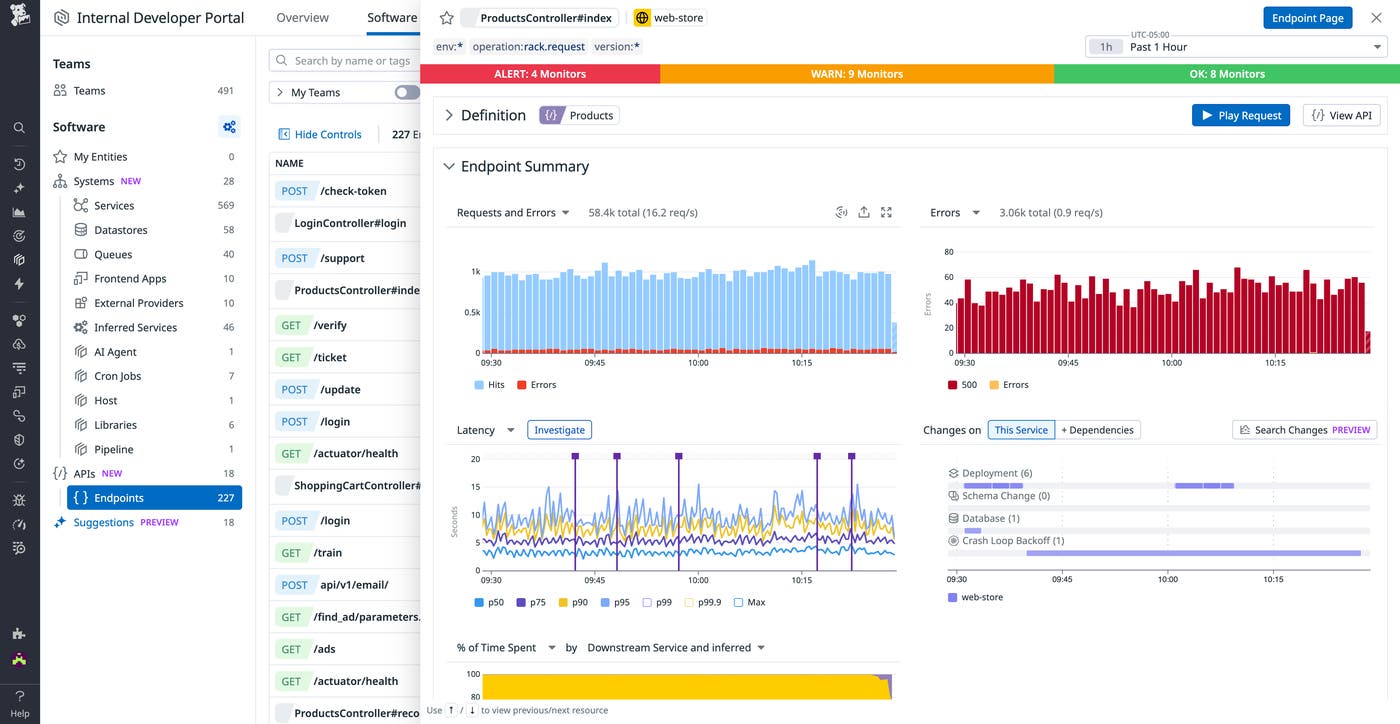
The catalog's detail view provides you with all the information you need to investigate a performance issue. You can review the API endpoint's owner and schema, key performance metrics over time, and a map of all of its service dependencies to determine how downstream services are affected. From this view, you can also pivot to other related data, such as code-level issues, monitors, dependencies, and APM spans, so you can easily find the root cause of your endpoint's degraded performance:
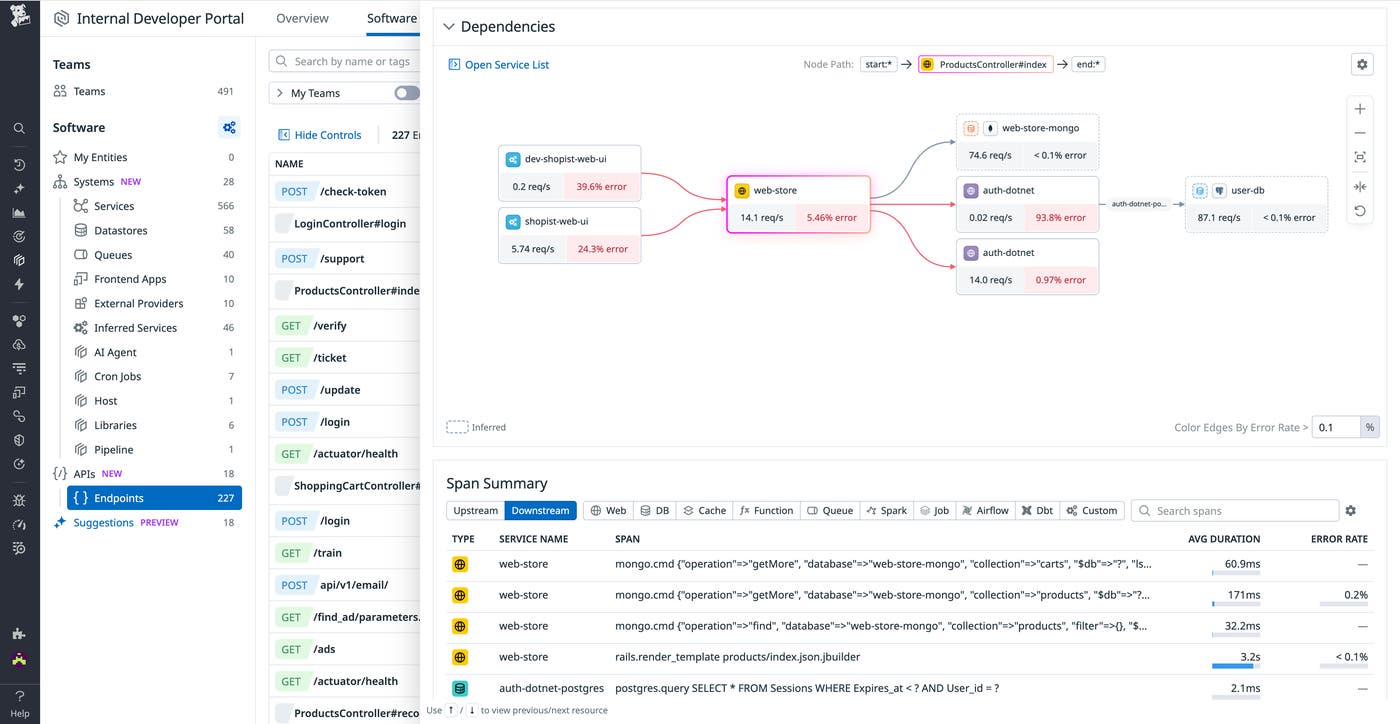
Datadog Software Catalog also integrates with Datadog Synthetic Monitoring to provide you with a comprehensive view of your API tests, as well as guidance on creating and improving test coverage.
Alert on API endpoints that deviate from expected performance
Software Catalog is integrated with Datadog monitors, enabling you to create custom alerts based on your SLO goals. This ensures that you can quickly surface performance issues in business-critical API endpoints before they negatively affect customers. As seen in the following example, you can create new alerts and track their status all within Software Catalog:
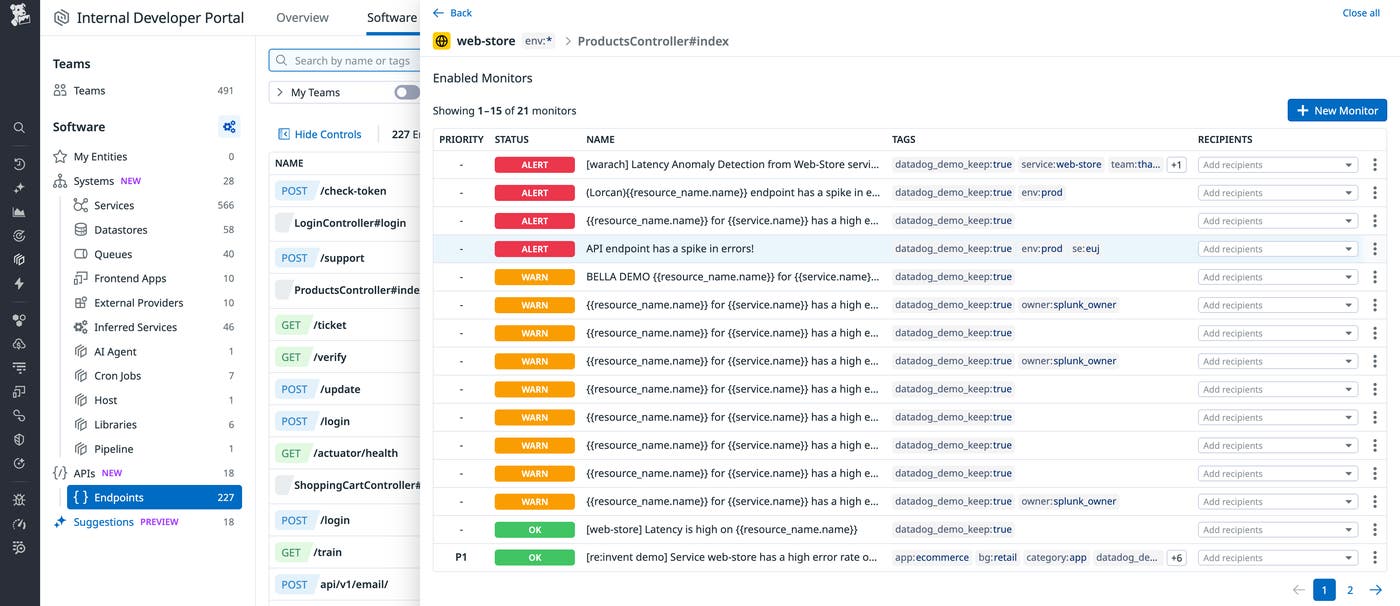
You can also customize your alerts—such as by adding links to relevant SLOs, dashboards, and API tests—to ensure that they include enough context for resolving an issue.
Establish ownership and governance for your APIs
A major pain point in API management is tracking which teams are responsible for certain endpoints. This is especially true in monolithic or gateway architectures, where all workloads and associated API endpoints are deployed as a single service. In these cases, the service owner is often not the primary point of contact for any of the supporting endpoints. Without this information, operational and development teams often struggle to collaborate on sharing details about existing APIs, including which services they support, their performance expectations, and potential security threats. It also hinders a team's ability to actively triage any API-related incidents, especially if API data is not connected to other telemetry data within an environment.
Datadog Software Catalog solves these challenges by enabling you to:
Integrate and manage API knowledge and ownership in one centralized place
Break down monolith services into individual APIs
Connect your API knowledge with usage and telemetry data captured by Datadog and observe live insights on how your APIs are deployed and being used
Detect orphaned or zombie APIs
Datadog API Catalog uses your OpenAPI specification files to connect telemetry data to existing API documentation and tools. If you don't have OpenAPI specs, the API Explorer enables you to explore endpoints that are auto-discovered from application traffic and register them into APIs you own to get started. For example, you can assign an unmanaged endpoint to the appropriate API:
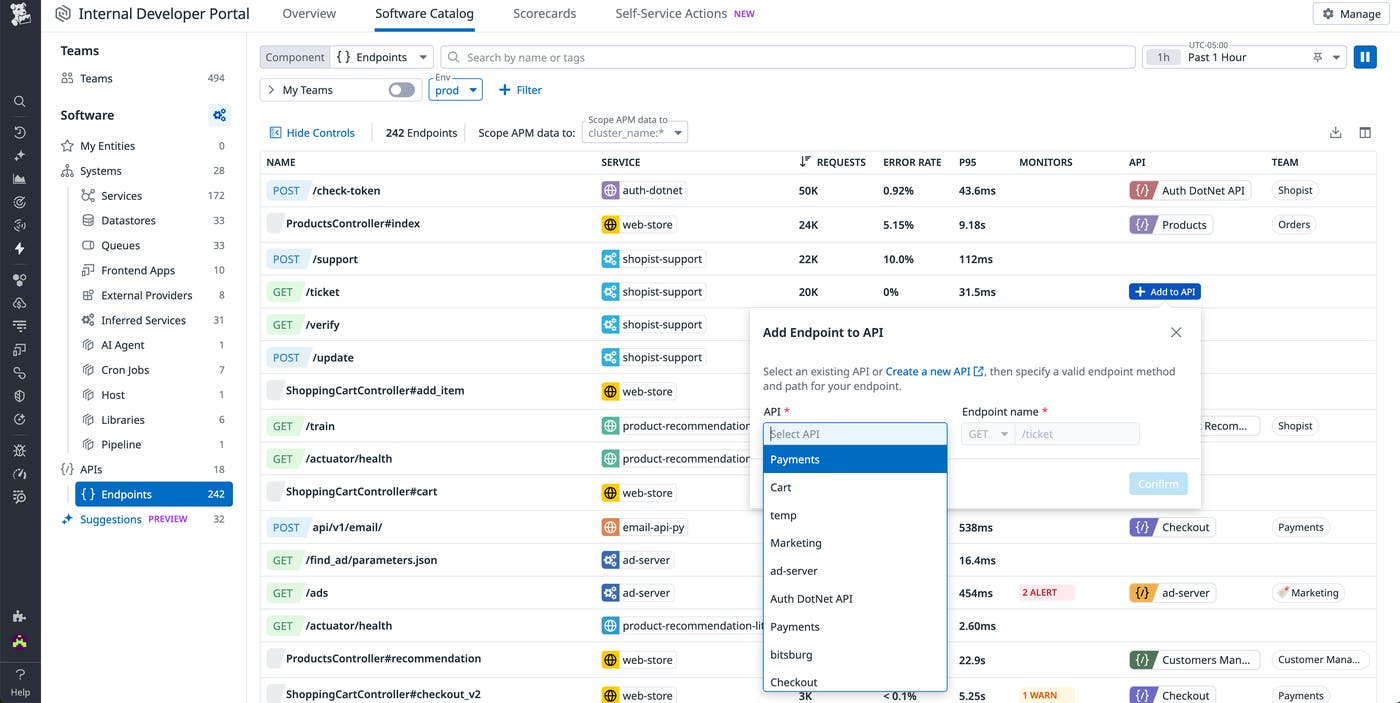
You can then access this information via the API page, which serves as a central repository for a particular API. Here you have a dynamic view of all of an API's endpoints, tests, and monitors:
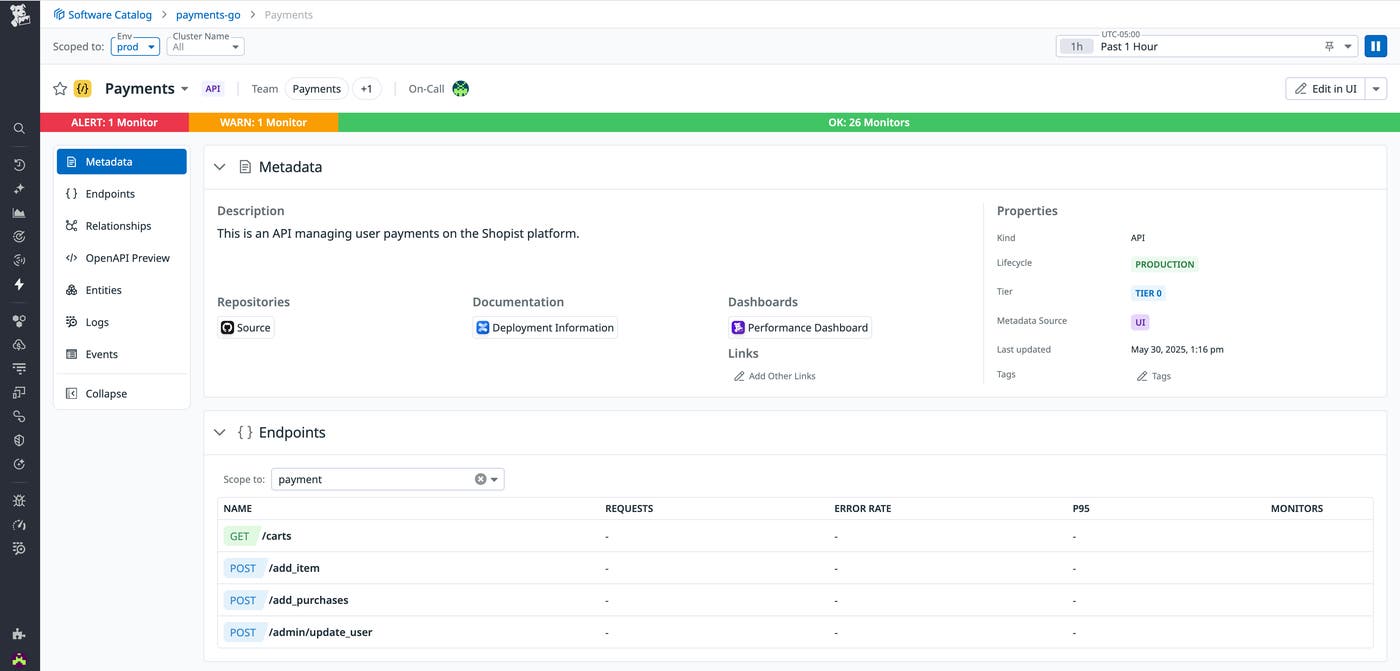
With this information, your teams have the real-time context they need to not only efficiently manage existing endpoints but also standardize the process for creating new ones. For example, your teams can automatically add new endpoints to the appropriate API and share relevant documentation about ownership, test coverage, and code. These governance controls significantly reduce the drift that often occurs in microservice architectures and ensures that all new endpoints are properly documented as soon as they spin up.
Efficiently manage your APIs and track their performance
Datadog Software Catalog provides organizations with a centralized view of all of their APIs. With this visibility, teams can manage standardized, approved, and production-ready APIs within Datadog, monitor their performance and reliability, and quickly identify who owns certain endpoints for faster triage during incidents. These capabilities significantly shorten the communication overhead between the API owner and other stakeholders.
To get started with Software Catalog, check out our documentation. If you don't already have a Datadog account, you can sign up for a 14-day free trial to get started.
