Thomas Sobolik
As your applications grow, your teams may be faced with managing a complex, expanding mesh of potentially thousands of loosely connected APIs—each one a new point of failure that can be difficult to track and patch. API sprawl comes naturally in rapidly expanding, distributed applications, and the difficulty of maintaining centralized knowledge and toolsets for your APIs creates friction when teams need to leverage APIs they don’t own.
This is why effective API testing is essential in order to prevent issues with broken endpoints, which can quickly cascade and negatively affect your UX. By integrating API testing into CI/CD as well as production, your teams can quickly identify slow or broken endpoints, understand why they’re failing, and solve issues before a regression can occur. But with so many endpoints to monitor across disparate teams, it can be difficult to ensure that your organization’s API testing covers your endpoints well enough to keep emergent problems from slipping through the cracks.
That’s why we’re pleased to announce that Datadog Synthetic Monitoring now integrates data from the API Catalog to help you monitor your API test coverage and identify any issues with your endpoints. In this post, we’ll discuss how this feature can help you:
Spot and fill gaps in your testing
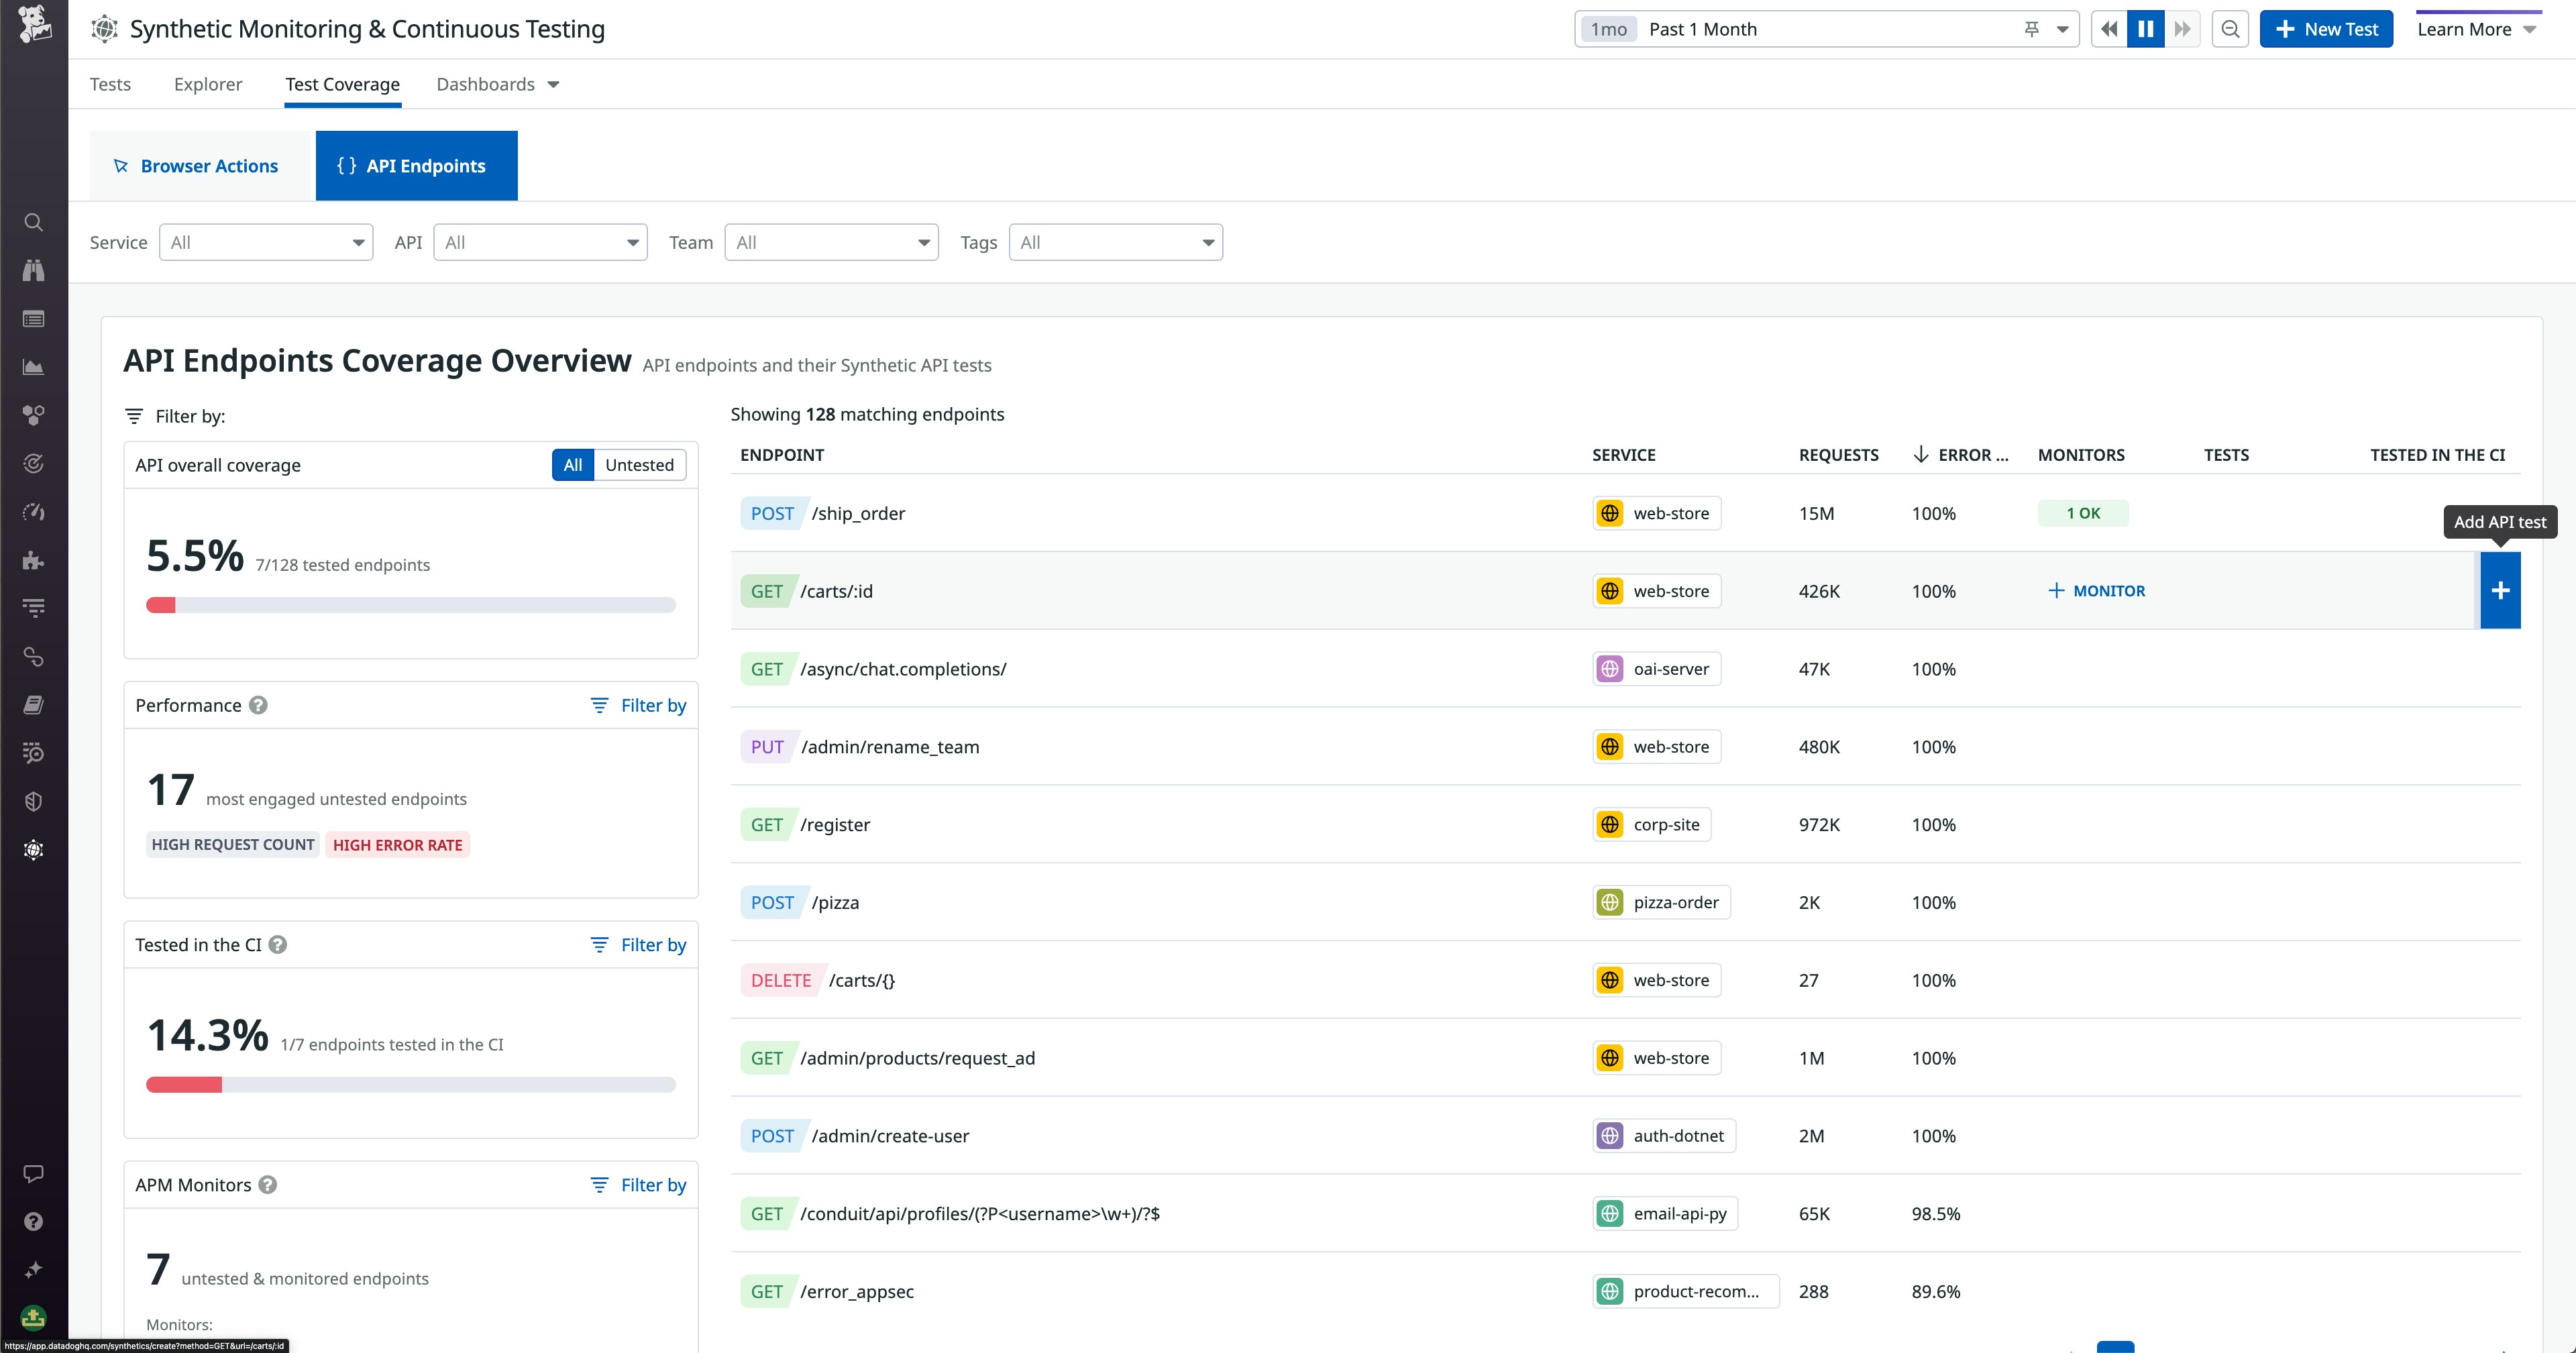
Datadog Synthetic Monitoring’s Test Coverage overview makes it easy to audit your API test coverage and find gaps in your testing. From the overview, you can see details about your endpoints’ testing and performance, as well as the overall percentage of endpoints that are currently tested. The four included tag filters enable you to scope the list of endpoints by service, API, team, or a set of custom fields that you can define. This way, you can easily filter to the endpoints you control and care about.

Once you’ve scoped your view to the right subset of endpoints, you can sort the endpoint list by metrics such as request count, error rate, and the number of configured tests or monitors. In the preceding screenshot, we’re sorting by error rate to see which endpoints are least able to fulfill requests, and therefore need testing the most. Hovering over an untested, errorful endpoint in the list, we can use the “Add API test” button on the far right to immediately spin up a new test to cover the endpoint. You can also sort the list to see which endpoints are being tested within your CI pipelines. This is particularly useful if you’re trying to develop your team’s shift-left practices and you want to know which endpoints aren’t yet being tested in pre-production.
In addition to the tag filters and sortable list columns, the overview page also includes four out-of-the-box filters that show key test coverage metrics at a glance and make it even easier to home in on the endpoints you care about:
- The “API overall coverage” filter, which lets you quickly see all the untested endpoints within your tag scope, so you can immediately see all the gaps in your coverage
- The “Performance” filter, which shows the most engaged, untested endpoints with significant error rates, so you can triage which ones to investigate first
- The “Tested in the CI” filter, which shows you the endpoints that are currently being tested in your CI pipelines, so you can quickly evaluate a team’s shift-left practices
- The “APM Monitors” filter, which shows endpoints that are untested but have active monitors on them, so you can prioritize creating tests for endpoints that your teams have already invested effort into monitoring
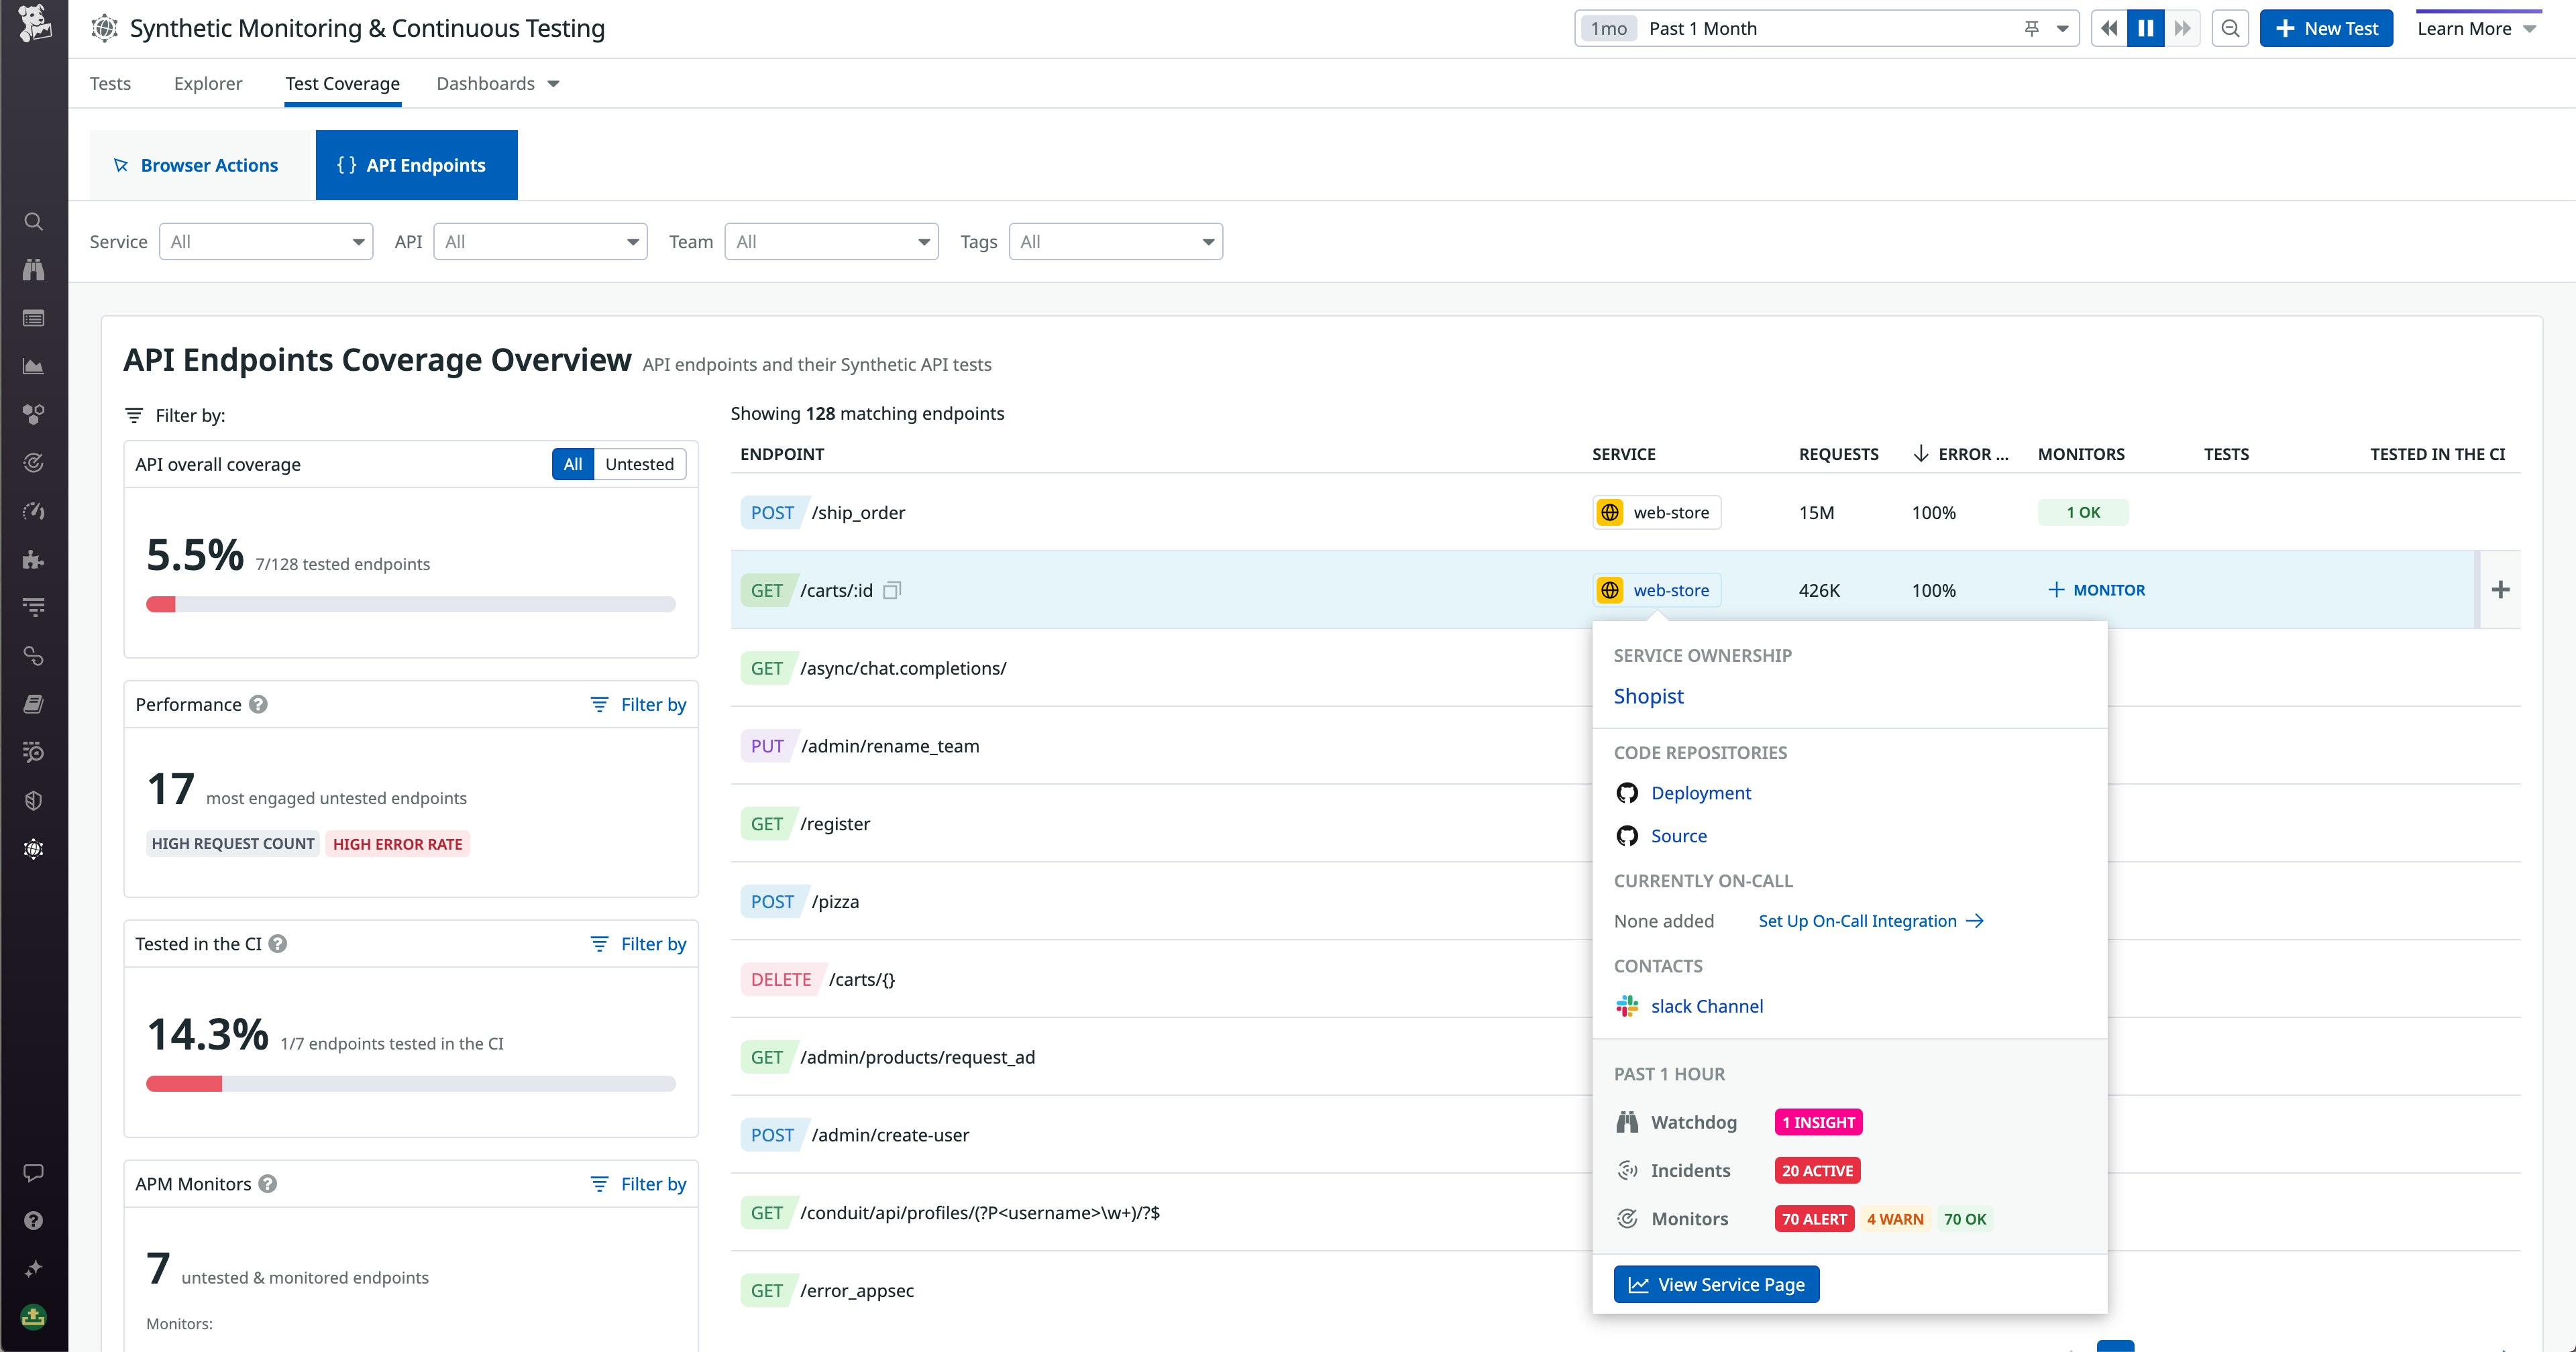
Together, all these options for filtering and sorting your endpoints make it significantly easier for your teams to spot, triage, and fill gaps in their testing. To provide even more context about the status of your endpoints, the API Test Coverage overview also integrates service data from the API Catalog. For example, let’s say you’ve found an untested endpoint that’s experiencing a high error rate. You can hover over it in the list to view information from its corresponding service page that can help you contact the right stakeholders, including who’s currently on-call and which Slack channel can be used to reach out to the relevant team. You can also see any ongoing incidents, triggered monitors, and Watchdog outliers that may be affecting the service.

Investigate issues related to failed tests
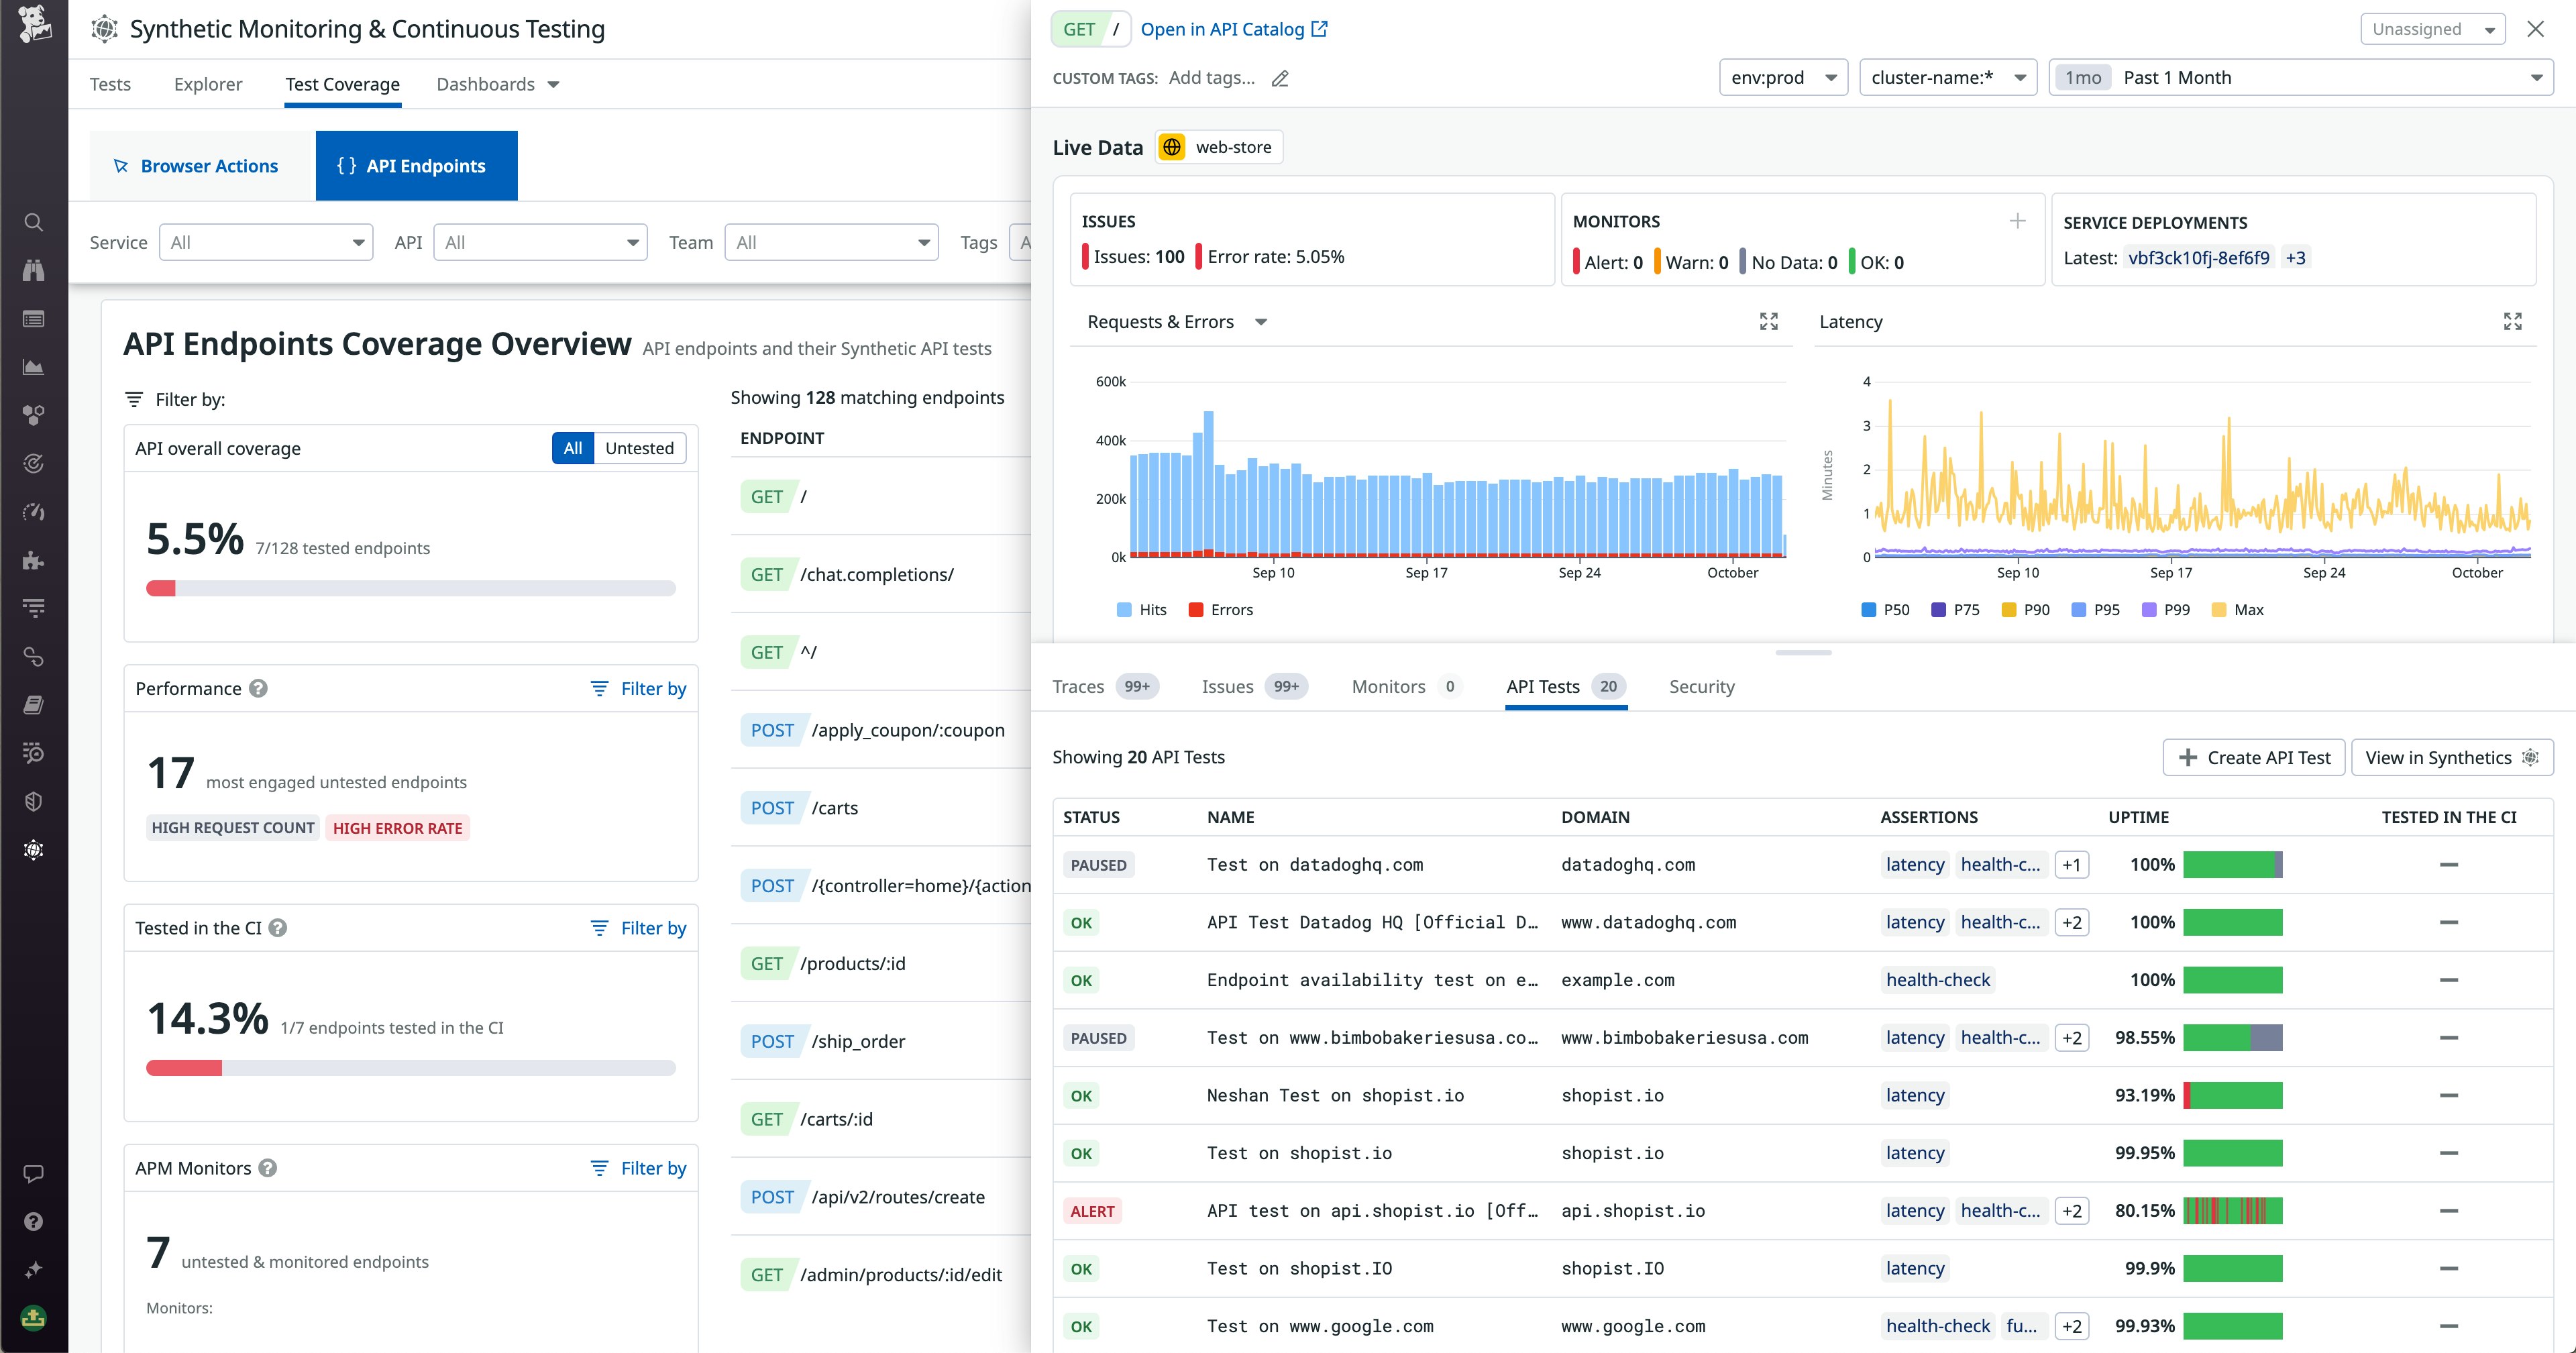
Besides helping you spot and fill gaps in your testing, the API Test Coverage page also helps you kick off root cause analysis and remediation to identify and fix the underlying problems that are causing your tests to fail and your endpoints to experience poor performance. The endpoint side panel shows you all the tests that have been created for the endpoint you’re viewing, so you can see which ones are passing or failing. This can help you investigate whether the endpoint is being covered properly, or if its tests are all passing despite ongoing issues.

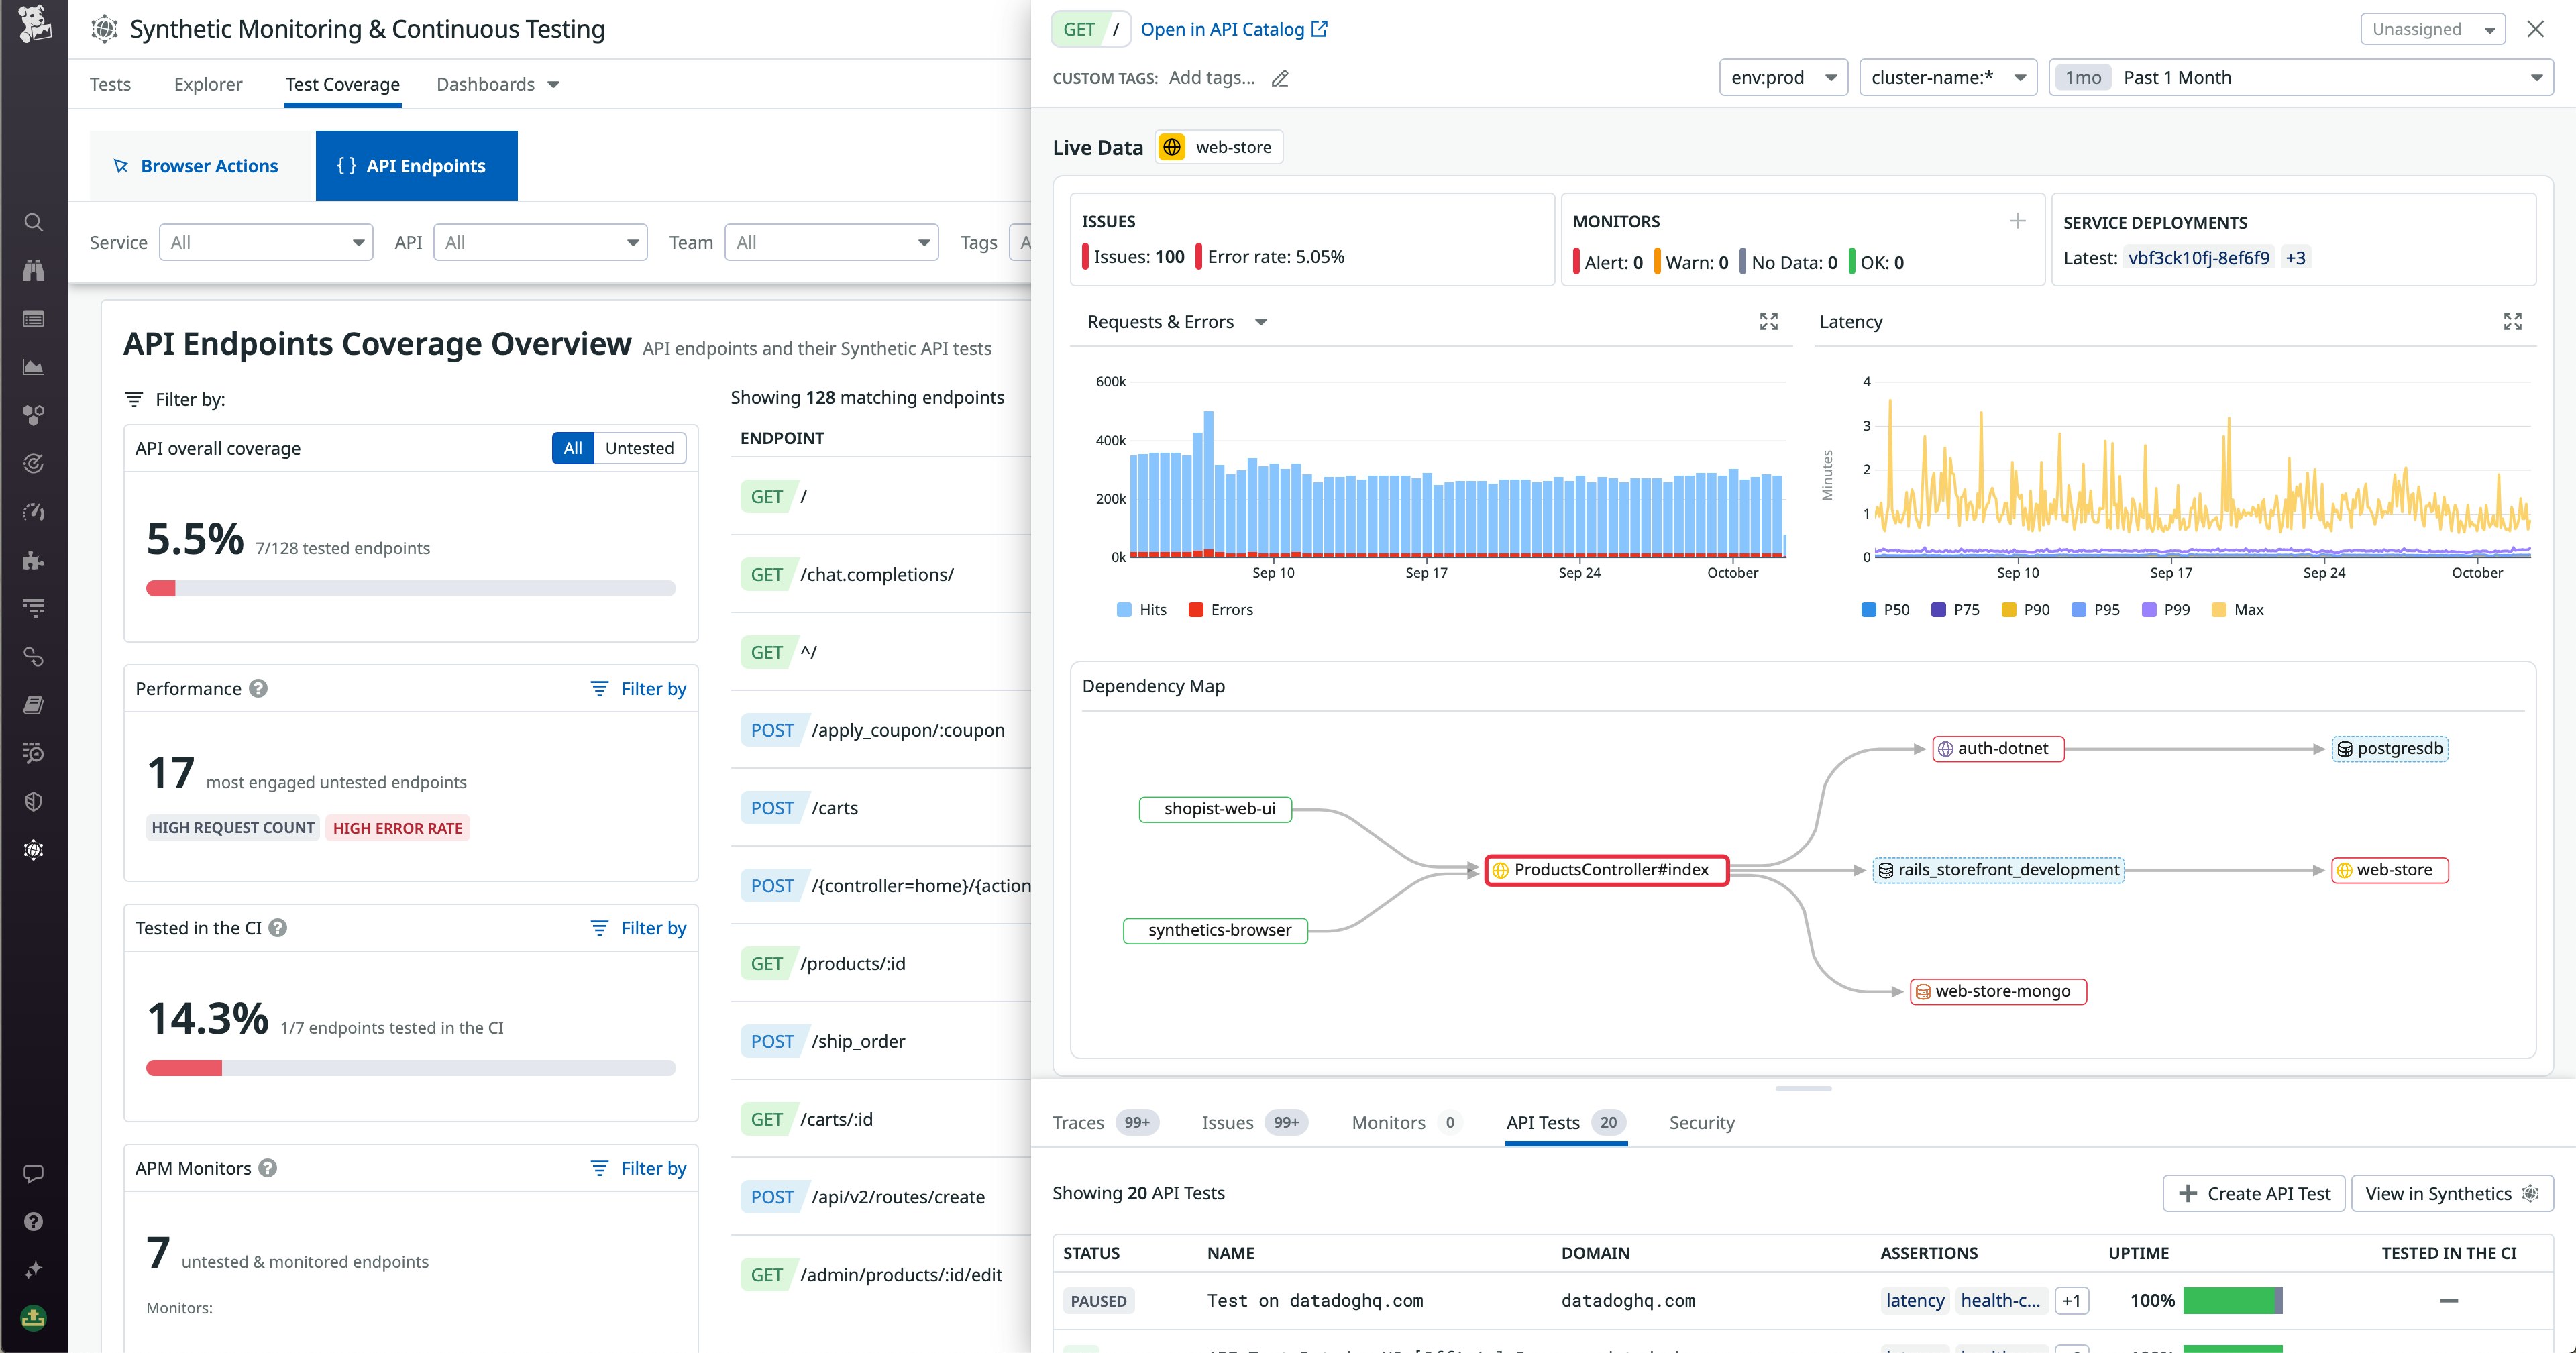
The side panel also contains a wealth of correlated monitoring data from the API Catalog that can give you a sense of an endpoint’s health and performance, and also help you find the root cause of issues. The dependency map can show you upstream issues that may be contributing to your endpoint’s poor performance—as well as downstream dependencies that are further affected. In the following screenshot, we can see in the map that two of our endpoint’s downstream services are experiencing triggered alerts or errors, indicated by the red highlighting.

In addition to the map, the side panel brings in further context from across the Datadog platform that can help you identify problems that may be leading to your endpoint’s degraded performance. This includes related APM traces, issues from Error Tracking, triggered Security Signals, and more. You can also use the error and latency graphs to understand the lifespan of these issues and potentially correlate them with the details you’ve gleaned from elsewhere in the panel. By showing you all this data related to your targeted endpoint in one place, the side panel provides an effective jumping-off point not only for identifying and fixing testing gaps, but also for investigating and diagnosing issues—whether or not they’ve been signaled by a failed test.
Take control of your API testing
As a service owner, team lead, or DevOps engineer, it’s paramount to own your testing and ensure that your application’s APIs are healthy and performant. By leveraging the new API Test Coverage view in Datadog Synthetic Monitoring, you can more easily spot and fill gaps in your testing and investigate issues with your endpoints. Ultimately, this feature empowers you to maximize the availability and performance of your services and deliver the best possible experience to your users. For more information about this feature, see our documentation. Or if you’re brand new to Datadog, sign up for a free trial to get started.


