Micah Kim
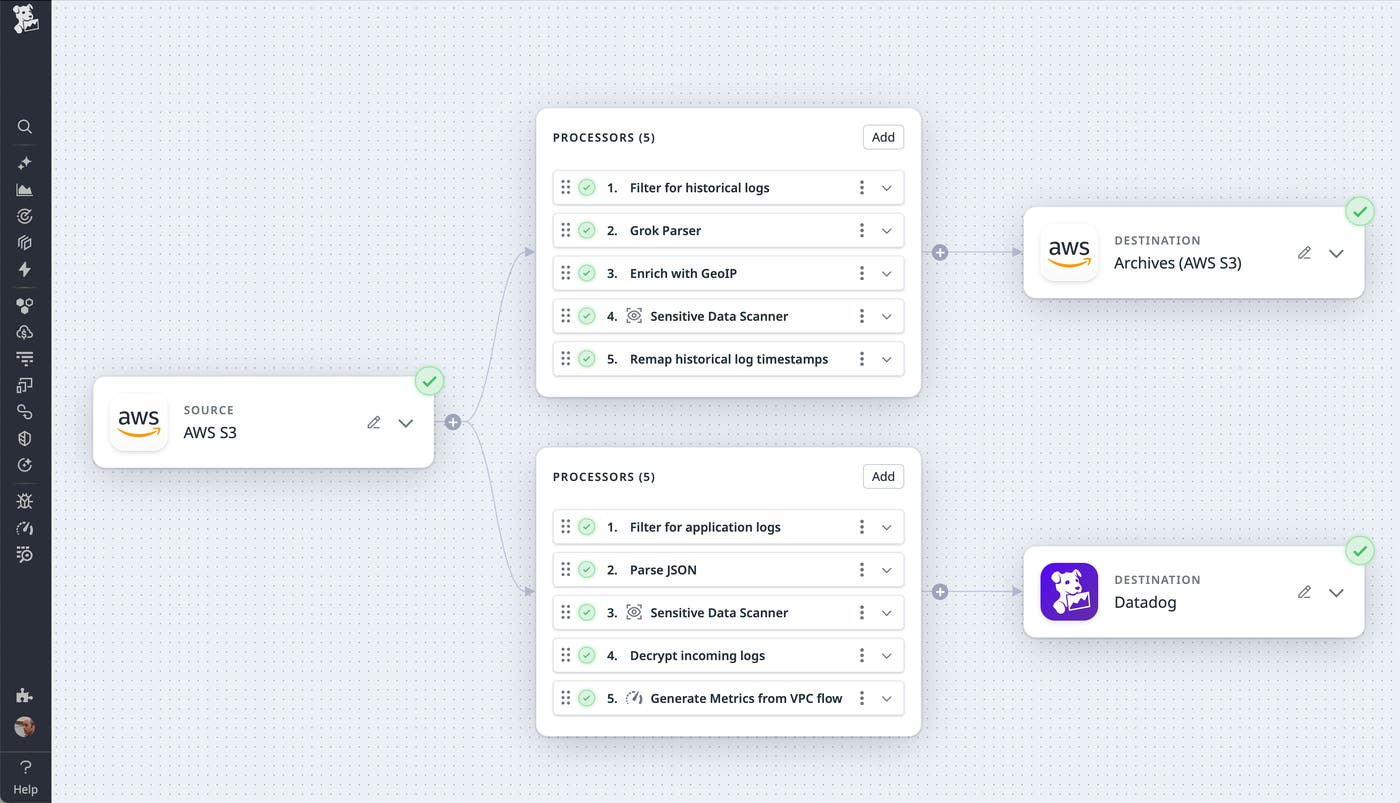
Migrating to a new logging platform can be a complex operation, especially when it involves both active and historical logs. Observability Pipelines offers dual-shipping capability, making it easy to route active logs to your new platform without disrupting your log management workflows. But migrating years worth of historical logs—which are critical for investigating security incidents and demonstrating compliance with applicable laws—requires a different approach.
Many logging and SIEM tools have a real-time data limit and won't accept logs with older timestamps. Instead, you can migrate your historical logs by routing them through Observability Pipelines. You can customize your pipeline to receive logs from your archive, apply any necessary transformations (for example, to correct inaccurate timestamps), and send them to your preferred cloud storage service. Later, you can use Log Rehydration to ingest these logs back into Datadog and query them in the Log Explorer.
In this post, we'll show you how to:
Extract historical logs from your archives
The first step in migrating your historical logs is to build a pipeline that specifies your archive as the source. In this section, we'll describe how you can extract your historical logs from your archive and configure Observability Pipelines to receive them from any of these sources:
- Elasticsearch - Splunk (in managed storage) - Splunk (self-stored in Amazon S3) - Google Cloud Storage (GCS), Azure Blob Storage, or S3 (via HTTP or syslog replay)
Migrate historical logs from Elasticsearch to Datadog
To migrate Elasticsearch logs, you can use the Elasticsearch API to restore your logs from your snapshot repository to a temporary cluster or index. Then, configure Logstash to read your restored logs and forward them to Observability Pipelines. Use the Observability Pipelines Logstash source to receive logs from the Logstash agent. Then, process them to resolve any incorrect timestamps and store them for future rehydration.
Migrate Splunk-managed historical logs
If your logs are stored in Splunk's Dynamic Data Active Archives (DDAA), migrating them requires additional transformation. DDAA stores logs in a proprietary format that isn't directly compatible with Datadog ingestion. To migrate these logs, you can request access to the Preview feature that automatically converts Splunk archives to Datadog’s rehydratable format. After you convert your logs within S3, they're ready to be rehydrated any time you need to query them in Datadog.
Migrate historical logs stored in S3
You can send historical logs stored in S3 to your pipeline by configuring the S3 source and writing a custom script. For example, you can use this approach if you've moved your old Splunk logs to S3 as a Dynamic Data Self-Storage (DDSS) private archive and you need to migrate them to long-term storage.

In the case of real-time log activity, the S3 source receives logs via SQS messages triggered by S3 events. But in the case of historical logs, you'll need to simulate an S3 event for each log. Create a custom script that lists the logs in your bucket and executes the SQS send-message command for each one.
After Observability Pipelines is configured to receive your historical logs using the S3 source, process the incoming logs to resolve any incorrect timestamps and store them for future rehydration.
Replay historical logs stored in GCS, Azure Blob Storage, or S3
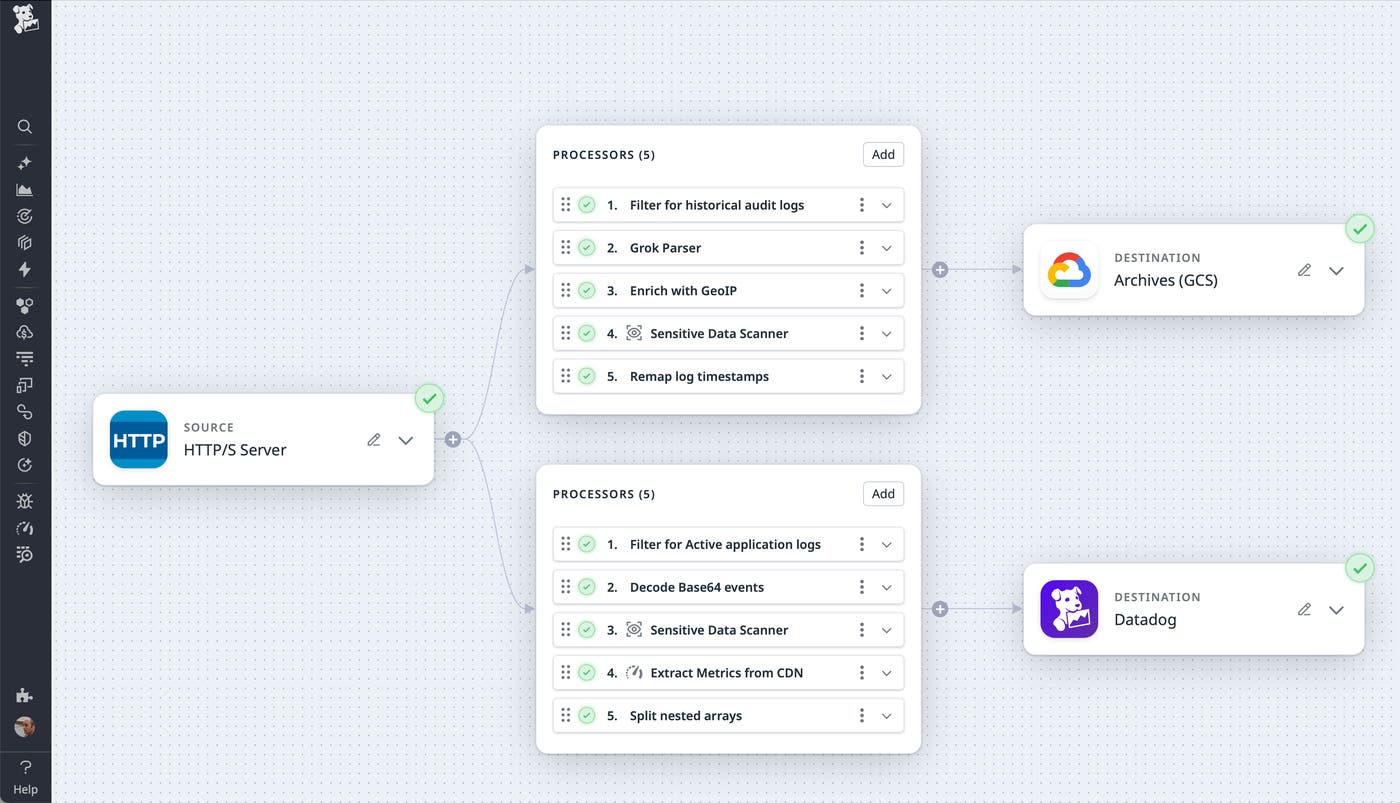
If your historical logs are archived in GCS, Azure Blob Storage, or S3, you can replay them to Observability Pipelines using either the HTTP Server source or Syslog source. Whichever option you choose, you'll need to start by writing a script to list and download the files in your archive, for example using GCP's gcloud tool, Azure's az storage blob commands, or the AWS CLI.

Next, configure Observability Pipelines to use your preferred source. If you're migrating structured logs, we recommend using the HTTP Server source. Your script should send each log as an HTTP POST request. If your logs are unstructured, we recommend using the Syslog source. Your script should first translate each log into the appropriate format and then send it to syslog.
After you've configured your preferred source, you can process your logs to resolve any incorrect timestamps and store them for future rehydration.
Fix log timestamps with the Custom Processor
After you've configured your pipeline's source (which is your historical log archive), you can configure Observability Pipelines to transform the data before it's routed for storage. In this section, we'll talk about the Custom Processor, which you may need to include in your pipeline to ensure that each log has an accurate timestamp. The Custom Processor enables you to automatically transform values within your logs based on rules and actions you define in custom functions. For example, you can decode Base64-encoded events, conditionally modify strings and array elements, and algorithmically encrypt logs.
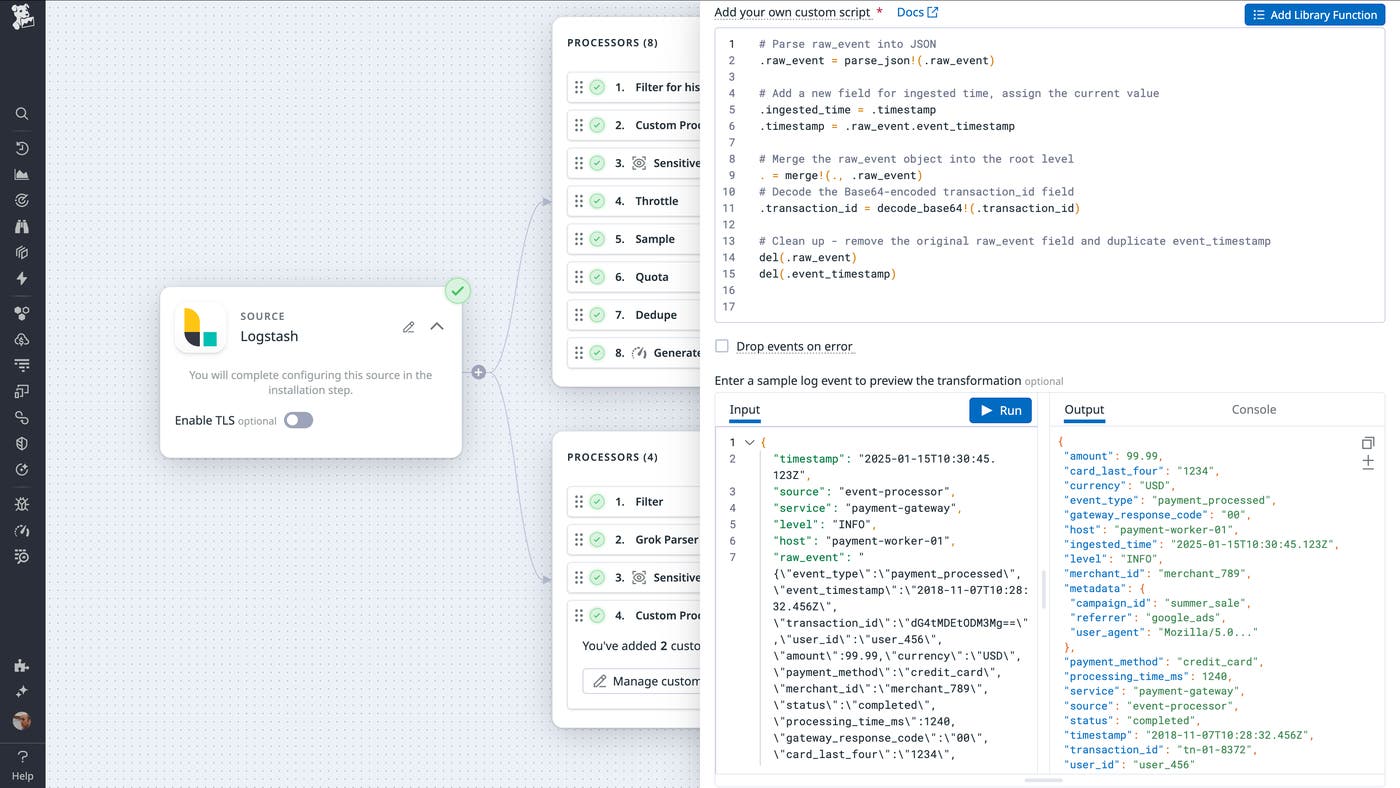
In the case of migrating historical logs, the role of the Custom Processor is to optionally modify timestamps that may be inaccurate. If your log doesn't contain a timestamp field, Observability Pipelines automatically creates one and populates it with the log's ingestion time. If the log's original timestamp exists in a field with a different name, you can use the Custom Processor to automatically copy the original value into the new timestamp field and optionally store the ingestion timestamp in a custom field you create.
The following screenshot shows the Custom Processor transforming a log. A custom script—written in the Vector Remap Language (VRL)—uses the parse_json function to convert the value of the original log's raw_event field to a JSON object. It writes the log's ingestion time into the ingested_time field, and then saves the value of its event_timestamp into the timestamp field. The output of the script shows the transformed log, ready for long-term storage.

Send them to a rehydratable destination
So far, you've configured your pipeline's source, extracted your logs, and optionally transformed your timestamps using the Custom Processor. Finally, you'll need to configure your pipeline to route your historical logs to your preferred long-term storage destination to await rehydration. See the Observability Pipelines documentation for details on how to configure the S3, Azure Storage, and GCS destinations.
After your logs have been routed to storage, you'll be able to use Log Rehydration to bring them back into Datadog and query them to analyze past events, investigate security incidents, and identify root causes. When you need to rehydrate, create a query that uses natural language, full text, or key:value pairs. To avoid rehydrating more data than necessary, filter based on your logs' timestamps to retrieve only relevant logs.
Migrate historical logs with control and flexibility
Observability Pipelines helps you migrate historical logs regardless of whether you're exporting from a proprietary archive, migrating from an S3 bucket, or replaying logs via HTTP or syslog. Alongside its routing capabilities, Observability Pipelines includes more than 150 built-in Grok parsing rules, support for Base64 encoding and decoding, sensitive data redaction, JSON parsing, and other processing tools to help you shape your logs before they reach their destination.
See the documentation for more information about Observability Pipelines and Log Rehydration. The Custom Processor is now available in Preview. You can contact your account team for access and see the documentation to get started.
If you're not yet using Datadog, you can start with a 14-day free trial.

