Florent Le Gall

Alex Guo

Will Potts
This article is part of our series on how Datadog engineering teams use LLM Observability to build, monitor, and improve AI-powered systems.
At Datadog, we’re always looking for ways to make complex data easier to explore. Building on work by the Graphing AI team discussed in the first blog, our Cloud Cost Management (CCM) team set out to let FinOps and engineering users evaluate our natural language query (NLQ) agent with plain-English questions such as “Show AWS database costs by service for September” and automatically generate a valid Datadog metrics query used in CCM.
This agent is not conversational; its output is a metrics query string. That constraint made correctness critical and testing much harder than it initially appeared. In this post, we’ll discuss how we curated our dataset, the challenges we faced when creating our evaluators, and how we used LLM Observability to improve responses and speed up debugging.
Building the ground truth dataset from user testing
We started by running lightweight user testing with internal FinOps users at Datadog. We asked them to use the NLQ experience the way they naturally would, by asking real questions they were trying to answer in CCM. During these sessions, we captured LLM traces for every run, with each trace including the user prompt, system prompt, tool calls, tool arguments, tool responses, and final generated query.
Those traces served two purposes. They let us understand how the agent behaved end to end, and they gave us the raw material to answer a more important question: What should we actually be testing?
After the sessions, we extracted the prompts we observed in those traces and converted them into a reference dataset. This ensured that the dataset reflected real user phrasing rather than synthetic prompts we invented ourselves. We expanded it with additional technical prompts to cover edge cases and less common query patterns.
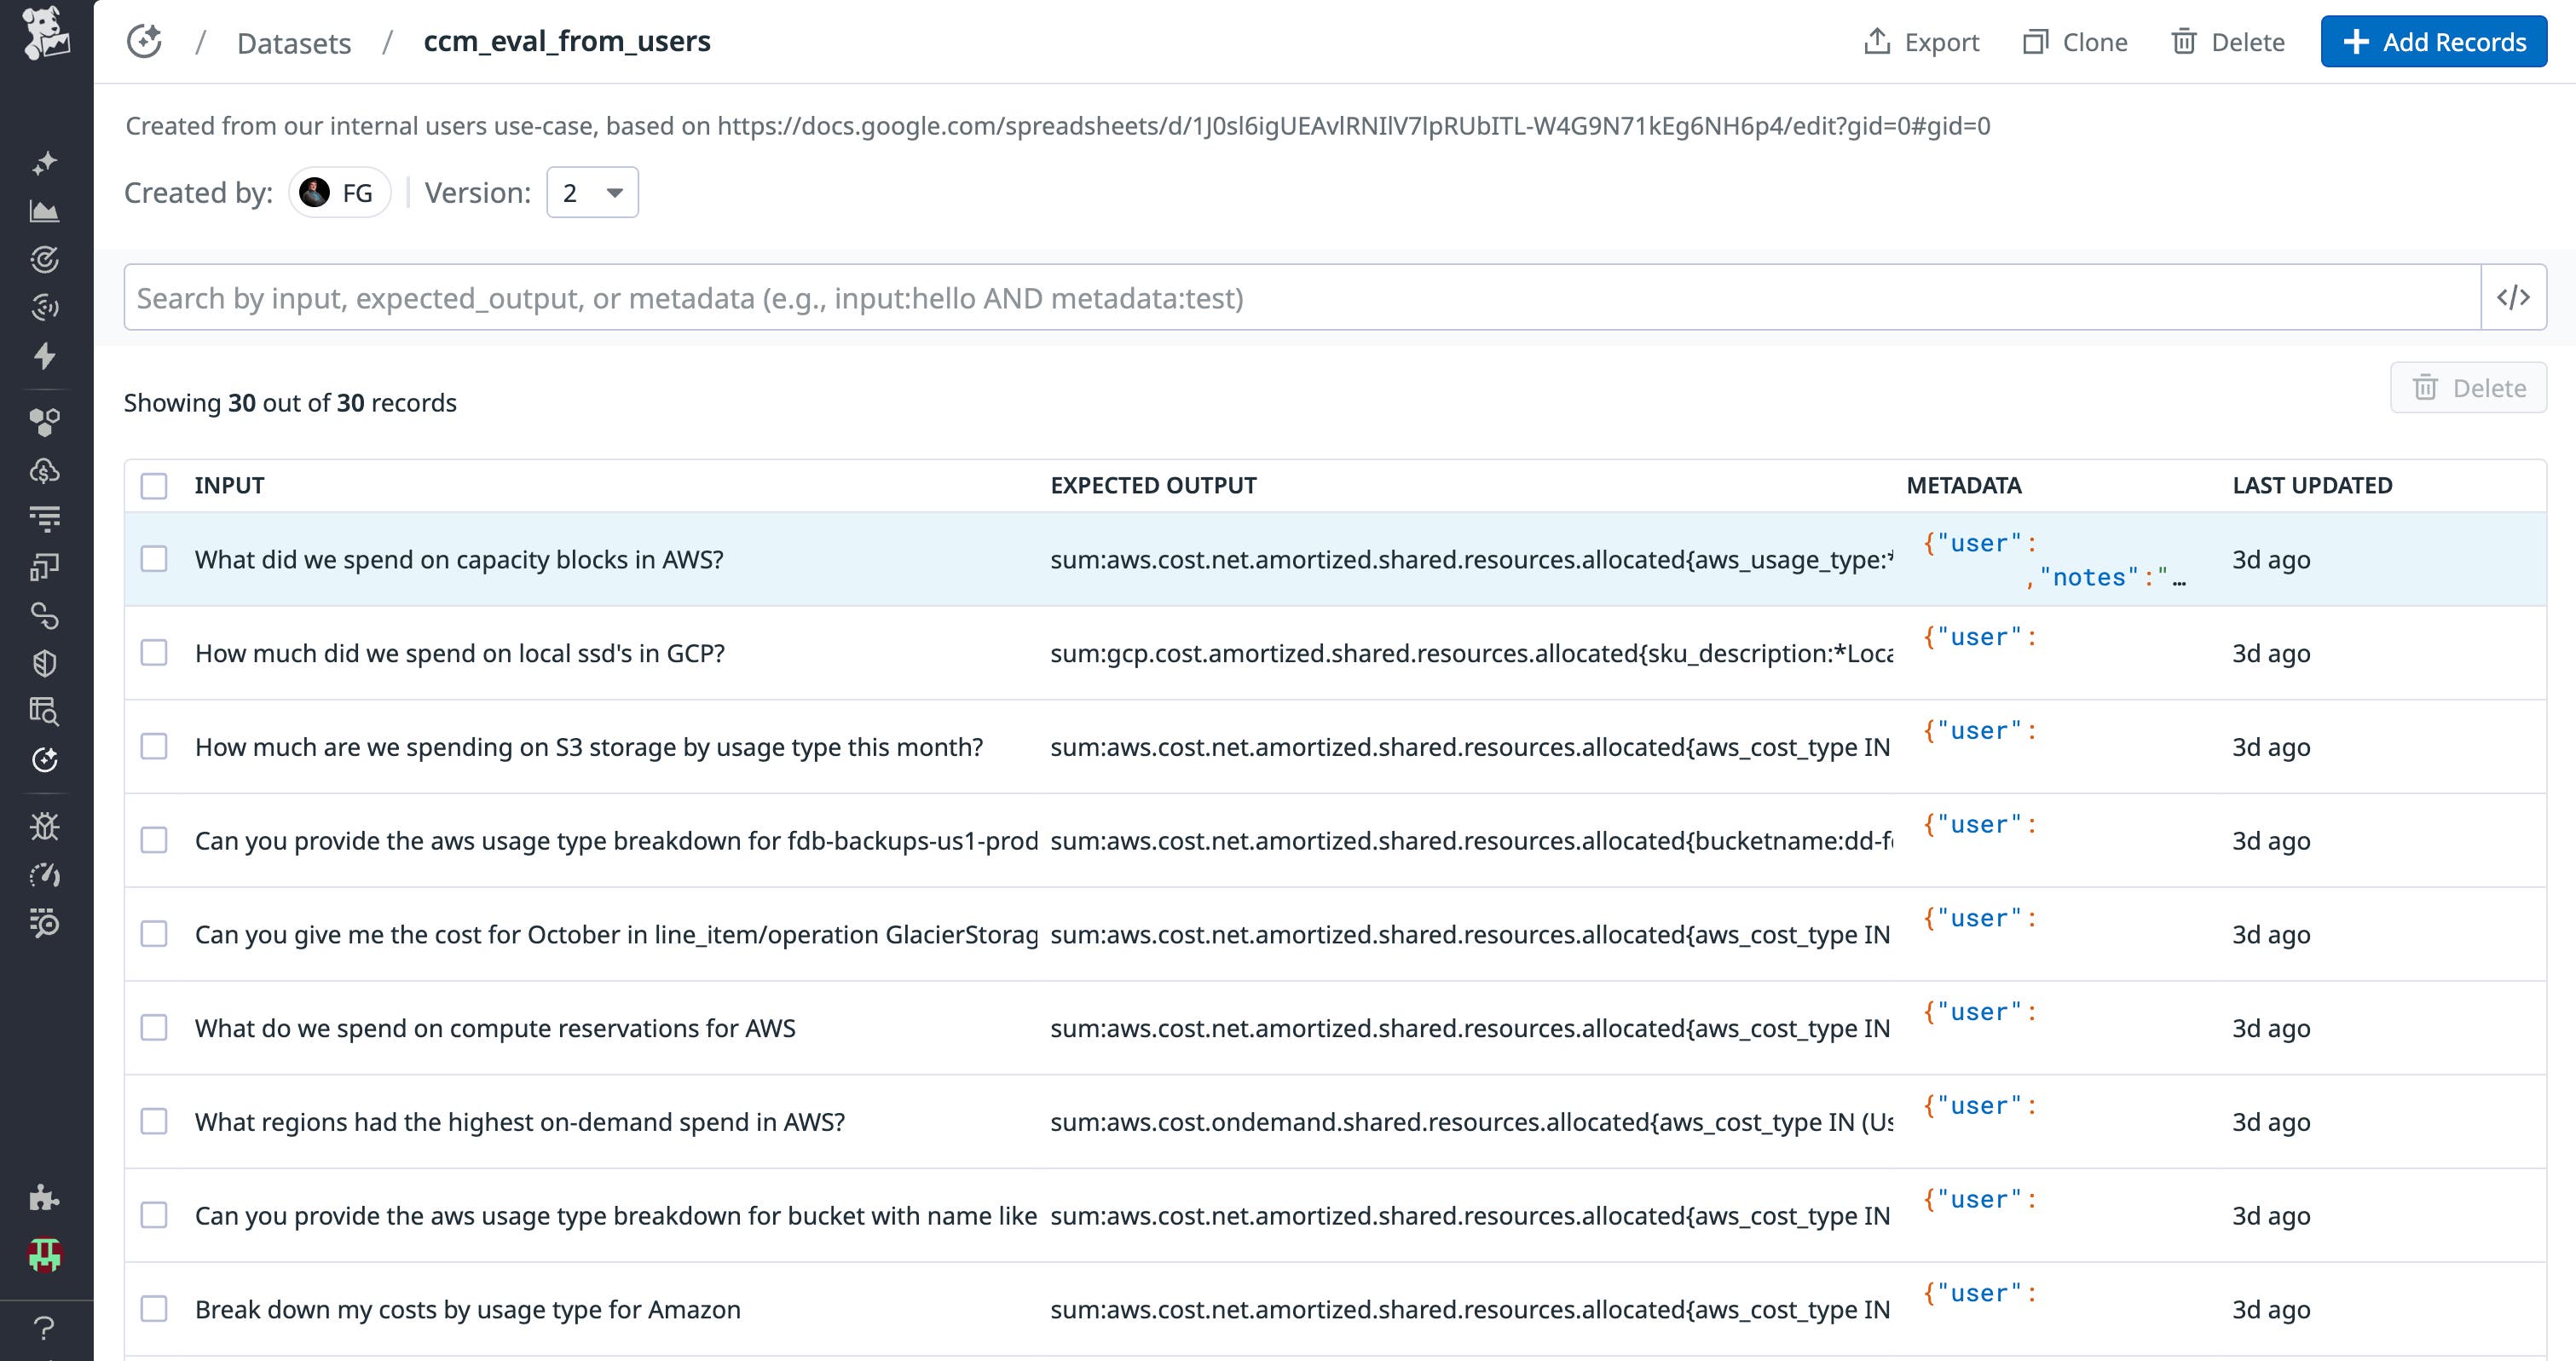
Each dataset entry paired a prompt with an expected Datadog query. This dataset became the foundation for all subsequent evaluations and regression tests.
Evaluating AI that doesn’t fail cleanly
Large language models are nondeterministic, and our failures are rarely binary. That meant that our agent would often produce queries that were slightly off, such as:
- A correct query, but using the wrong roll-up interval
- The correct grouping, but a missing or partially applied filter
Early on, we tested the agent the way many teams do. We manually tried a few prompts, inspected the generated queries, and decided whether they looked right. That approach worked until we started iterating more aggressively.
We then tried to automate validation using string comparison and quickly hit a wall. Because the agent produces a query string rather than a structured object, exact comparison was misleading. In some cases, we saw success rates as low as 2%, even though we knew the agent was performing far better than that.
When something failed, we also had no way to understand why it failed at scale. Debugging meant manually comparing dozens of queries side by side to determine whether the failure came from metric selection, roll-up logic, grouping, or filters. Even when scripted, this required a human to read and interpret the results. At that point, testing and debugging had become the bottleneck.
Deconstructing correctness with evaluators
Instead of asking whether a query was “right,” we broke correctness into the components that actually fail in practice:
- Parsing: Is the generated query syntactically valid?
- Metric selection: Did it choose the correct billing or usage metric?
- Roll-up: Is the aggregation and time window correct?
- Group-bys: Are the dimensions grouped correctly and in order?
- Filters: Were tag keys and values correctly detected and applied?
Each check became an independent Python evaluator in LLM Observability Experiments. We deliberately used a hierarchy of evaluators per query. The strictest checks were on all evaluators, such as parsing or metric selection checks, while others further down the evaluation tree were more lenient, such as validating group-bys or roll-up intervals.
This structure matters because it lets us categorize failures instead of treating them as a single pass or fail signal. We can see when a change improves metric detection but hurts filters, or when roll-ups regress while grouping remains stable.
Debugging with agentic tracing
Every experiment run is automatically captured as an LLM trace using the same Datadog distributed tracing we rely on elsewhere in the platform. When an evaluator fails, we filter experiment results by that evaluator and open the associated traces.
Because the agent relies on tool calls, the final query string alone is not enough to understand failures. The traces let us inspect which tool was called, the exact arguments passed to that tool, what the tool returned, and how that output was used downstream to construct the query.
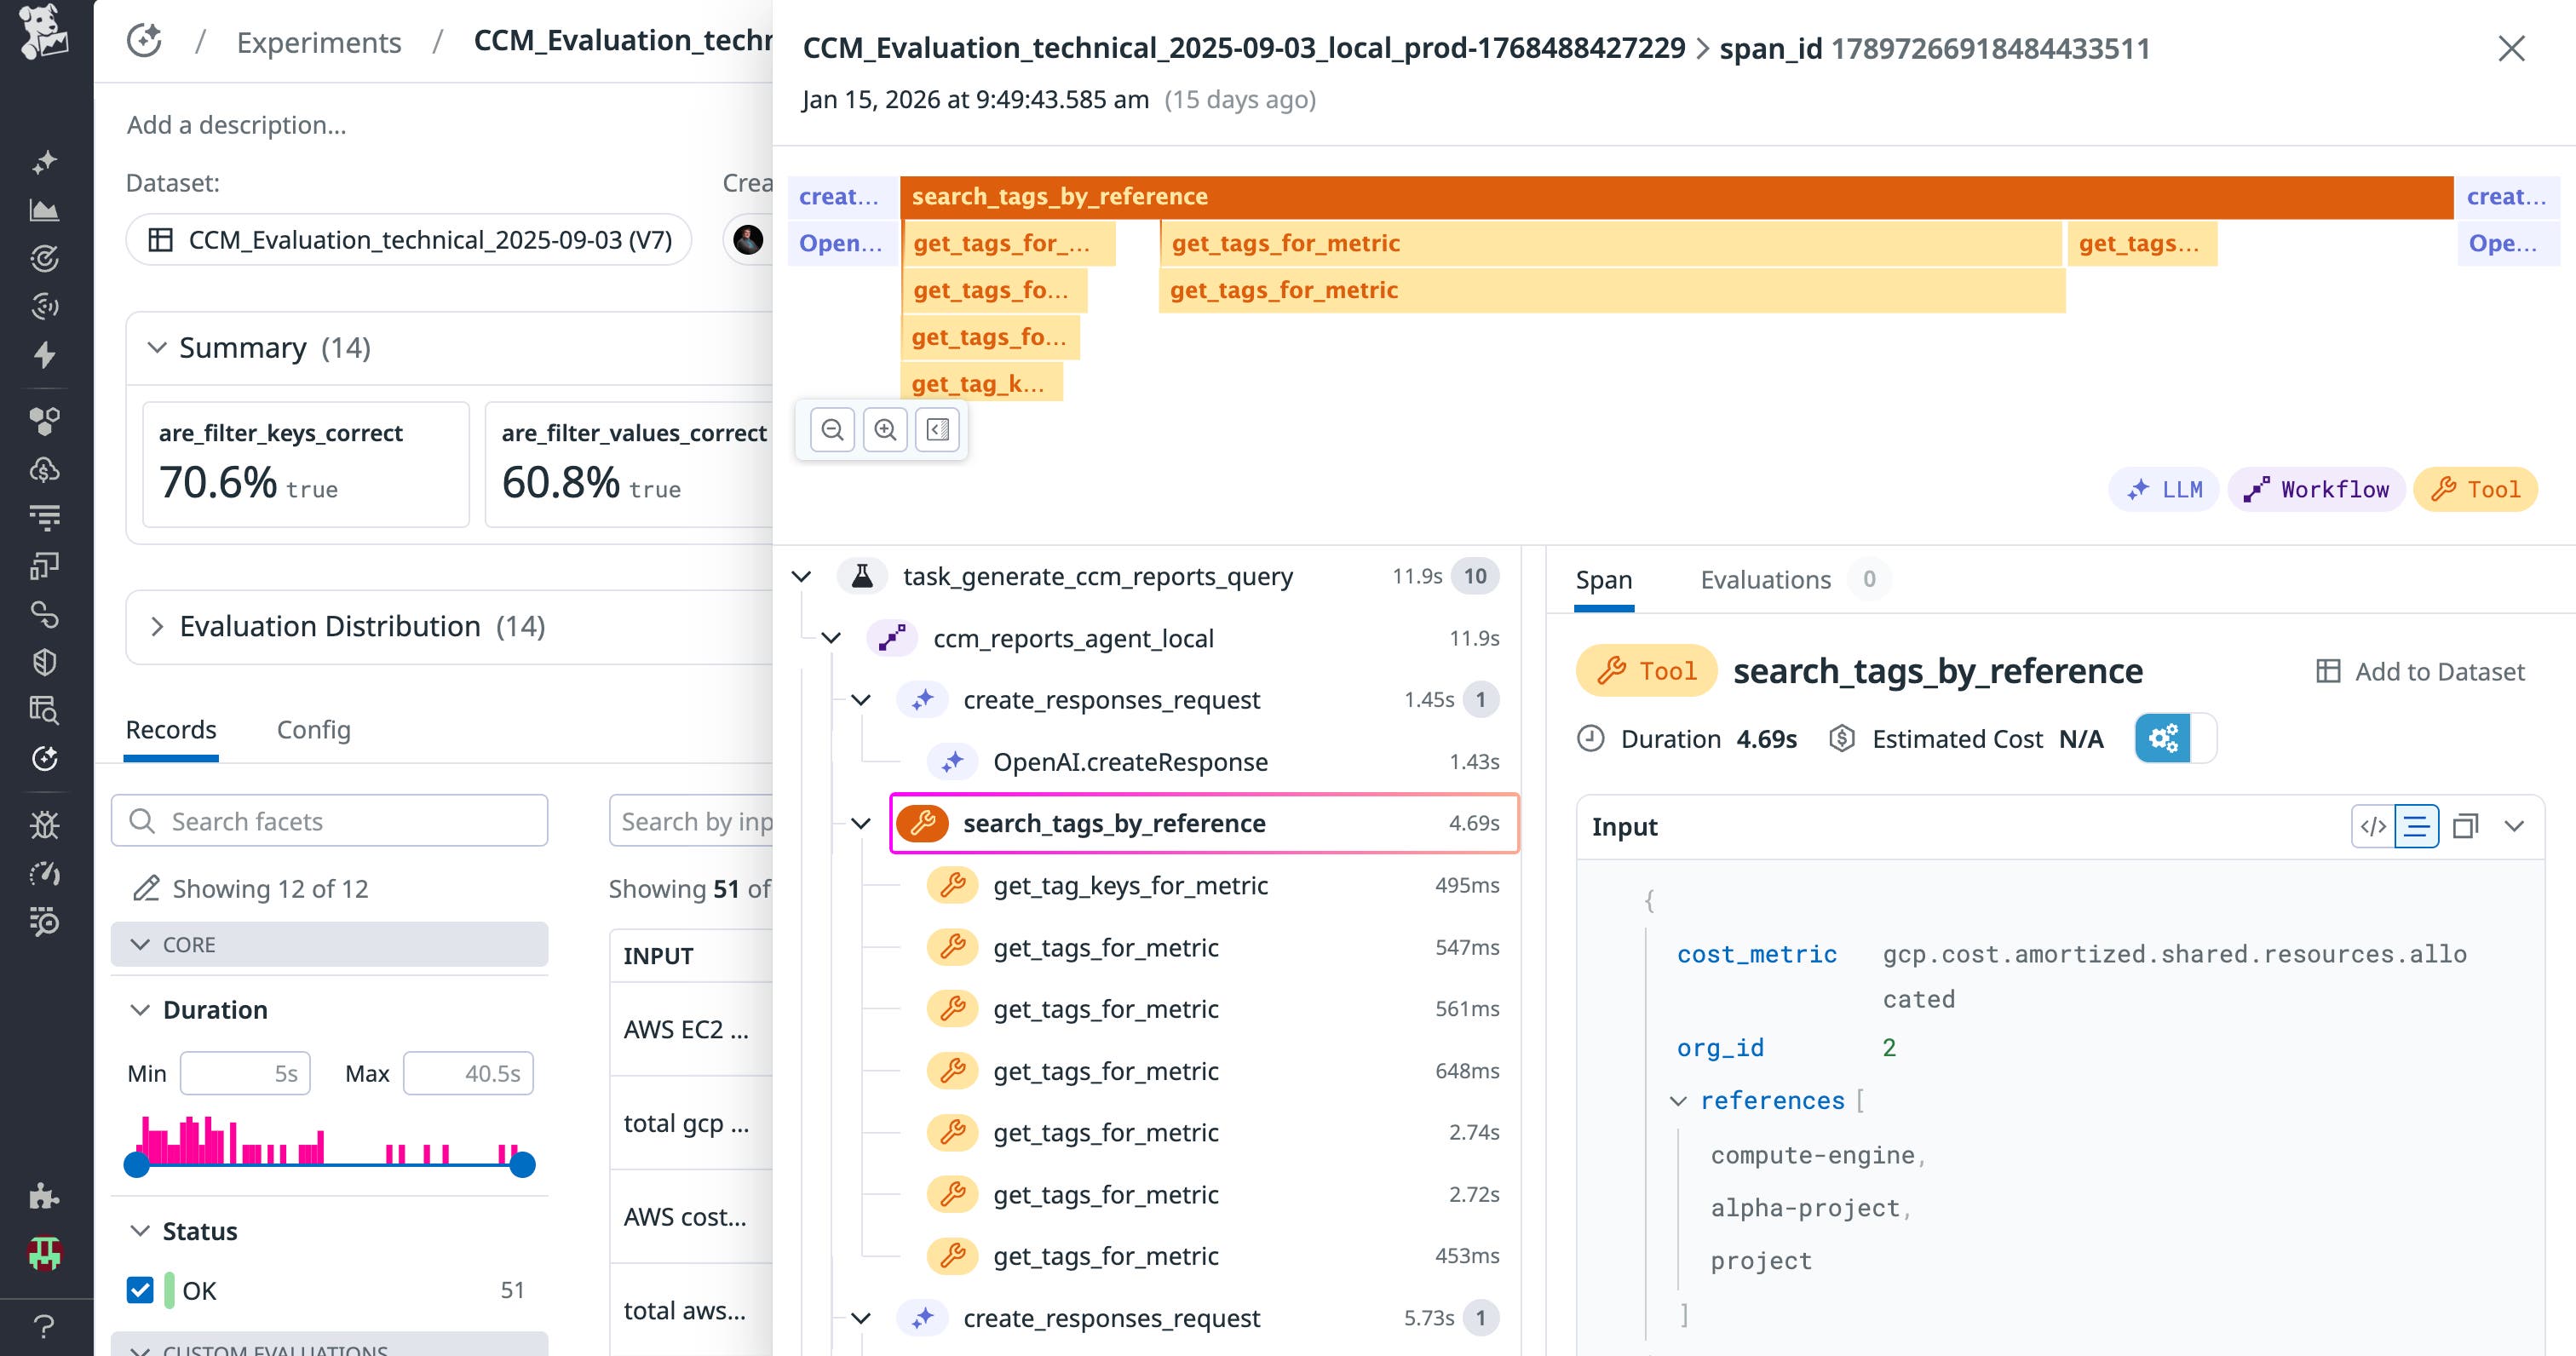
For example, when a filter evaluator fails, we can see whether the agent failed to identify the correct tag, the tool search returned unexpected results, or a later step overwrote part of the query. Instead of reading 50 queries side by side, we can filter failing runs, open a trace, and see exactly where the behavior diverged.
Automating scaled experimentation with every build
Once evaluators were defined, we simplified the entire experimentation process. With every code change, we can now quickly trigger a run of LLM Observability Experiments against the same dataset.
These evaluations are run locally to save time and avoid deployments, and they can be executed against real staging and production endpoints on demand to ensure that authentication, routing, and tool calls match live behavior. The modular design lets engineers add new evaluators as needed, and because experiment results appear automatically in the Datadog UI, the team quickly folded testing into their CI/CD workflow.
Overall, component-level scores surfaced a clear performance profile for our NLQ agent:
- Parsing and roll-up were consistently strong.
- Metric family detection was reliable, though specific queries varied.
- Filters—particularly tag value matching—were the primary source of error.

These insights helped the team prioritize fixes. Rather than debugging entire queries, they could target specific weaknesses like tag resolution or filter application. Each improvement showed up as a measurable change in experiment results.
Debugging and iterating faster with evaluator-driven tracing
LLM Observability turned a fragile, manual testing process into a system of record by combining datasets, component-level evaluators, experiments, and agentic tracing. Previously, identifying the source of a failure required manually comparing query strings and guessing what changed. With Experiments, a drop in a specific evaluator score immediately indicates the class of failure. LLM traces then let engineers jump directly to the failing runs and inspect the tool calls and intermediate outputs responsible.
In practice, this workflow reduced debugging and analysis for agent failures from hours to minutes. This includes detecting a failed evaluation and identifying the root cause via trace-level inspection. We’ve seen a roughly 20x reduction in time spent on these agent investigation steps by using LLM Observability, driven by evaluator-based filtering and trace-level inspection rather than manual query comparison. Just as importantly, every change is measurable. Each commit runs against the same dataset, regressions surface immediately, and improvements appear directly in evaluator scores.
Evaluating other models, such as Anthropic Claude, is as simple as changing a configuration variable and re-running the same dataset and evaluators. The experiments are standardized, meaning we can compare models objectively across evaluator scores (query correctness by component), latency, and token usage and cost. Future iterations will test smaller or more specialized models once accuracy stabilizes, using the same datasets and evaluators as a consistent baseline. Because LLM Observability is built on the same distributed tracing we already use for APM, we avoided introducing another isolated tool. Agent behavior, application behavior, and infrastructure signals live in the same place, which matters as agents grow more complex.
Build evaluation and tracing into your agent loop
By using Datadog to build Datadog, we had a repeatable, reliable system to evaluate and iterate our NLQ agent. Datasets defined what to test, evaluators made correctness measurable, experiments validated changes at scale, and LLM traces made debugging tractable.
To learn more about how LLM Observability can help you evaluate and debug your agent loop, check out our documentation. If you’re new to Datadog, get started with a 14-day free trial.


