Harmit Minhas

Corey Ferland

Alex Guo

Will Potts
This article is part of our series on how Datadog’s engineering teams use LLM Observability to iterate, evaluate, and ship AI-powered agents. In this first story, the Graphing AI team shares how they instrumented their widget- and dashboard-generation agents with LLM Observability to detect regressions and debug failures faster.
Visibility into how large language model (LLM) applications behave in real time is essential for building reliable AI-driven systems at Datadog. Within our Graphing AI team, engineers are collaborating on two core agents that turn natural language into Datadog visualizations.
The widget agent takes user prompts such as “show average CPU utilization over time for production hosts” and converts them into valid widget JSON definitions. The dashboard agent extends that functionality to compose entire dashboards from multiple widgets. Together, these agents make Datadog dashboards more accessible by letting users describe what they want to see instead of writing queries manually.
In this post, we’ll describe how our Graphing AI team uses Datadog LLM Observability to debug and understand agentic behavior, measure semantic and functional accuracy across model versions, and automate evaluation and structured testing at scale with the Experiments feature.
Challenges in building reliable AI agents
Before instrumenting with LLM Observability, our evaluation process was largely manual. Each agent invocation involves multiple LLM calls and downstream tool executions that depend on one another. When a widget failed to render correctly, we had little visibility into whether the issue came from the prompt, a model response, or a downstream service call.
For example, the dashboard agent orchestrates a sequence of LLM completions: One to decompose the user request into component widgets, one to generate each widget definition, and several to call tools that fetch metric metadata. Failures in these chains rarely threw explicit exceptions. Instead, we would see malformed widget JSON or incomplete dashboards without clear signals as to where the fault occurred. We needed a way to trace the entire prompt and tool call sequence, evaluate semantic quality programmatically, and compare model and prompt versions objectively.
Instrumenting agents for LLM Observability
To achieve full transparency, we instrumented both the widget agent and dashboard agent using LLM Observability. We added LLM Observability’s SDK calls within each agent chain to record the life cycle of every LLM interaction and tool execution. Each trace now includes:
- The raw user prompt and the system prompt used to seed context
- All intermediate LLM completions (e.g., widget schema generation and dashboard composition)
- Tool invocation inputs and outputs, including authentication results and response payloads
- Metadata such as latency, token counts, and cost estimates
These traces are collected and visualized within Datadog, letting us see the full call graph of an agent execution. By following Datadog’s public documentation and adding the SDK initialization to our evaluation scripts, we began streaming traces within a few hours.
Tracing agent behavior to debug and understand complex chains
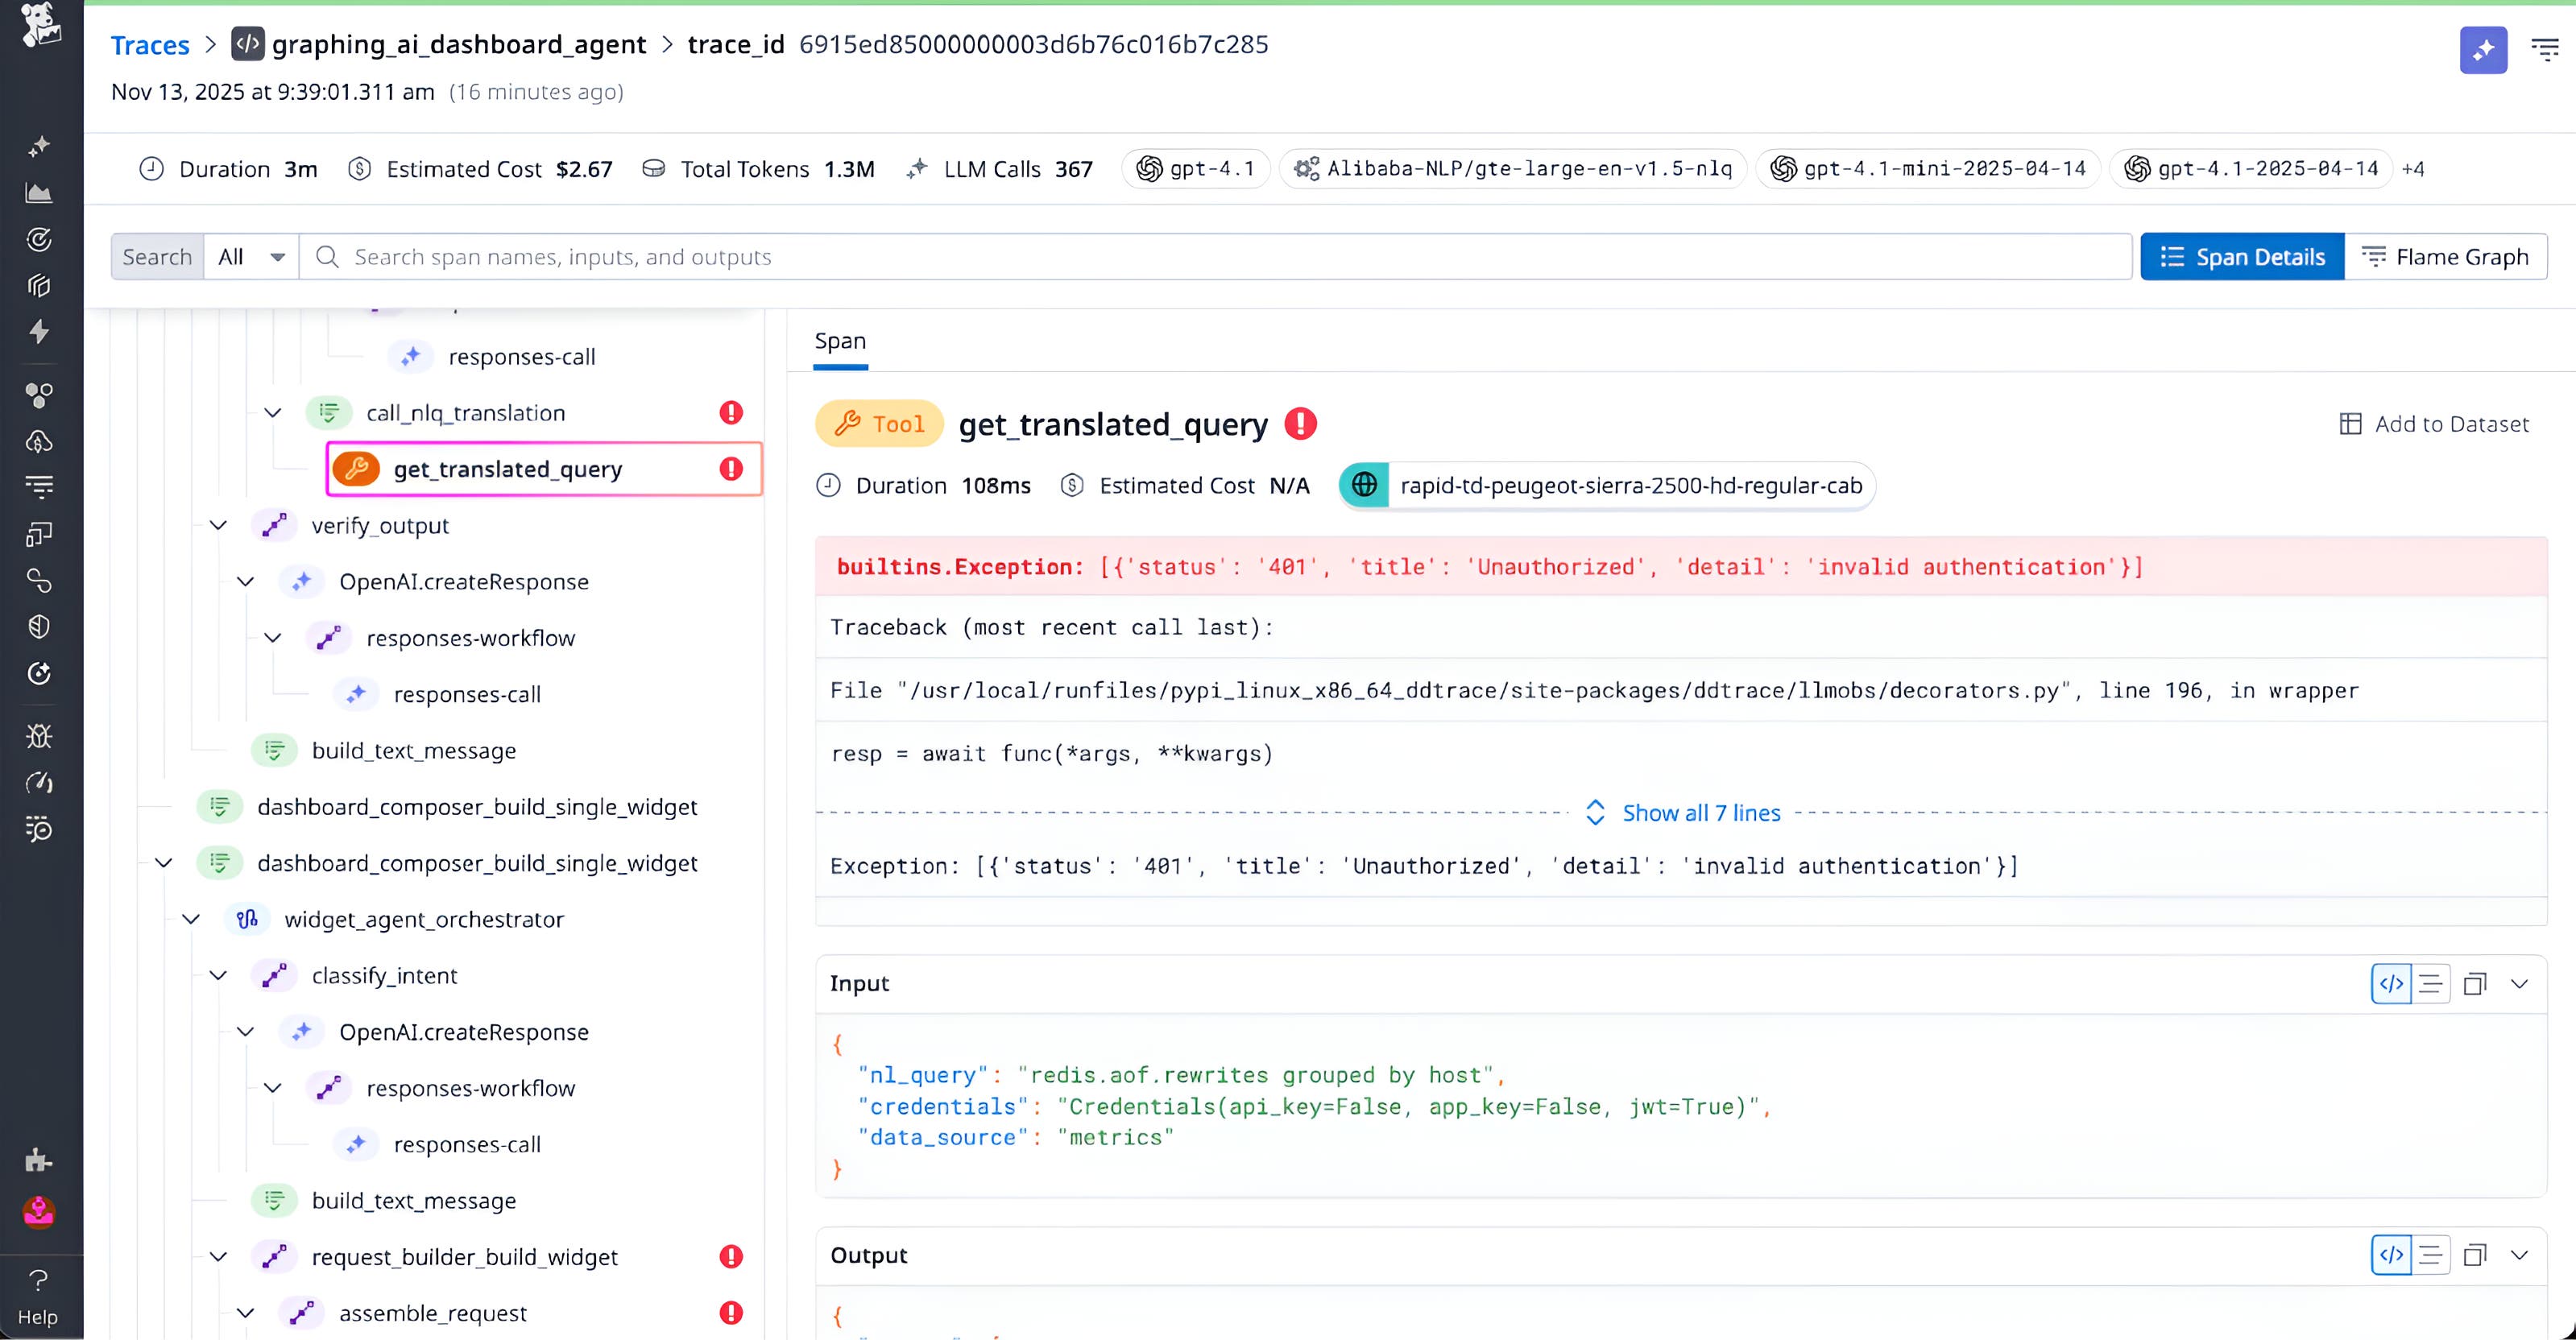
Once traces were captured, they immediately became our primary debugging tool. During one incident, we noticed that generated dashboards were missing several widgets. There were no errors thrown, but examining the trace revealed that multiple tool calls to our metrics service were returning HTTP 401 responses. The trace identified the exact service endpoint and authentication context that failed, and updating the service credentials resolved the issue.

With LLM Observability’s cross-cutting context between agent logic and the services it depends on, we no longer have to guess whether a degraded result stems from prompt quality, model behavior, or infrastructure issues. Each trace correlates prompt text, tool responses, and latency data in one view, allowing us to distinguish between model and non-model issues.
Evaluating the semantic quality and performance of our agents
With tracing in place, we built a reproducible offline evaluation pipeline to measure semantic and functional accuracy. Our evaluation dataset consists of input-output pairs where the input is a user prompt describing a desired visualization or dashboard, and the expected output is one or more canonical widget JSON definitions validated by Datadog engineers.
Each test case undergoes two types of checks: programmatic validations and LLM-as-a-judge evaluations. Programmatic validations are deterministic checks implemented in Python. We verify that the generated JSON conforms to Datadog’s schema, that required fields (for example, definition.requests.queries.metric) are present, and that any metric referenced in the input prompt appears in the resulting query.
LLM-as-a-judge evaluations are semantic comparisons performed by another model using an evaluation rubric. The judge receives structured inputs that include the user’s prompt, expected criteria or examples, and the agent’s output. The rubric evaluates three dimensions: correctness, quality, and completeness. It instructs the model to analyze the agent’s output against the user request, compare it with the expected outcome, and assess both technical accuracy and overall usefulness. Final scores are discrete values of 0.5 or 1. Even if the generated JSON does not match the reference exactly, the judge passes it if it meets the user’s intent. For example, a valid alternative visualization type or query ordering is not penalized.
We keep the scoring system intentionally binary for stability:
- Quality score: 1 for pass, 0.5 for uncertain
- A/B score: 1 if the current version outperforms the previous iteration, 0.5 if they tie
This convention makes evaluations easy to interpret and avoids overfitting to noisy model judgments.
Experimenting with model and prompt configurations
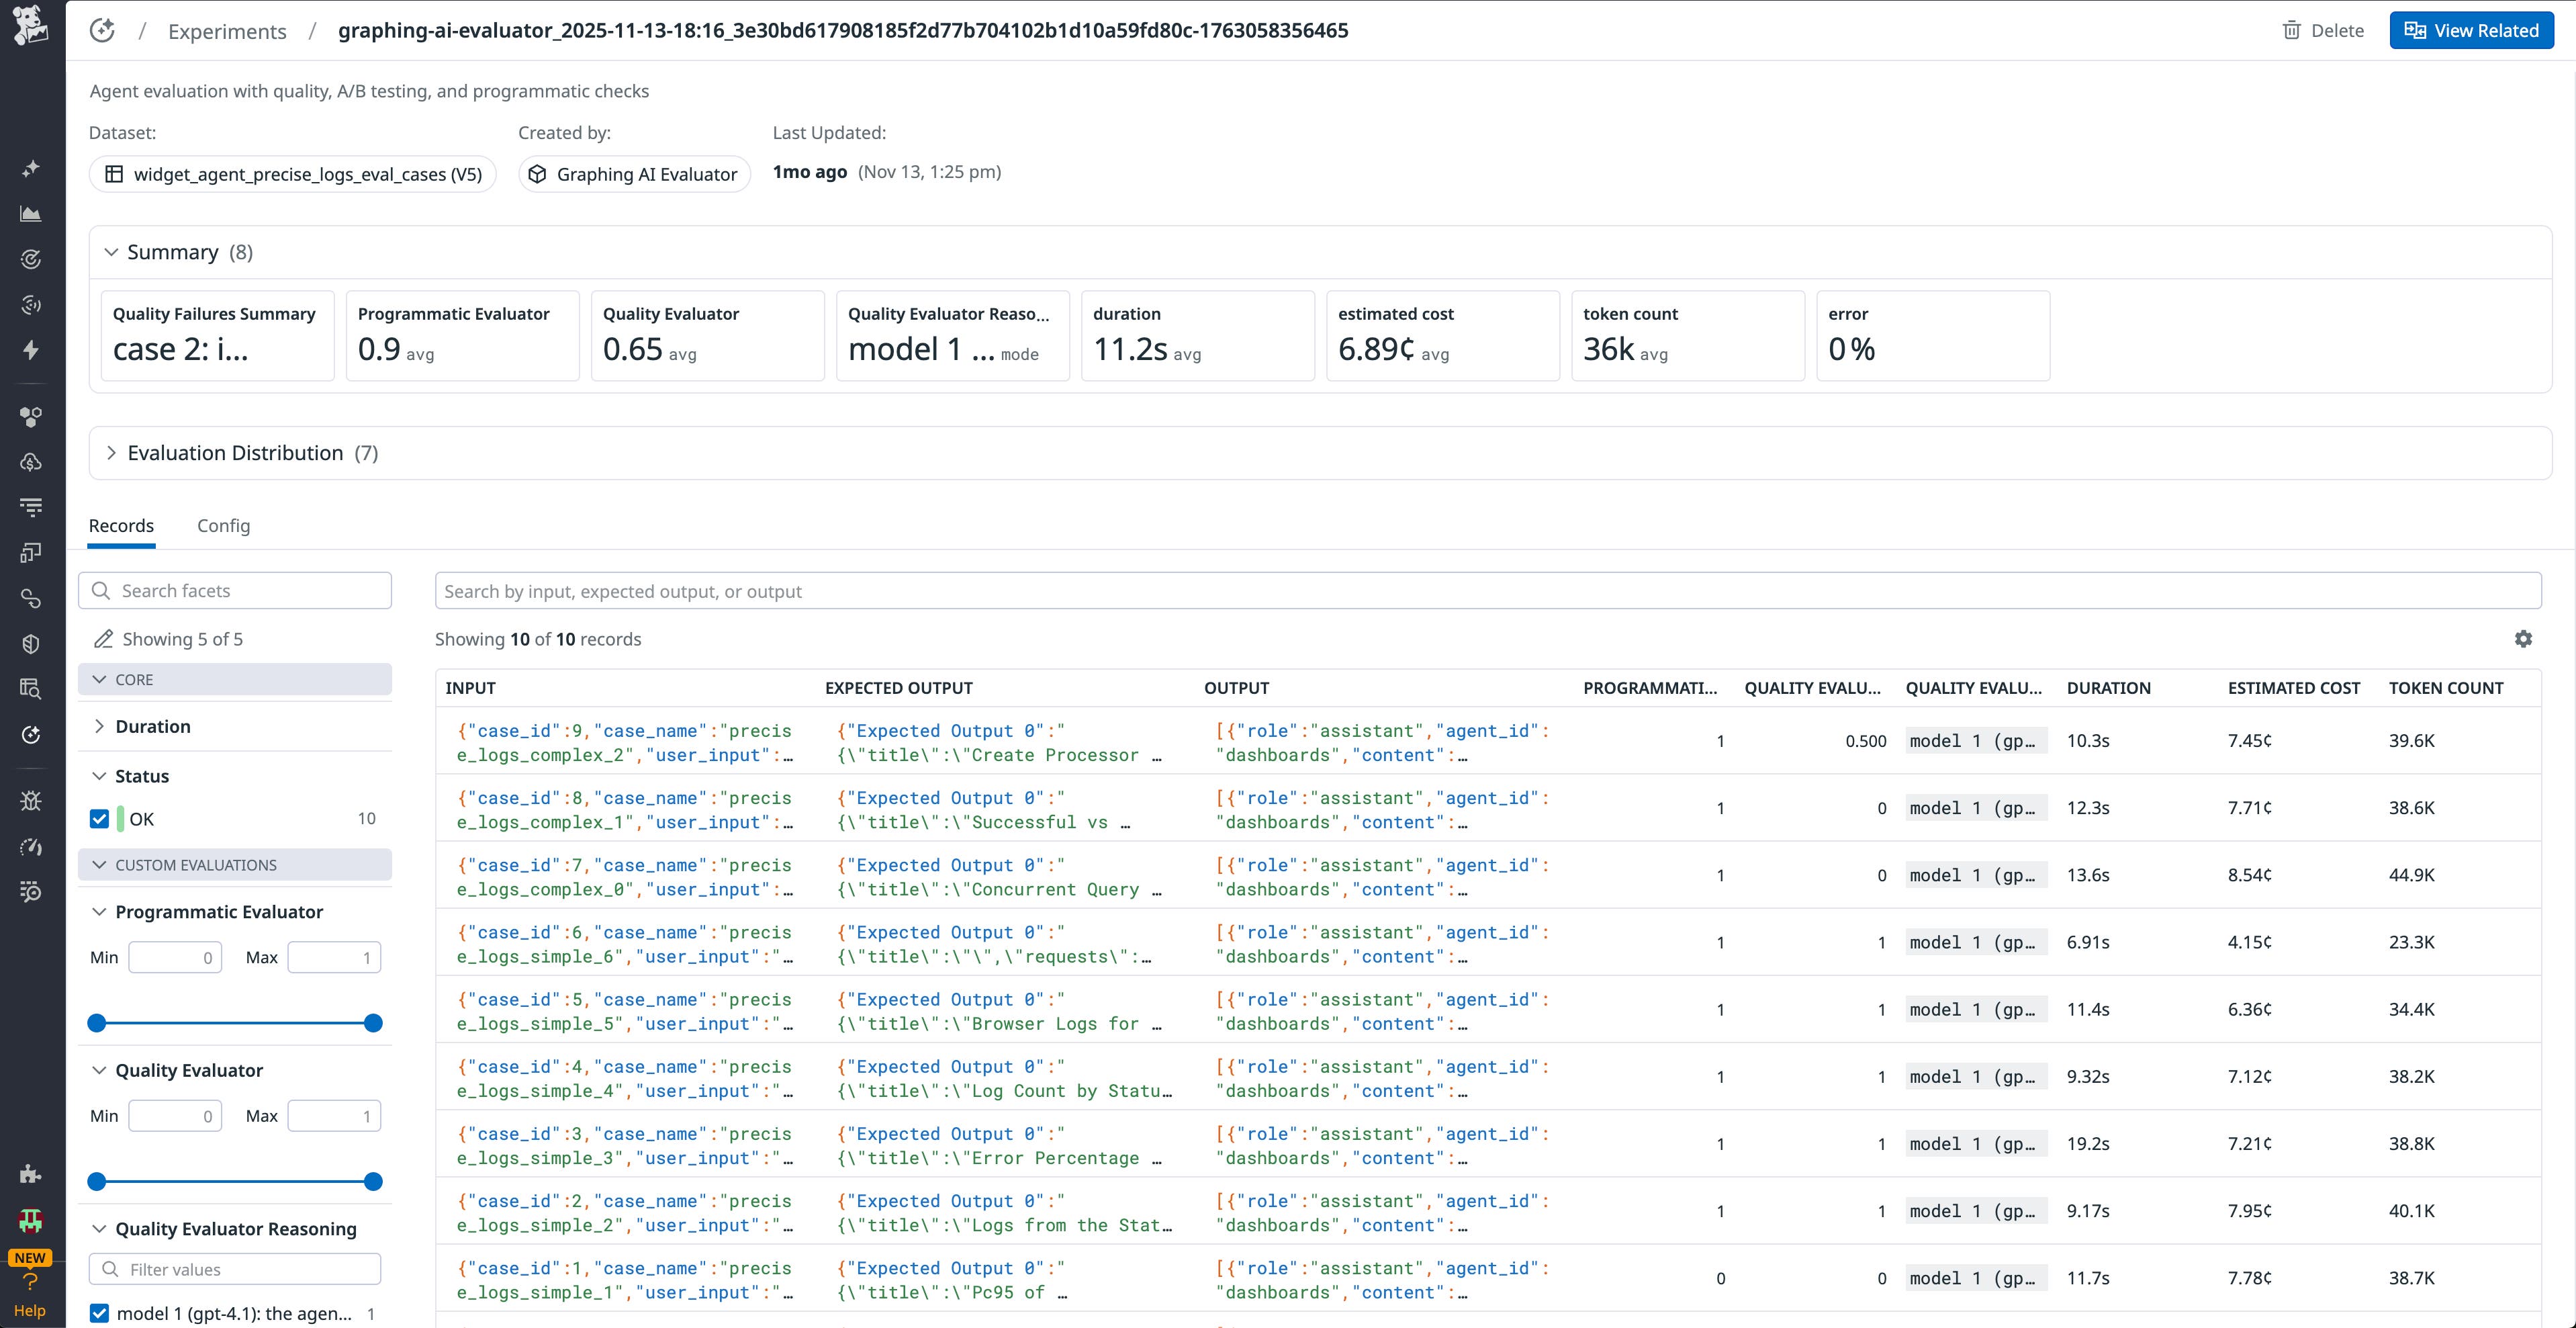
We integrated our evaluation pipeline with LLM Observability’s Experiments feature to automate result tracking and visualization. A lightweight internal service runs evaluations on every code push to staging and production. The service collects results from both the programmatic and LLM-as-a-judge evaluations and publishes them to Experiments, which aggregates scores across datasets and versions.
During one deployment, Experiments reported multiple test cases returning NaN quality scores. This issue traced back to a serialization bug introduced in a recent commit. Because the results were automatically reported, we identified and reverted the change within minutes.
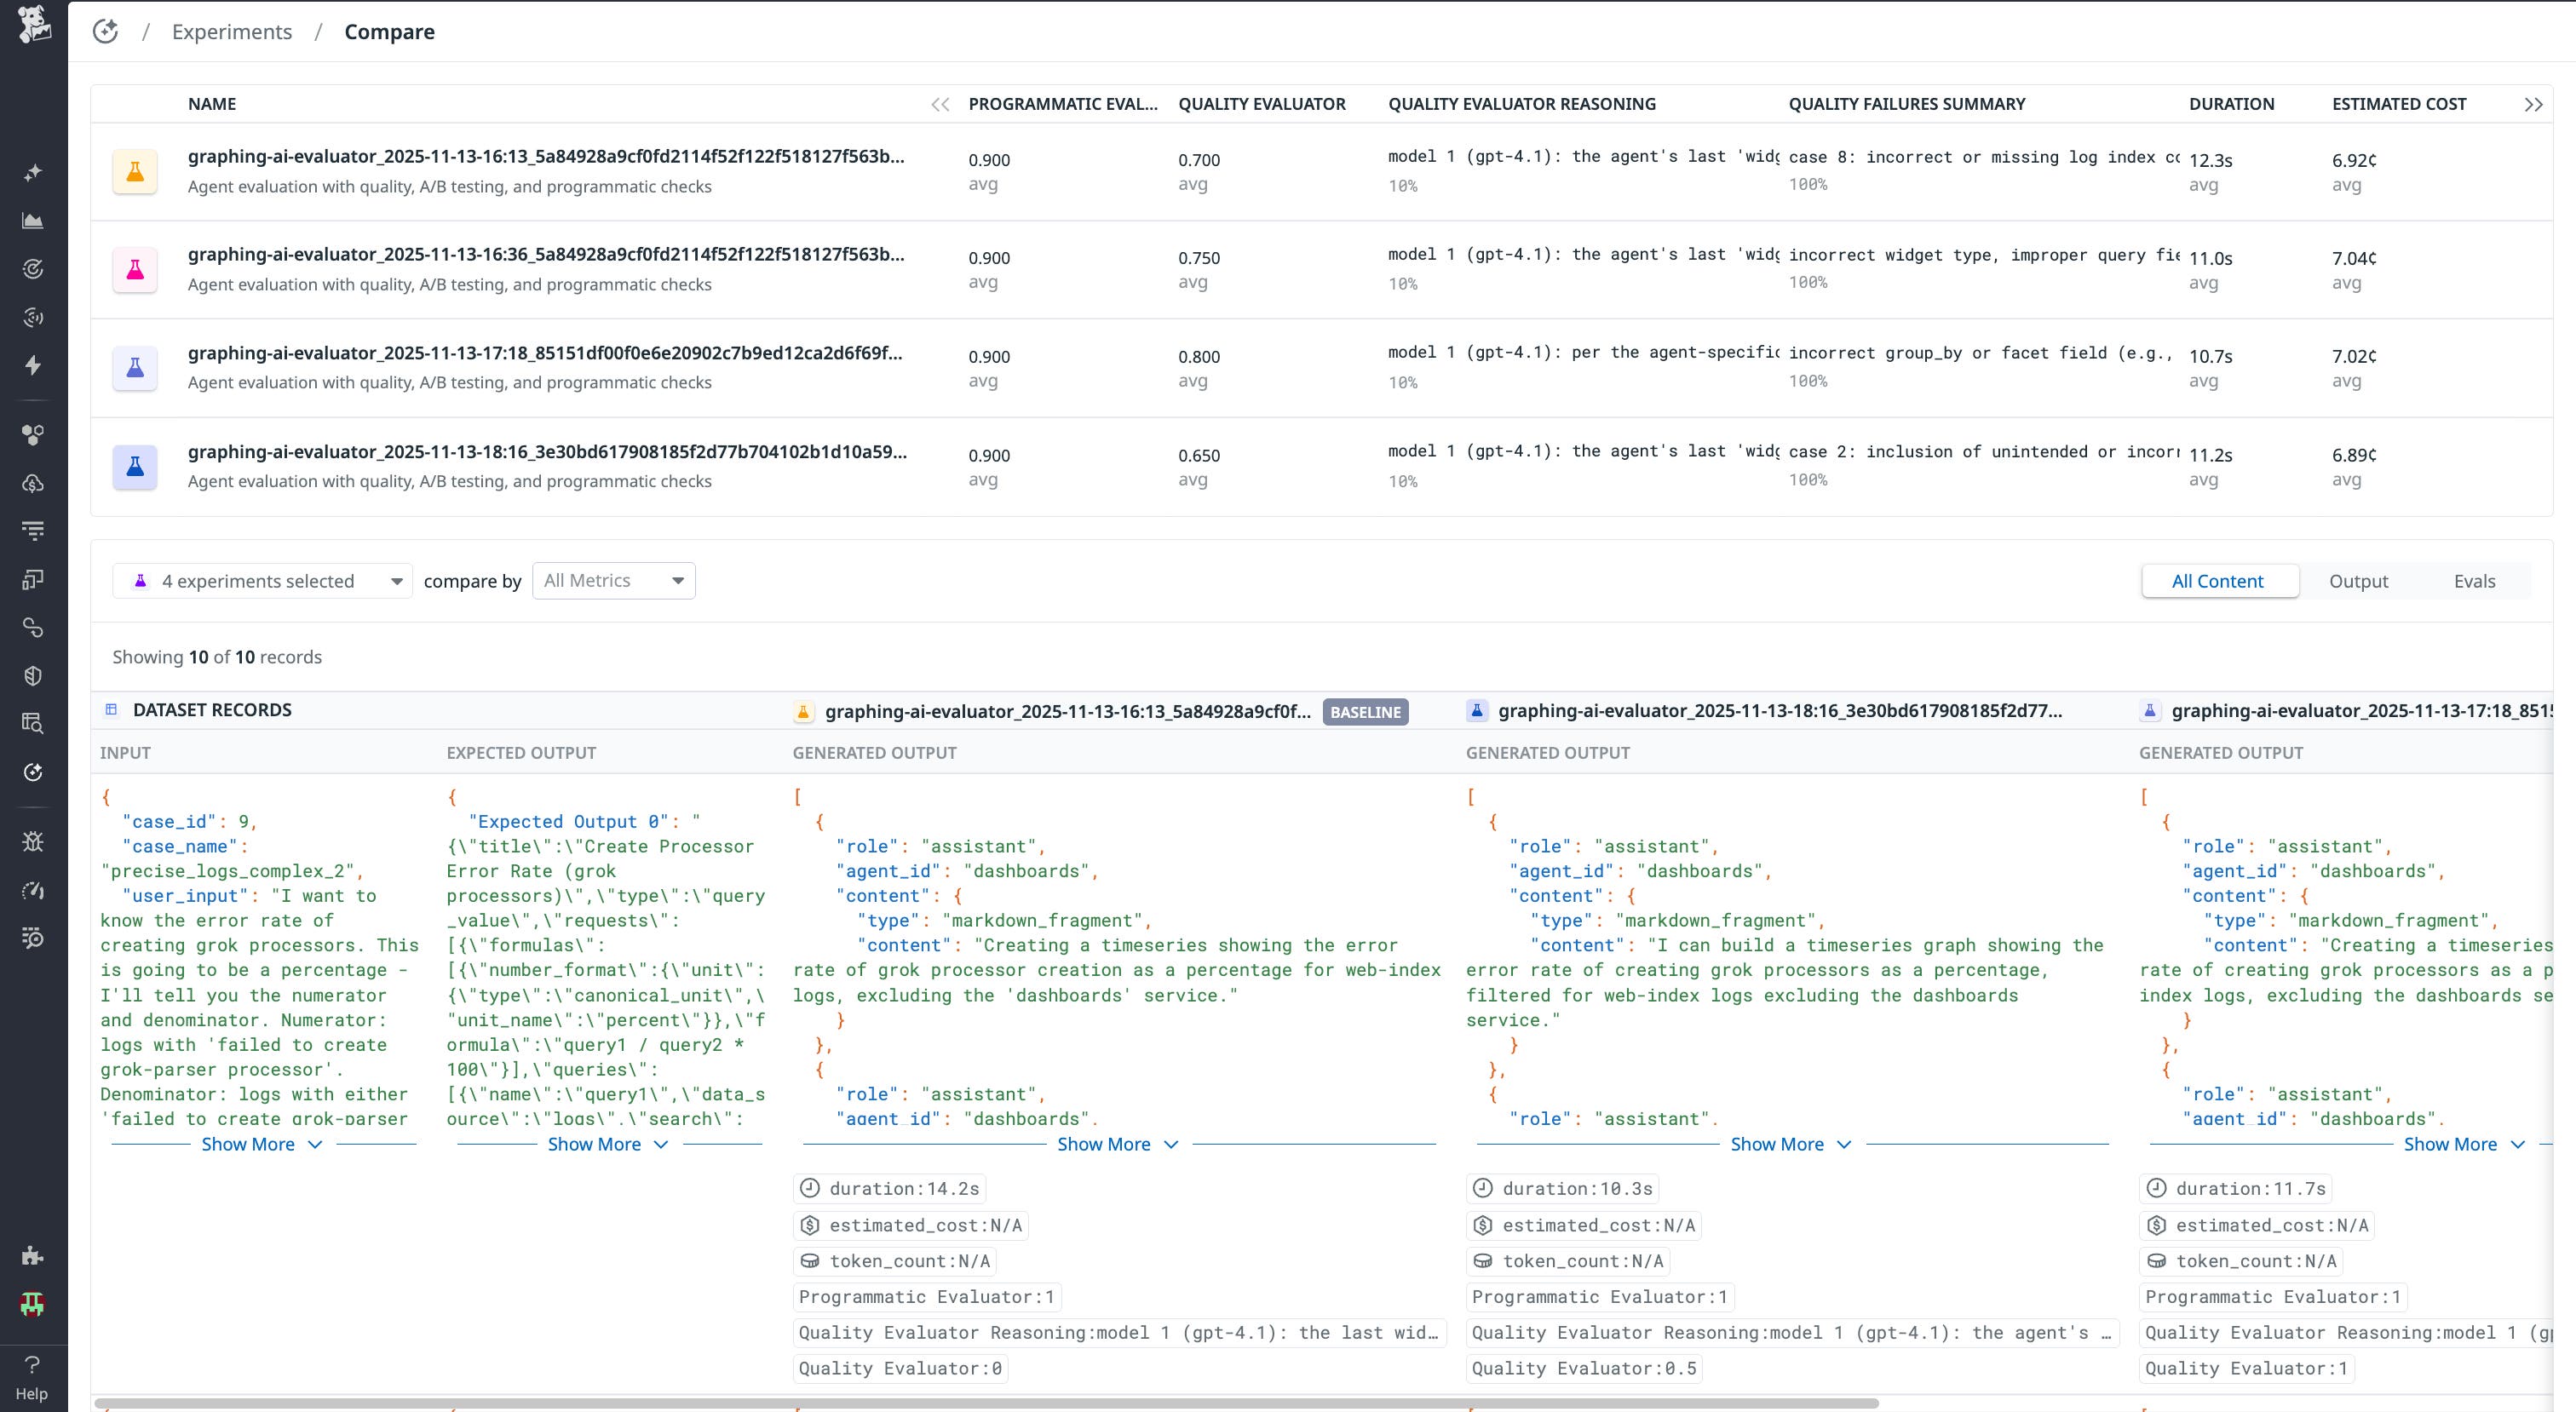
Today, our Experiments dashboards provide a continuous view of model performance. We can visualize aggregate scores, drill into failing cases, and compare outputs across prompt or model versions. The dataset continues to expand as we add new test cases that cover additional dashboard types and configurations.

Currently, our agents use OpenAI models accessed through Datadog’s AI proxy. OpenAI’s structured output mode allows us to define strict JSON schemas for both widget and dashboard definitions. These structured responses make it easier to run programmatic checks and help downstream components consume results without post-processing.
Experiments also help us see when our prompts or evaluations need improvement. If the same test keeps failing across several runs, it usually means the problem isn’t with the model but with the test itself or how the judge is scoring it. Looking across experiments makes these patterns easy to spot and helps us adjust our prompts, expected outputs, or evaluation setup.

As we refine our prompts, we use Experiments to run controlled comparisons between different system prompt templates and context window configurations to understand which options produce more accurate dashboards with fewer tokens and lower latency.
What’s next: Expanding to other model providers and future projects
The next phase of our experimentation will include evaluating Anthropic Claude models alongside OpenAI’s. We plan to reuse the same evaluation dataset and pipeline to measure each provider’s performance on identical tasks. Because LLM Observability integrates with multiple model providers through the AI proxy, we can instrument, trace, and evaluate both models without any additional setup.
This cross-model comparison will help us determine which model performs best for different evaluation dimensions—such as adherence to structured output, latency, and instruction-following precision—while maintaining a consistent measurement process. Having this unified view within Datadog helps ensure that model selection decisions are evidence-driven rather than anecdotal.
By combining LLM traces, structured evaluations, and automated experiments, our Graphing AI team has established a scalable framework for building reliable AI applications. The same observability patterns we use for LLM chains can apply to any agentic system that orchestrates models, tools, and APIs.
This workflow serves as the foundation for future projects that will bring LLM Observability into production. We plan to extend this framework by correlating online evaluations with Real User Monitoring (RUM) data, giving us the ability to measure real-world user experience metrics alongside model performance. To learn more about how LLM Observability can help you evaluate and ship AI applications, check out our documentation. Or if you’re new to Datadog, sign up for a 14-day free trial.


