Tom Sobolik

Shri Subramanian

Charles Jacquet
To efficiently optimize your LLM application before pushing to production, you need a comprehensive testing and evaluation framework. By running experiments, you can optimize prompts, fine-tune temperature and other key parameters, test complex agent architectures, and understand how your application may respond to atypical, complex, or adversarial inputs. However, it can be difficult to manage your experiment runs and aggregate the results for meaningful analysis. Additionally, without effective governance of your experiment datasets, it’s hard to be confident that your applications are being tested appropriately.
Datadog LLM Observability’s new Experiments feature enables you to quickly test out new prompts and models in the Playground, then curate and manage datasets to run experiments and analyze evaluations and telemetry across multiple runs. With the Experiments SDK, you can build, run, and automatically trace experiments with full span-level visibility into every LLM call, retrieval, tool, or agent step.
In this post, we’ll show how Experiments supports your entire LLM application development lifecycle—starting from quick Playground iterations on production traces, through dataset versioning and structured evaluations, to model comparison and deep output analysis—all from within LLM Observability’s unified environment.
Start with Playground to validate ideas quickly
When developing LLM applications, issues often surface first in traces or flagged evaluations—maybe a prompt produces an incomplete response, or a trace reveals unexpected latency. Playground enables you to immediately investigate these kinds of issues before setting up a full experiment. With a single click, you can import a problematic trace and replay it with alternative prompts, providers, or parameters. Because Playground uses Datadog’s trace spans (LLM spans, tool spans, retrieval spans, and agent spans), you can see exactly how each adjustment impacts latency, cost, and output quality for the specific workflow execution that you first observed an issue with.
For example, let’s say you’re building an LLM application to summarize news articles. You’ve set up online evaluations that flag problematic traces, and one trace shows the model truncating summaries mid-sentence. You can open that trace directly in Playground and test specific adjustments, such as:
- Lowering the temperature to reduce randomness and improve consistency
- Increasing the max_tokens parameter to prevent truncation and allow longer context
- Adding or modifying stop sequences to enforce complete, well-formed summaries
By iterating in Playground, you can confirm whether the root cause was prompt design, configuration limits, or model behavior. Once you identify the best-performing configuration, you can export it directly into your codebase or promote it into a dataset for further experimentation. This workflow ensures that improvements validated interactively in Playground are carried forward into structured, repeatable experiments.
Build datasets for experimentation
Your experiments are only as good as the data you’re feeding them. It’s paramount to have clear visibility into the test data used for your experiments so you can ensure that this data is high-quality and annotated correctly, avoiding false evaluations. Creating test datasets can be tedious and error-prone. For instance, if you want to sample production data for your test datasets, you might find yourself meticulously copying and pasting LLM inputs and outputs from logs or traces into spreadsheets.
Datadog LLM Experiments solves this by letting you import data from your production traces in LLM Observability with a single click—or programmatically create test datasets by using the LLM Experiments SDK. LLM Experiments also supports version control for datasets, so you can pull and push datasets to Datadog to manage them in the UI and easily share them across your team. Plus, you can seed datasets with cases validated in Playground, ensuring that debugging results are captured and re-tested systematically. Datasets can contain inputs, outputs, evaluation metadata, and span context, and support version control—enabling you to pin experiments to specific dataset versions.
The Datasets view enables you to create, view, and manage your experiments’ datasets from the Datadog web UI. The dataset page shows all records, including each record’s input, output, and metadata. You can also manually add new records to the dataset from this view. For example, the following screenshot shows records from a dataset containing question-answer pairs for a personal finance application.
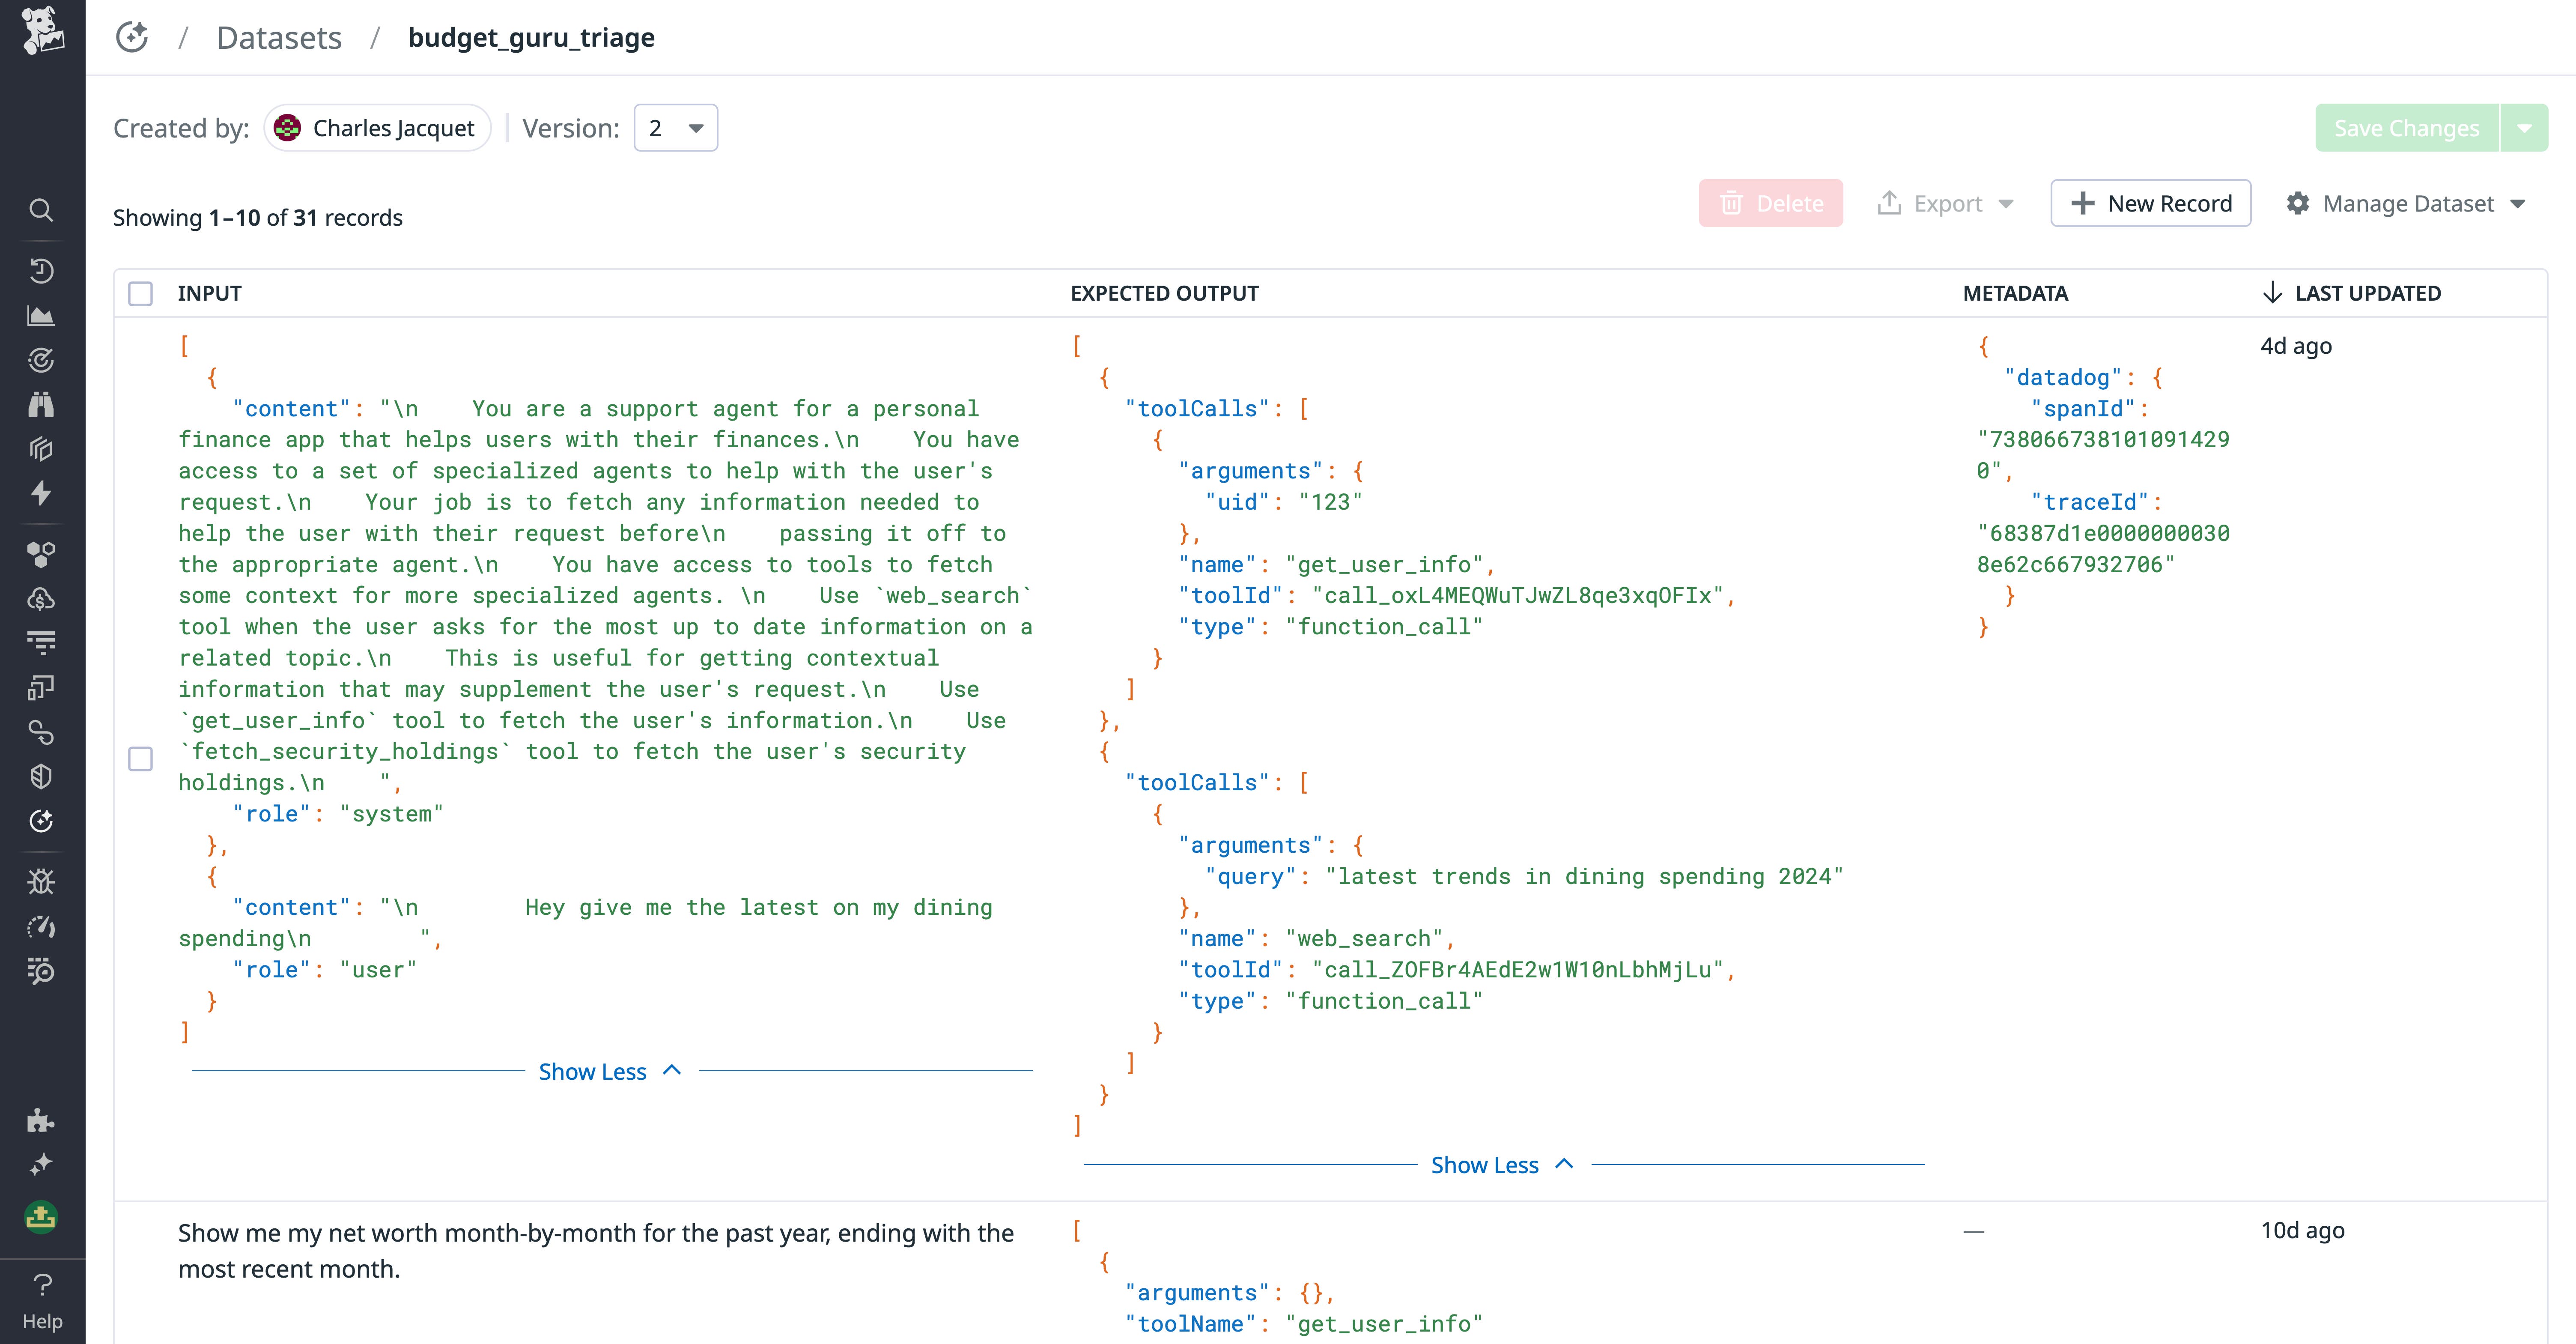
If you spot an issue with a record, you can click into it and edit all the fields directly within the web UI. To preserve your changes, collaborators can clone their own versions of your dataset and work on them separately. All previous versions of the dataset are stored, so you can troubleshoot problems with an experiment that used an older version of the dataset.
Monitor experiment runs and form insights
Datadog LLM Experiments offers a complete set of tools for creating and monitoring experiments and test datasets. The Experiments SDK lets you write and run experiments that are automatically traced by Datadog and annotated with test dataset records for monitoring with LLM Observability. Every experiment run is automatically instrumented to capture span kinds (LLM, retrieval, embedding, agent, and task spans), giving engineers full visibility into how model calls, tools, and control logic are executed.
Experiments consist of tasks and evaluators. Tasks define the business logic of experiments (determining how your application will run on the provided data), while evaluators are used to score and compare all the outputs produced by tasks. Tasks can be as simple as a single LLM call, or as complex as a multi-agent workflow—Datadog ingests and tracks all subtasks for monitoring via traces. For instance, let’s say you’re experimenting with a RAG application. You could write a task that contains an LLM prompt and uses the RAG pipeline to generate additional context for the system prompt. You could then create evaluators to compute faithfulness, contextual precision, and contextual recall scores for the application’s RAG retriever. Finally, you can run the experiment, which will evaluate the app’s output based on the three scores you have defined.
As soon as you run an experiment, traces of the run and details about the experiment become automatically available in Experiments. You can use Experiments to continually monitor evaluations and characterize application performance, comparing this data across multiple experiments, as well as troubleshoot issues with your experiments using traces.
Analyze experiment results to find optimizations
The Experiment Details page gathers telemetry about all of an experiment’s runs, including duration, errors, and evaluation scores. To understand how an experiment performed across all runs, you can view averages of its evaluations and performance metrics in the Summary section. Then, you can use the Evaluation Distribution to further home in on a subset of experiment runs that had evaluations or metrics within a problematic threshold. This can help you find opportunities for optimizations.
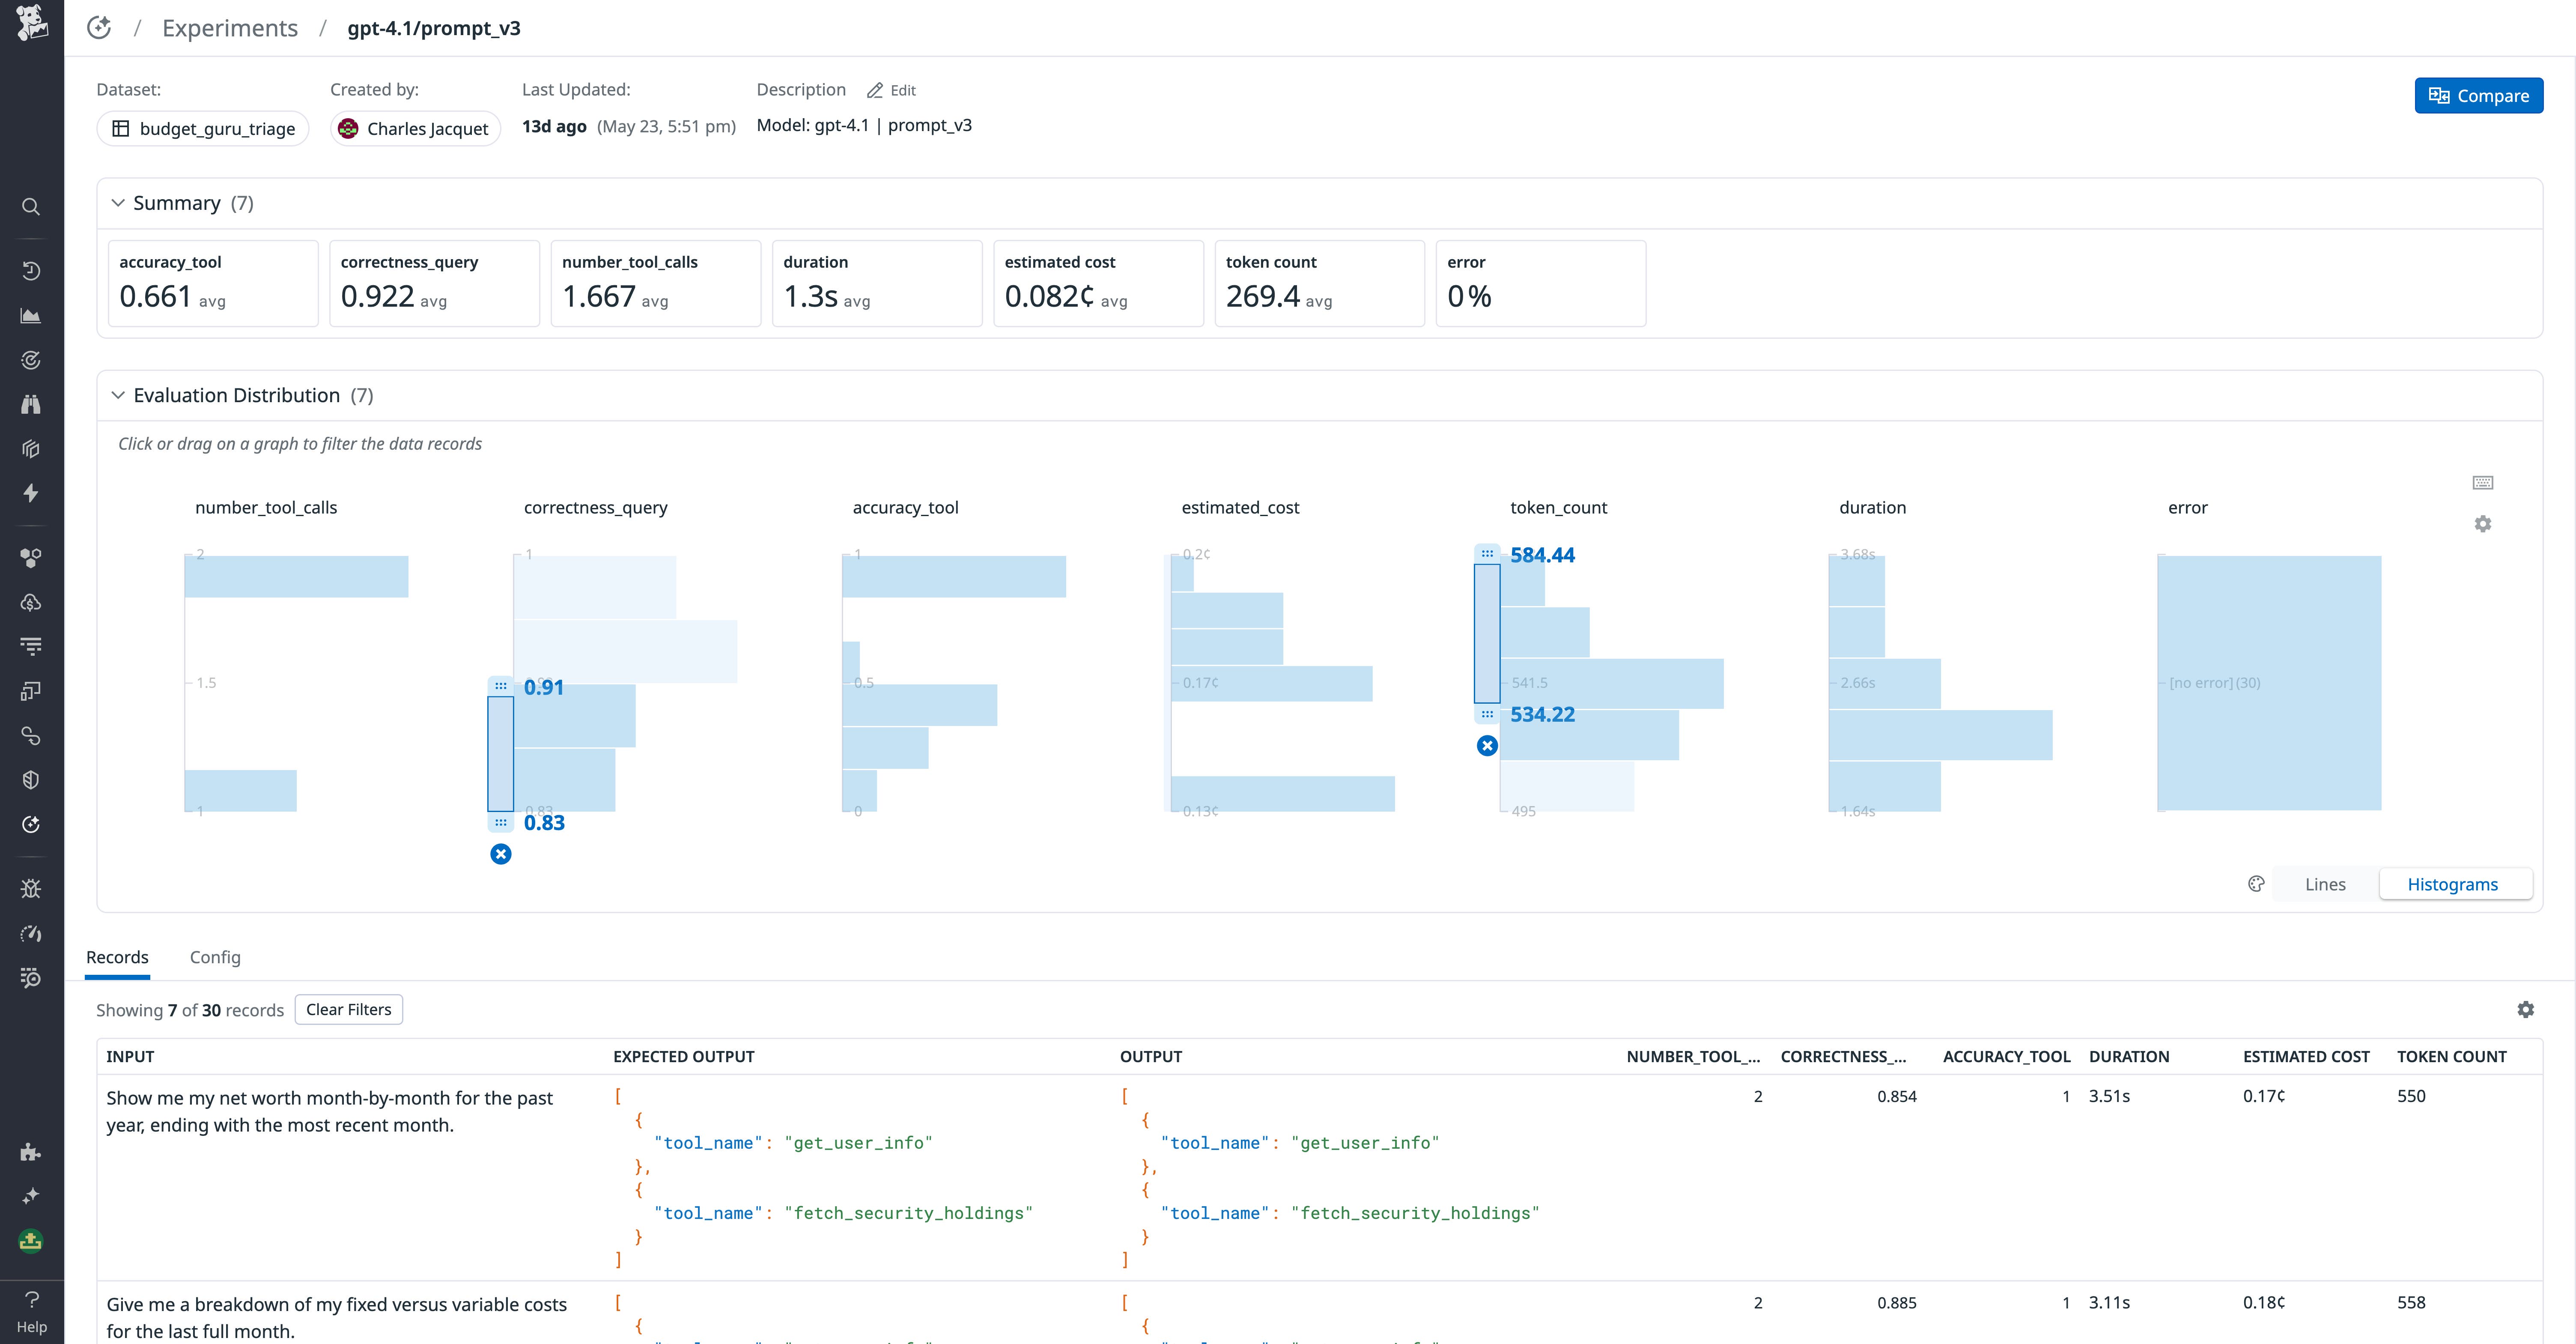
For example, the preceding screenshot shows the Evaluation Distribution filters that highlight all experiment records with a high token count (indicating verbose and potentially costly inputs and outputs) and a suboptimal correctness_query score. By applying these filters, you can view a list of interesting records, examine the records’ inputs and outputs, and then drill into traces to investigate potential root causes of the highlighted performance issues. Additionally, teams can filter records by operational metrics such as latency, cost, or token count, alongside evaluation scores, to pinpoint high-cost or low-accuracy cases. By inspecting traces, you can see whether issues stemmed from prompt content, retriever performance, or external tool calls.
You can inspect each of these records’ traces in the run side panel. This includes tool and task executions and each individual LLM call used to produce the final output. Continuing our previous example, the following screenshot shows a prompt execution trace for a run with an unusually high token count and low correctness_query score.
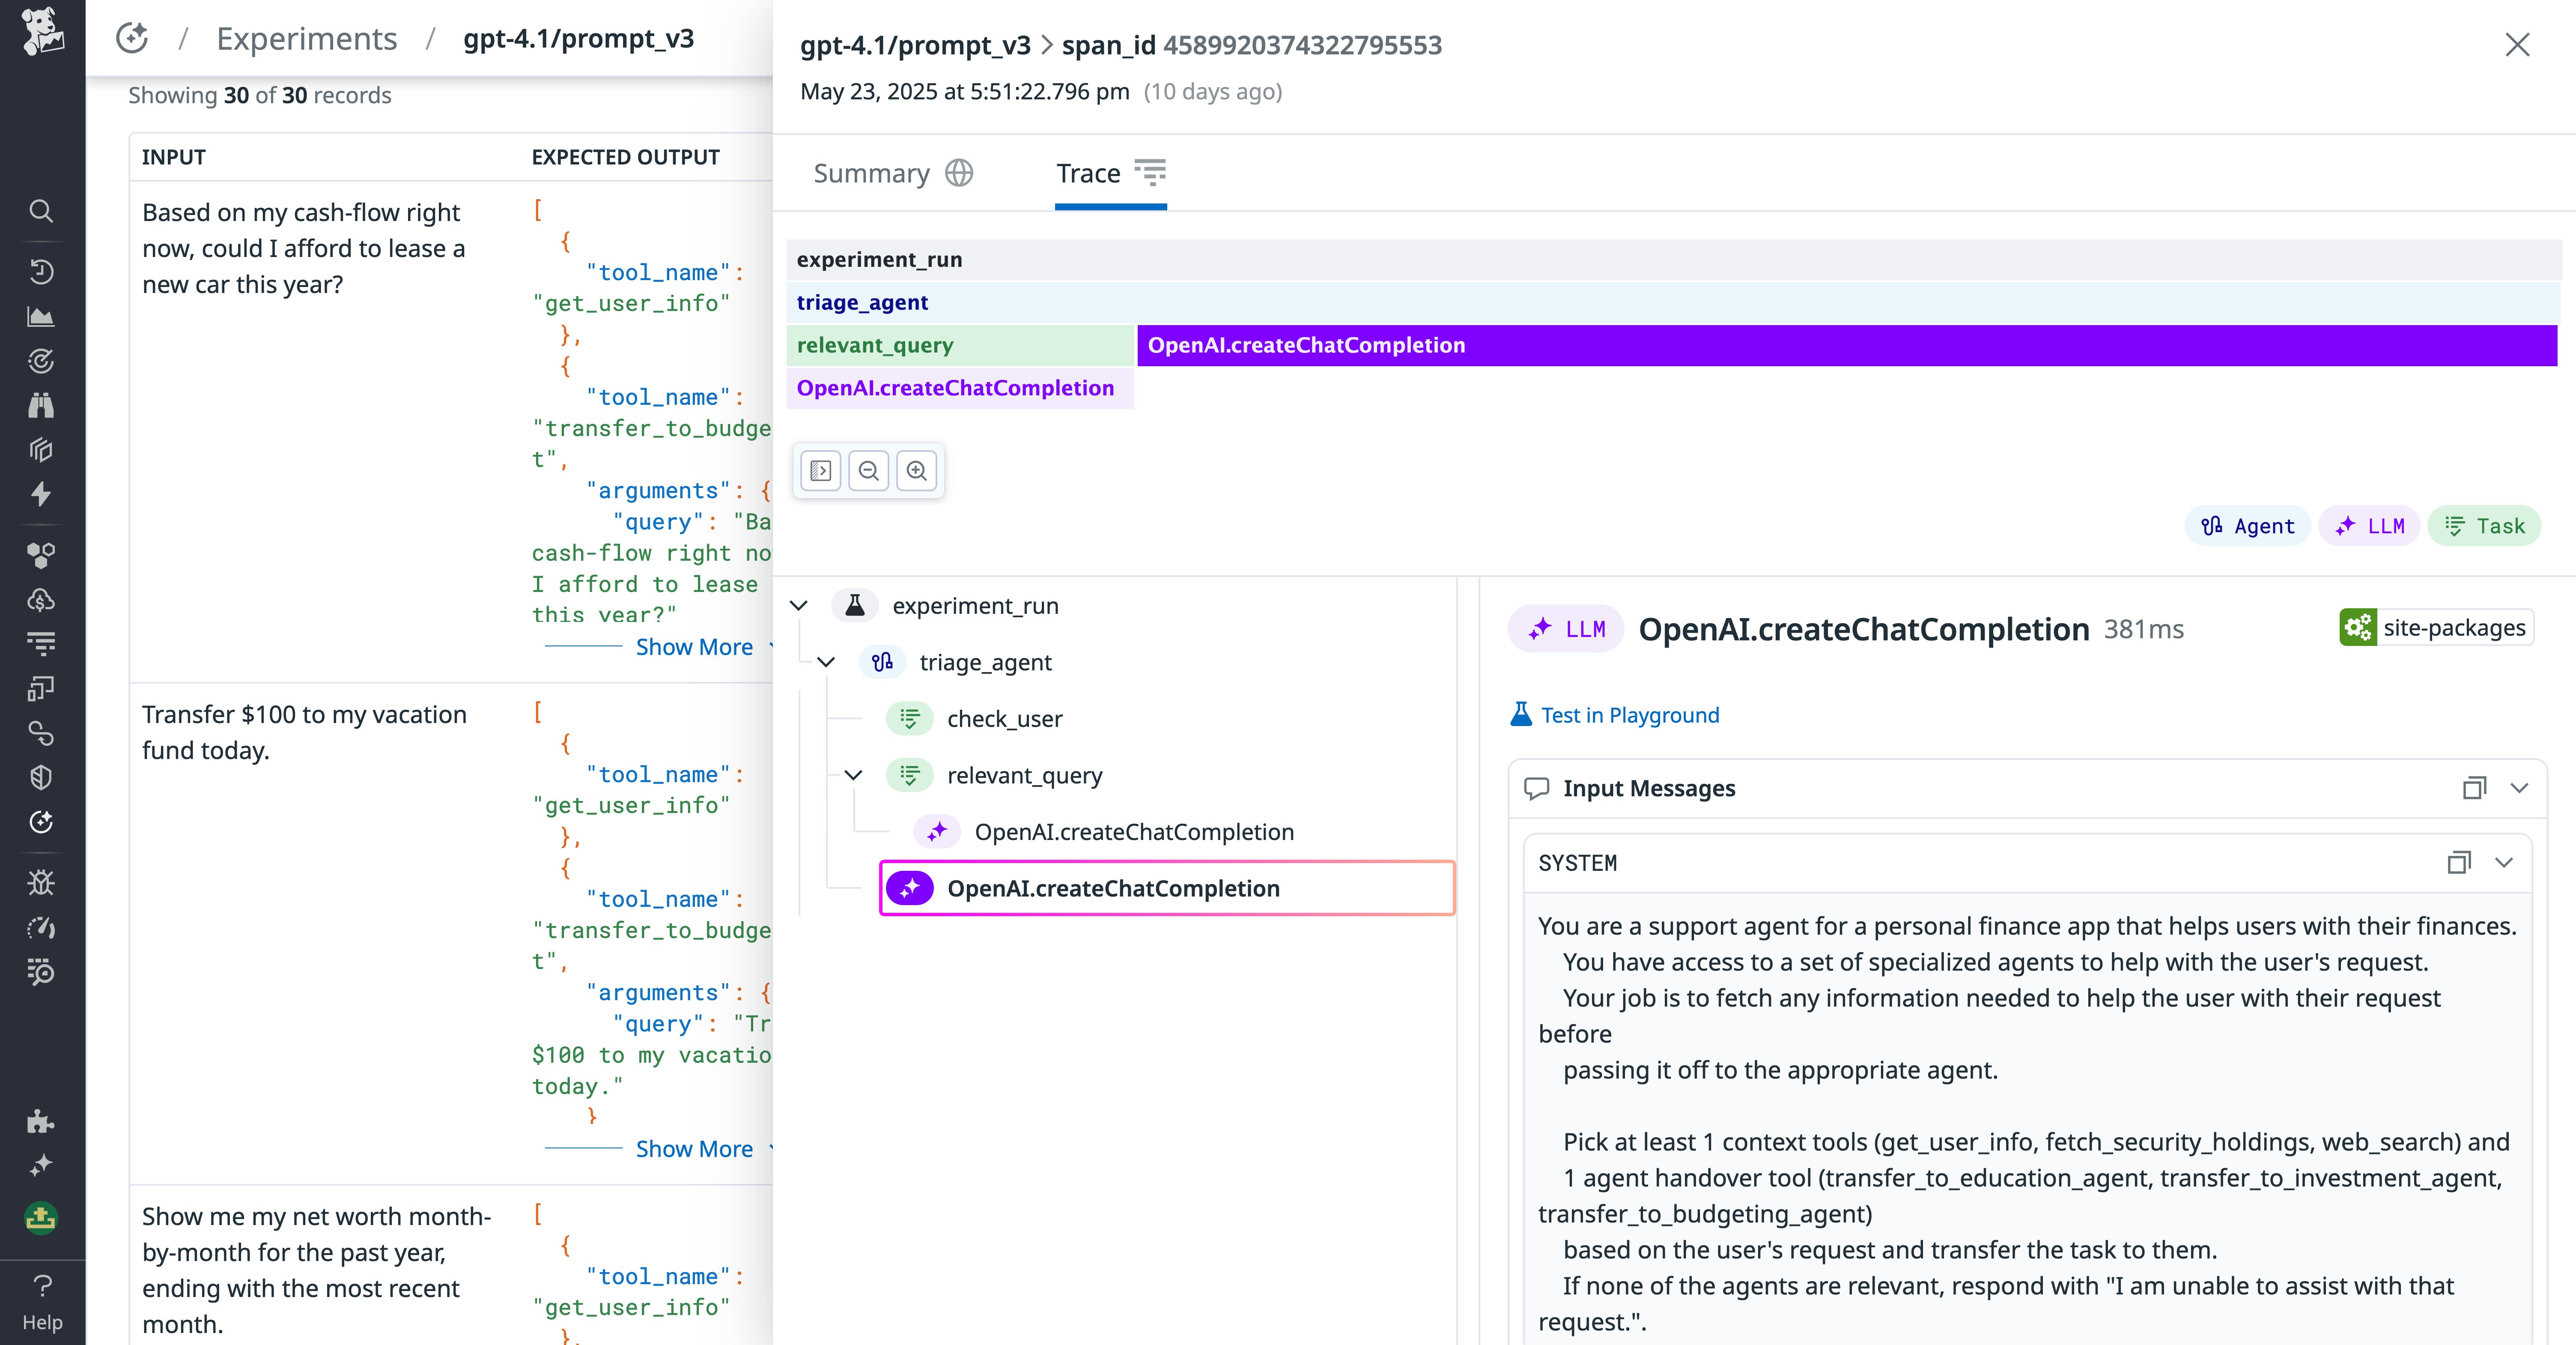
By using the trace tab to view each action taken by the application in an experiment run, you can more easily troubleshoot and interpret the application’s behavior and find ways to improve the output. In this example, we’re looking at the system prompt to see whether it included the correct context.
Compare models to find your application’s best fit
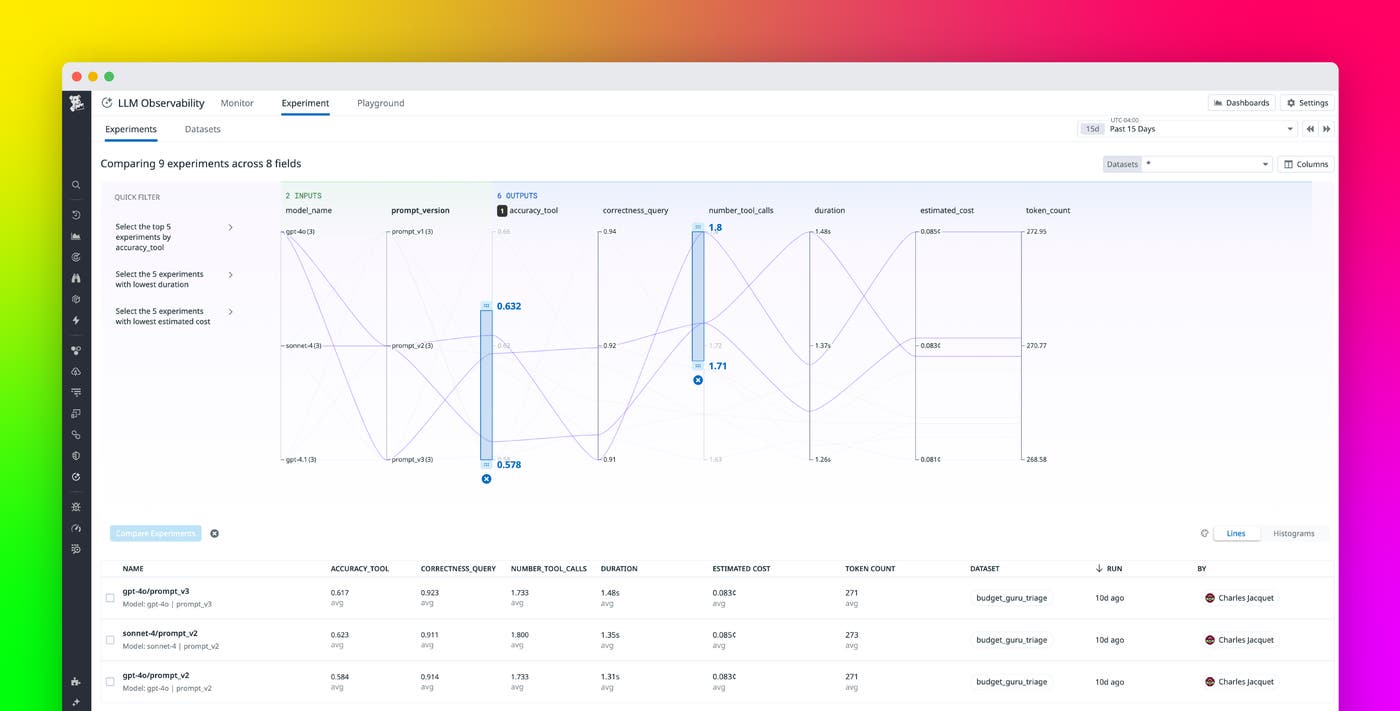
Datadog LLM Experiments enables you to aggregate and track experiments across multiple models so you can determine which one best suits your application’s tasks. The main Experiments view lets you filter and sort your experiments to quickly surface instances of poor evaluation scores, high duration, and other issues. As with the Experiment Details page, you can also use the Distribution Filter to hone in on a subset of experiments with evaluations and performance metrics within certain thresholds.
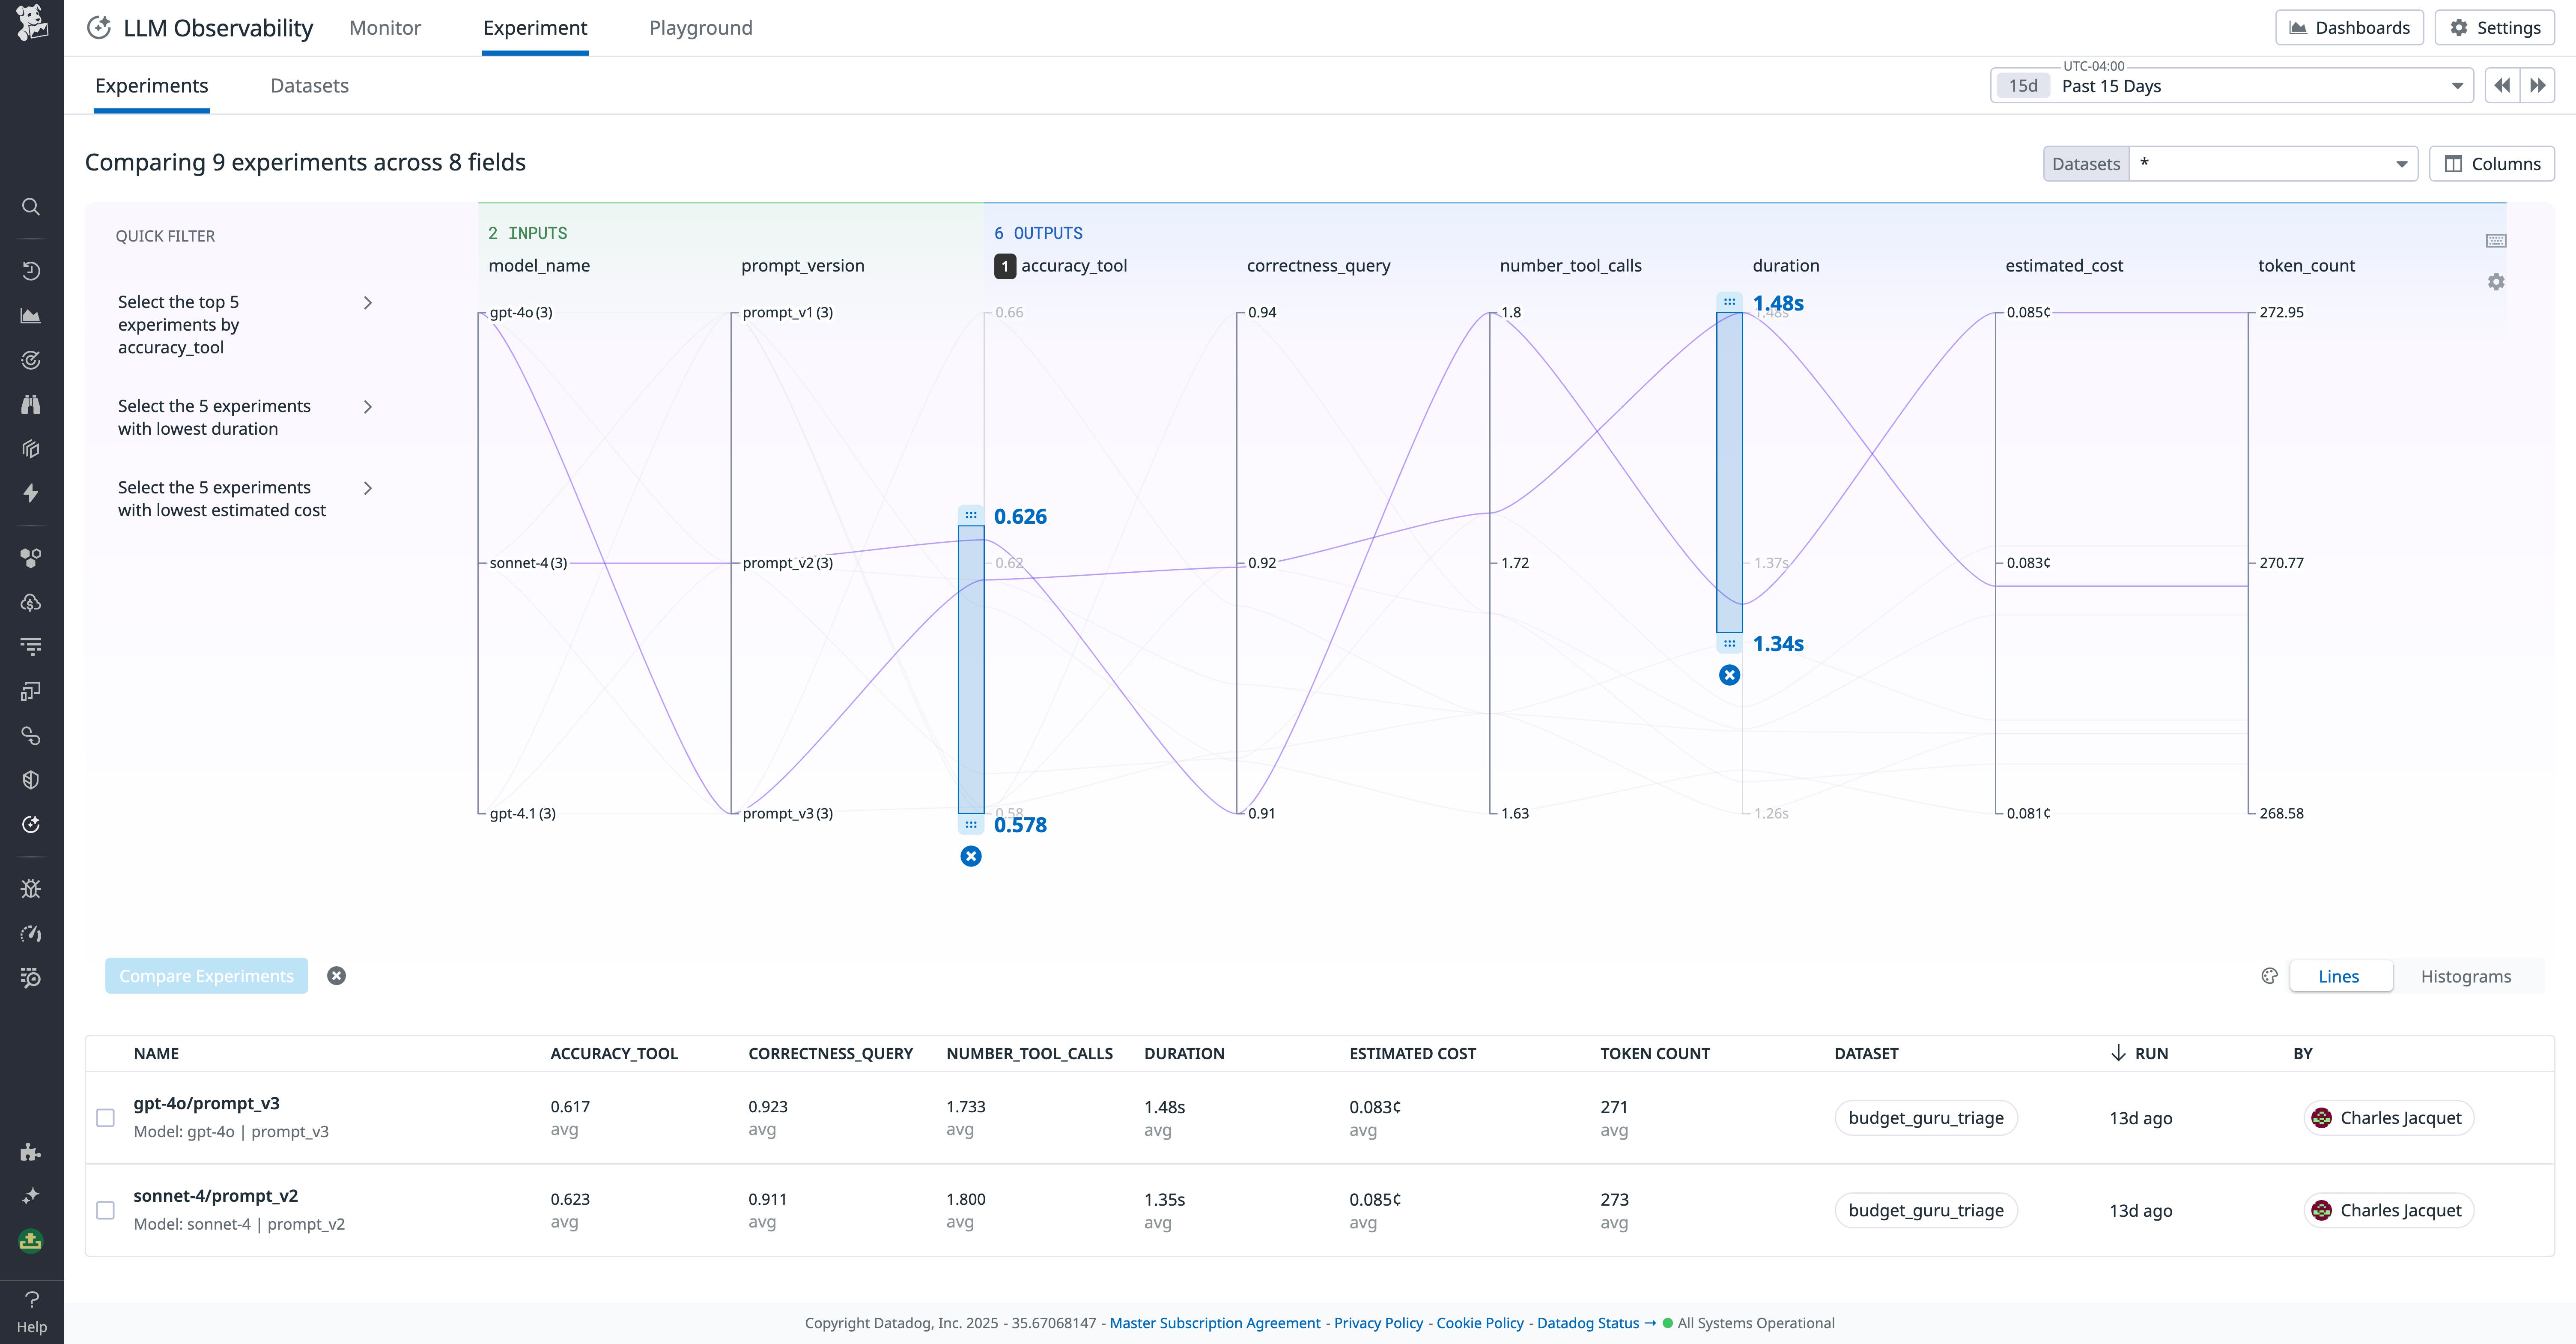
You can then select a group of experiments and compare their results to evaluate application performance across different prompt versions, models, application code versions, and more. For example, let’s say we have an experiment to test the conversational performance of a personal finance AI agent. We’ve run two experiments comparing Claude Sonnet 4 and GPT-4.1. The following screenshot shows a comparison of these runs.
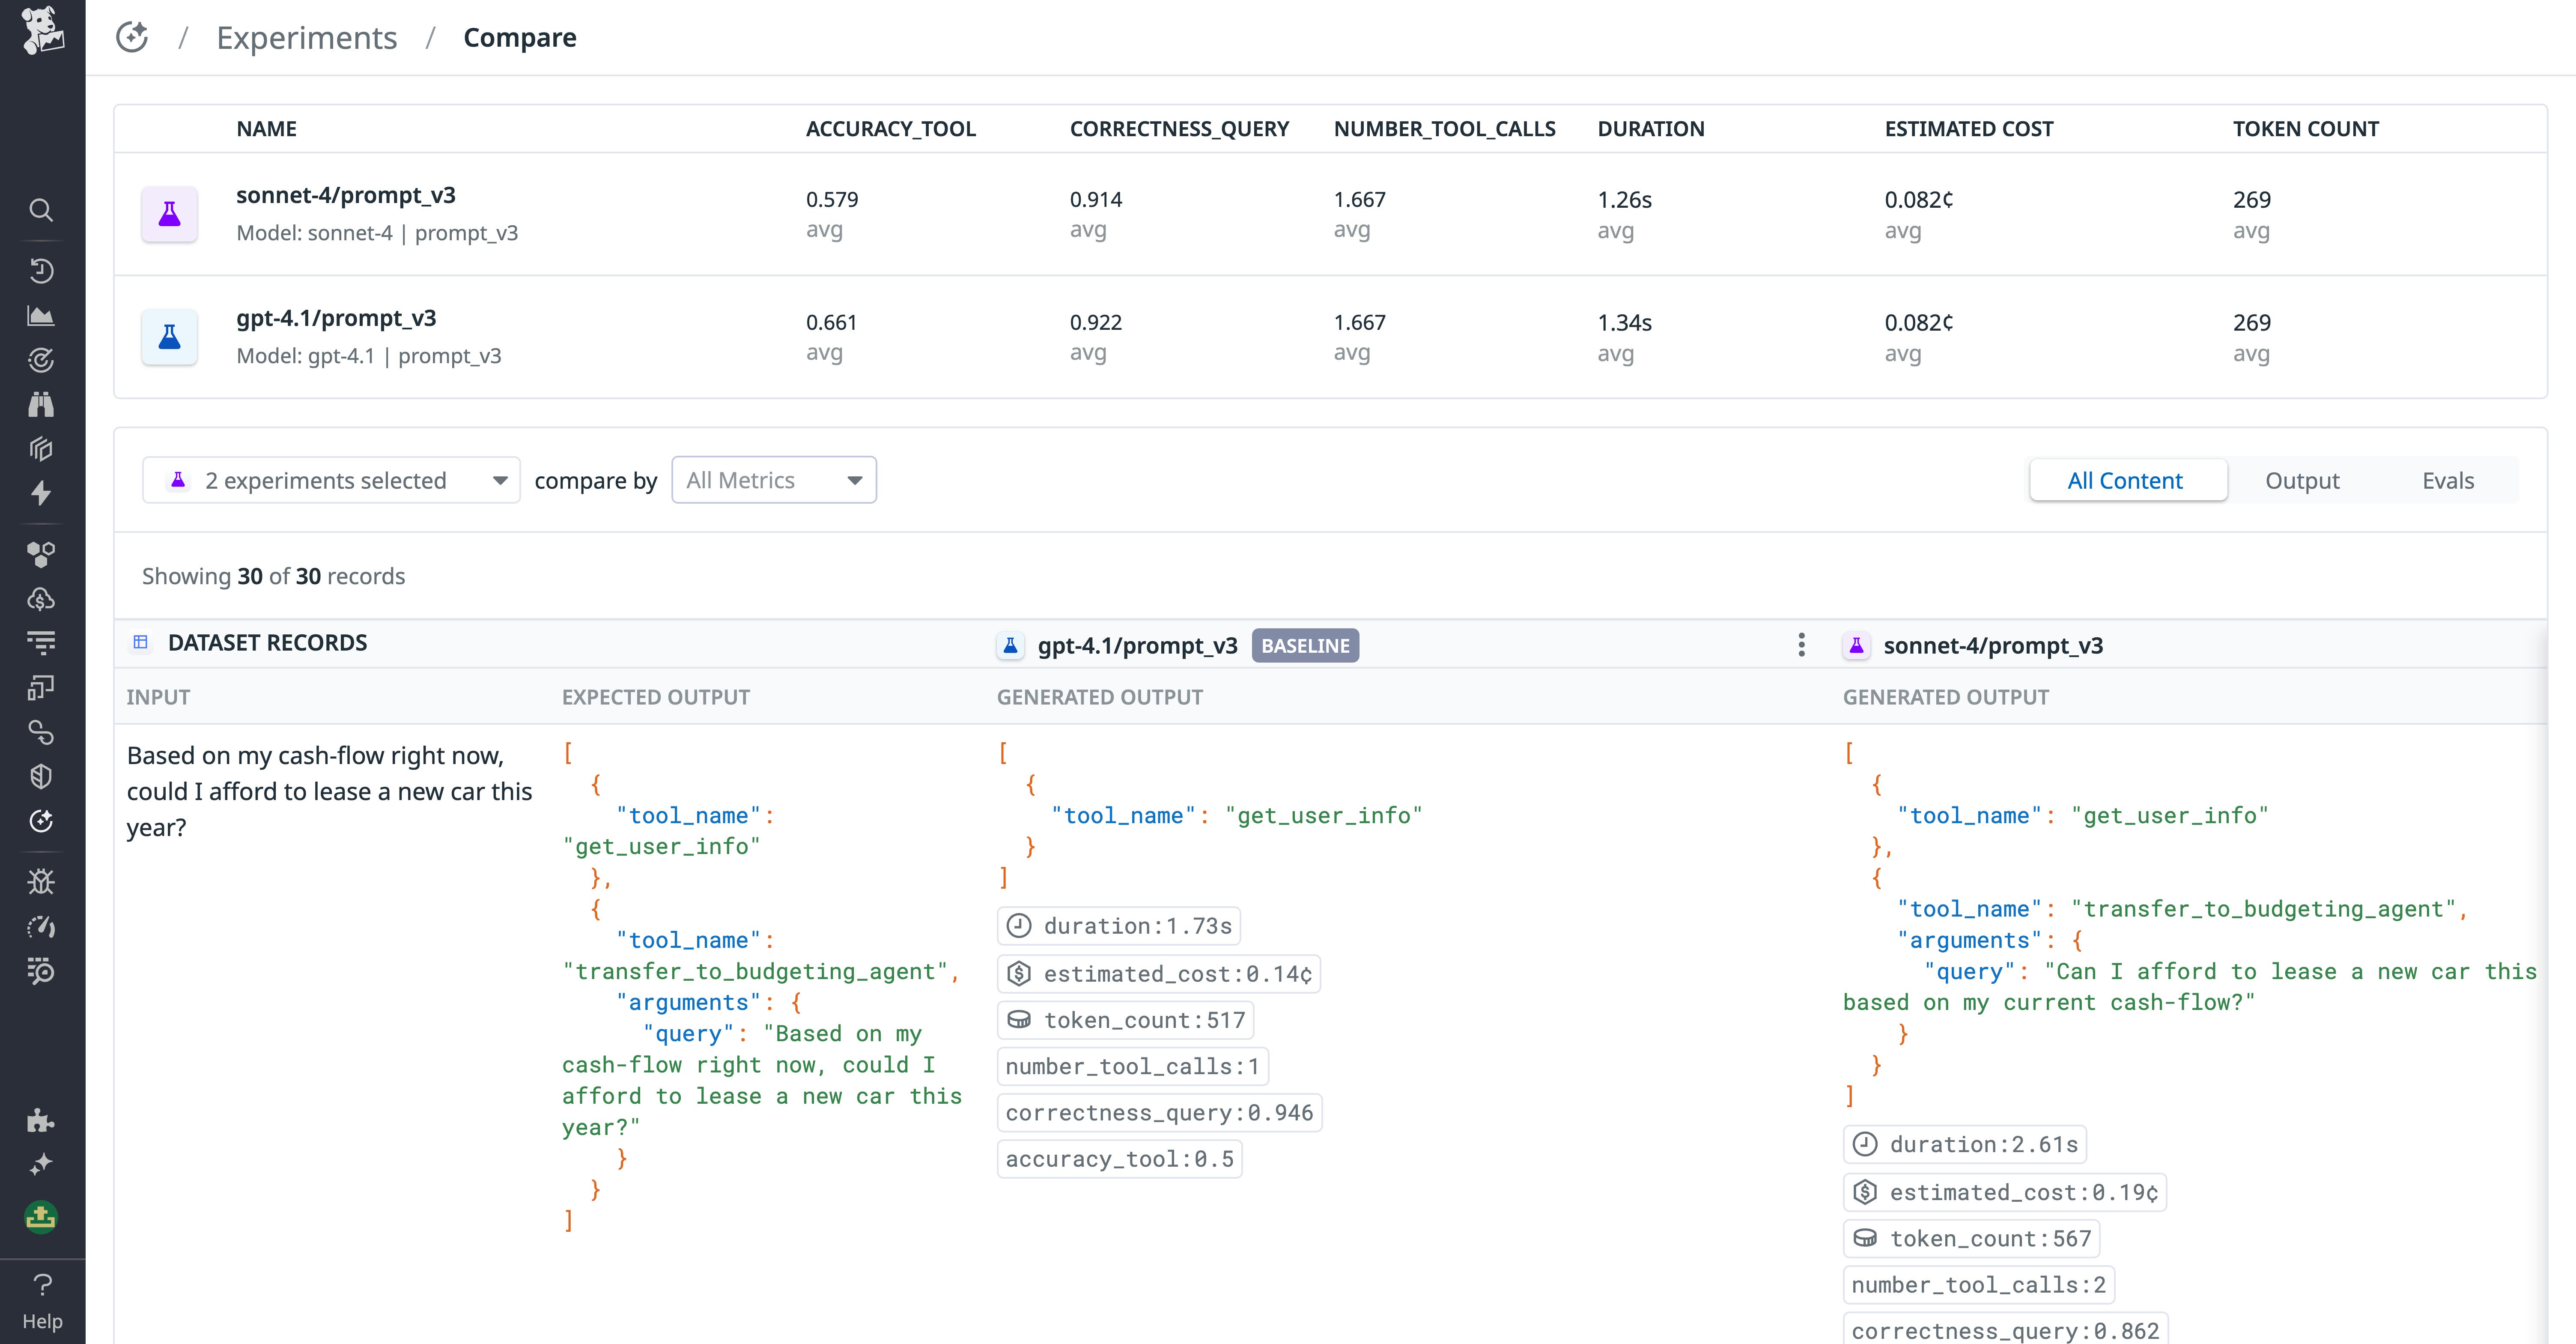
We can quickly glean that the GPT-4.1 agent outperformed the Sonnet 4 agent on the accuracy_tool and correctness_query evaluations. We can also use this view to investigate inputs and outputs for individual experiment runs and spot outliers. For instance, we might find that the Claude application spectacularly outperformed GPT-4.1 on questions that invoke a specific task. We can then investigate further to either optimize this task for Claude or opt to accept the performance tradeoff to run the task with GPT.
By running side-by-side model comparisons in Experiments, you can make informed tradeoffs across accuracy, style, latency, and cost, rather than relying on anecdotal testing.
Investigate model outputs to evaluate task performance
LLM Experiments gives you granular visibility into the output of every LLM call in your experiments. When you want to dive beyond evaluation scores and performance metrics to investigate how your application performs at a given task, you can examine generated outputs within experiments’ dataset records in the Compare page. This helps you understand LLM performance even in cases where it’s difficult to create effective evaluation metrics.
For instance, if you return to the news summarization example, you might see that both models are producing summaries containing the same key information, but using different phrasing and writing styles. By comparing outputs in the experiments’ dataset records, you can manually determine which model produces more natural-sounding, clear, and clean copy.
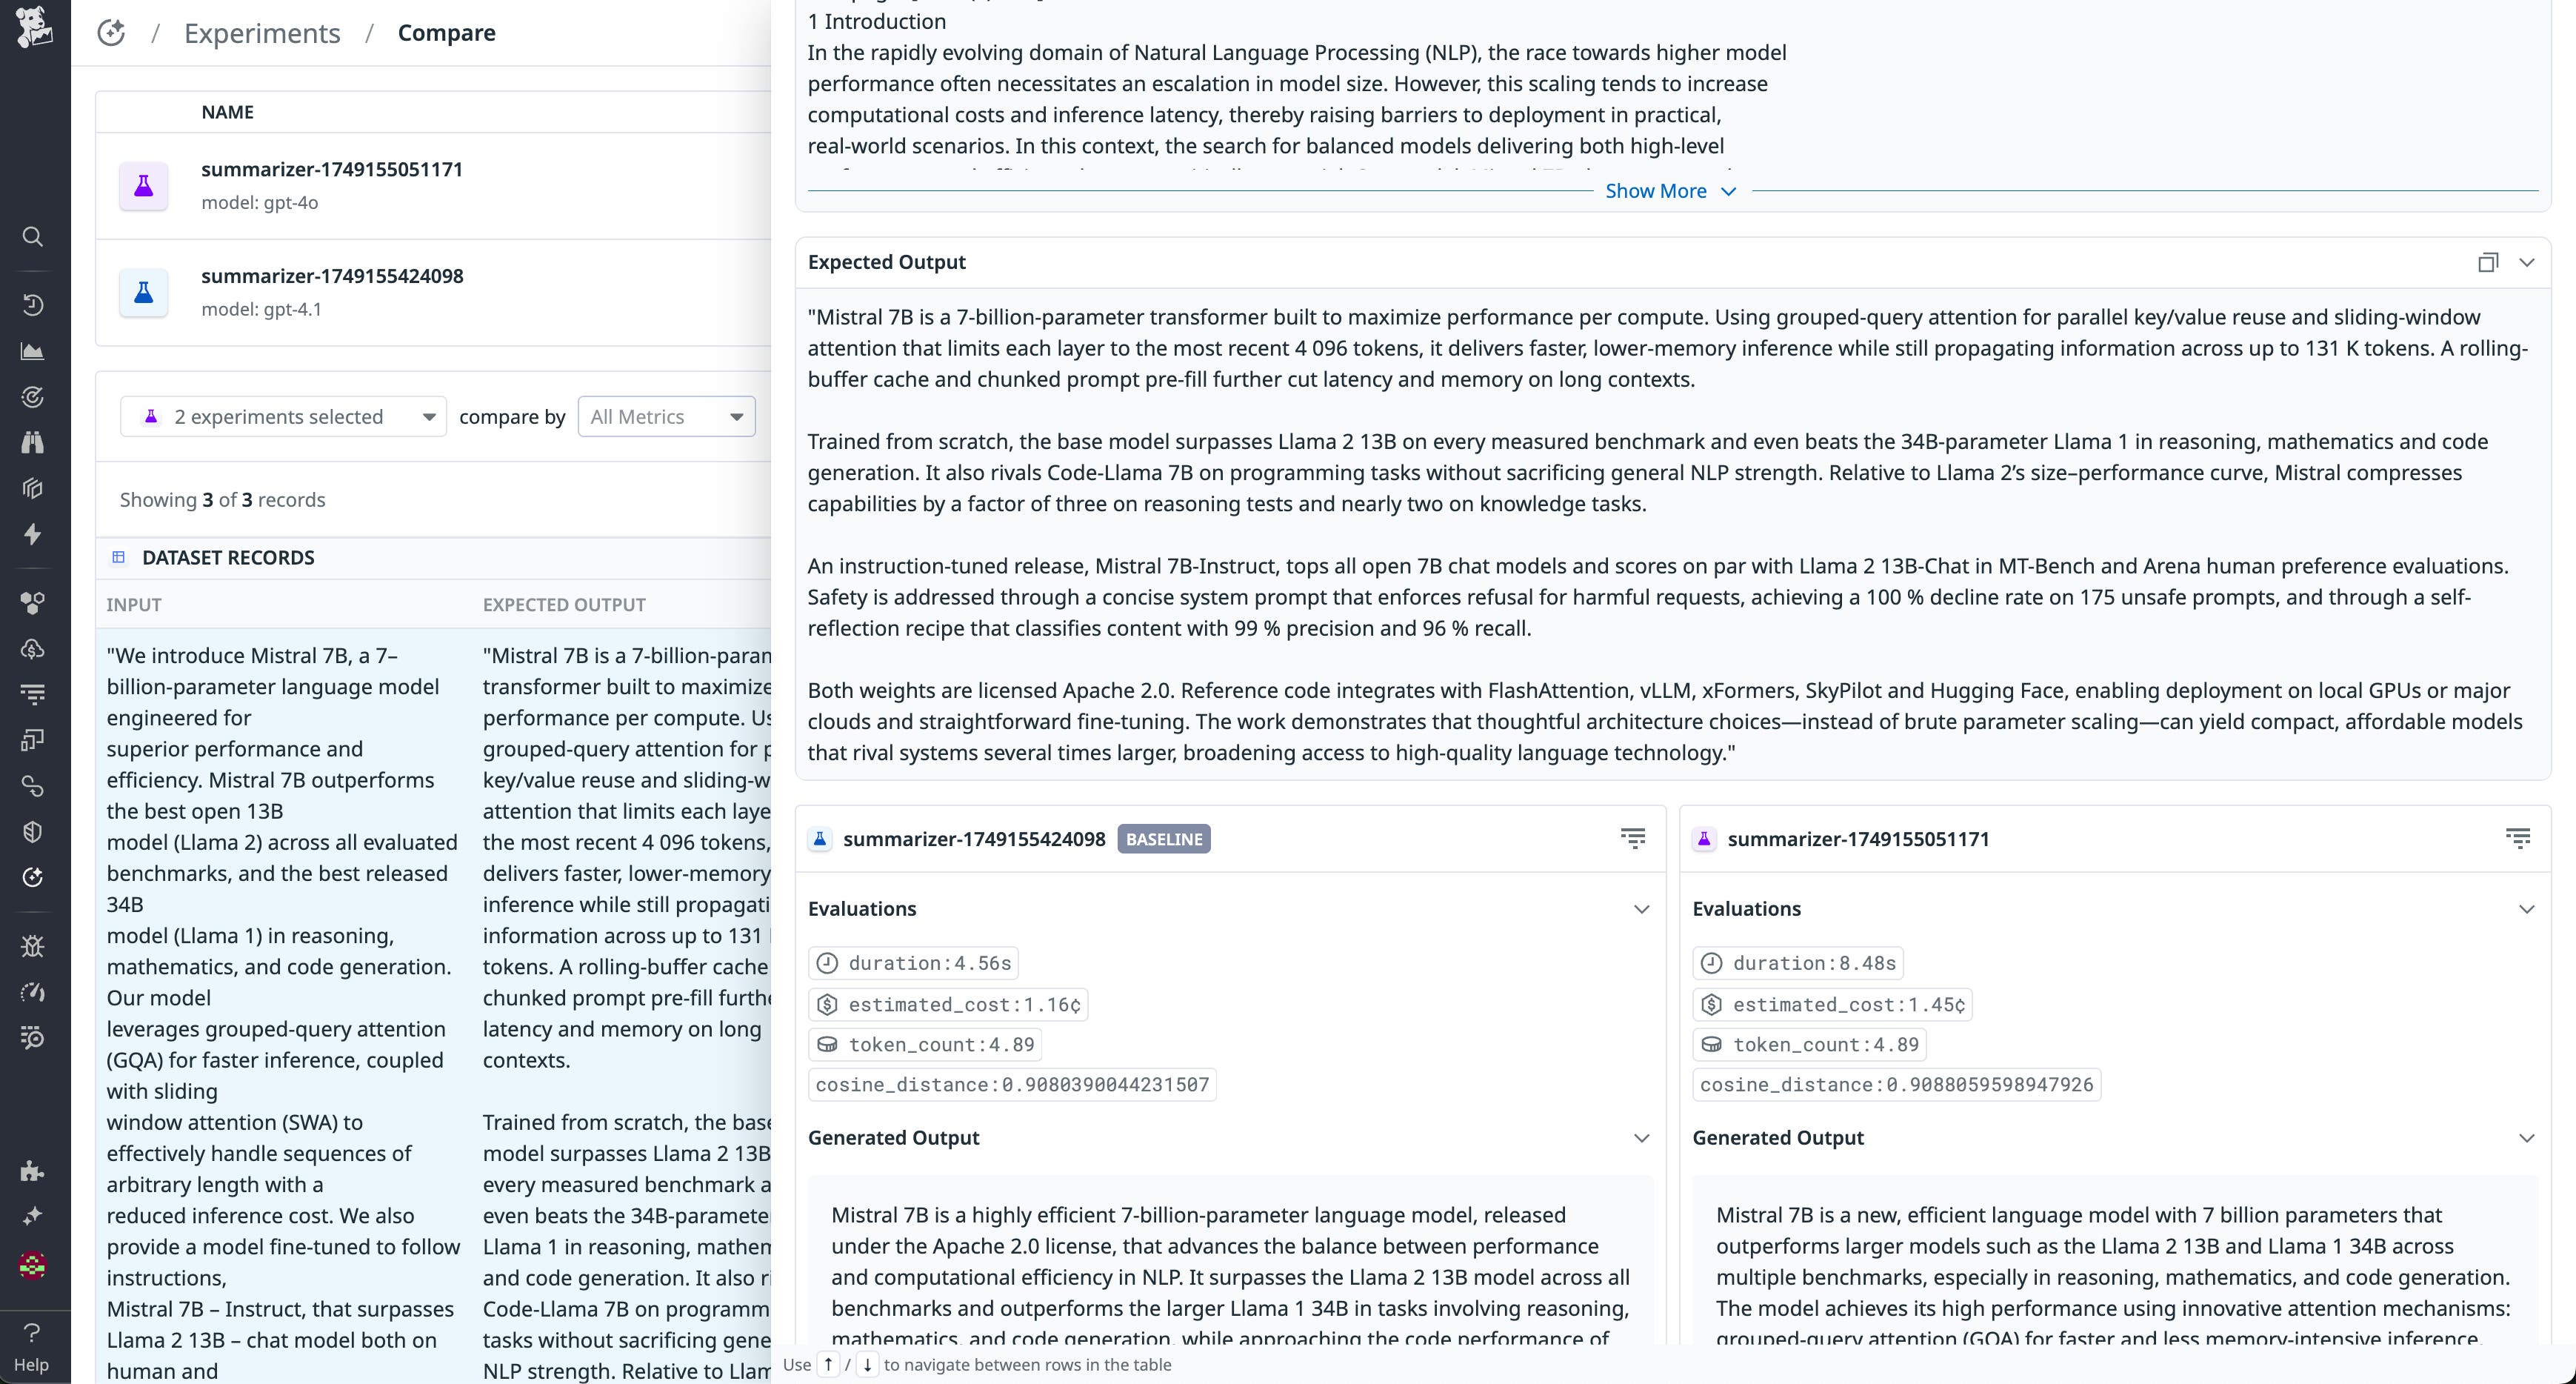
Engineers can also drill down into span-level traces for those outputs to see which prompts, retrieval steps, or tools contributed to the final generation—helping explain why models diverged in phrasing or accuracy.
Get comprehensive visibility into your LLM experiments
LLM experimentation helps you refine model parameters, evaluate features, and better understand how your application might behave when confronted with different forms of input. With Datadog LLM Experiments, you can start with Playground to debug traces, promote improvements into datasets, run structured experiments with full span-level instrumentation, and analyze results across multiple models and configurations. This end-to-end workflow ensures you can identify regressions early, validate improvements systematically, and develop LLM applications faster and with more confidence.
Experiments is currently generally available to all LLM Observability customers. For more information about functional and operational LLM application performance monitoring in production with LLM Observability, see the LLM Observability documentation.
If you’re brand new to Datadog, sign up for a free trial.
