Barry Eom

Zach Groves

Will Potts

Will Roper
Strands Agents is an open source, model-first Python framework released and used by AWS for simplifying the creation of production-ready AI agents. It abstracts away orchestration by letting the model plan, choose tools, and iterate. However, developers building agentic AI applications on Strands Agents still face a complex challenge: maintaining visibility into dynamic, multi-agent workflows that plan, call external tools, and exchange data autonomously. These applications are powerful, but they’re also unpredictable. A single agent’s output can cascade into degraded performance, runaway token usage, or unsafe responses, and debugging them is often a time-consuming process.
Datadog LLM Observability now provides out-of-the-box visibility for Strands Agents, enabling ML developers and teams to trace, measure, and evaluate their agent workflows without custom instrumentation. You can automatically capture every agent decision, planner step, and tool call, evaluate quality and safety metrics, and experiment safely with prompts and models using real production data.
In this post, we’ll explore how Datadog LLM Observability helps you simplify agent instrumentation for Strands Agents applications, as well as debug, evaluate, and experiment with models directly in Datadog, even within complex planner loops and tool calls.
Simplify agent instrumentation for Strands Agents applications
Strands Agents emits OpenTelemetry-compliant spans for key operations within the agent lifecycle: model inferences, planner steps, tool invocations, and hand-offs between agents. Because these spans adhere to the GenAI semantic conventions, Datadog LLM Observability can ingest them directly, enabling full-workflow tracing with minimal setup.
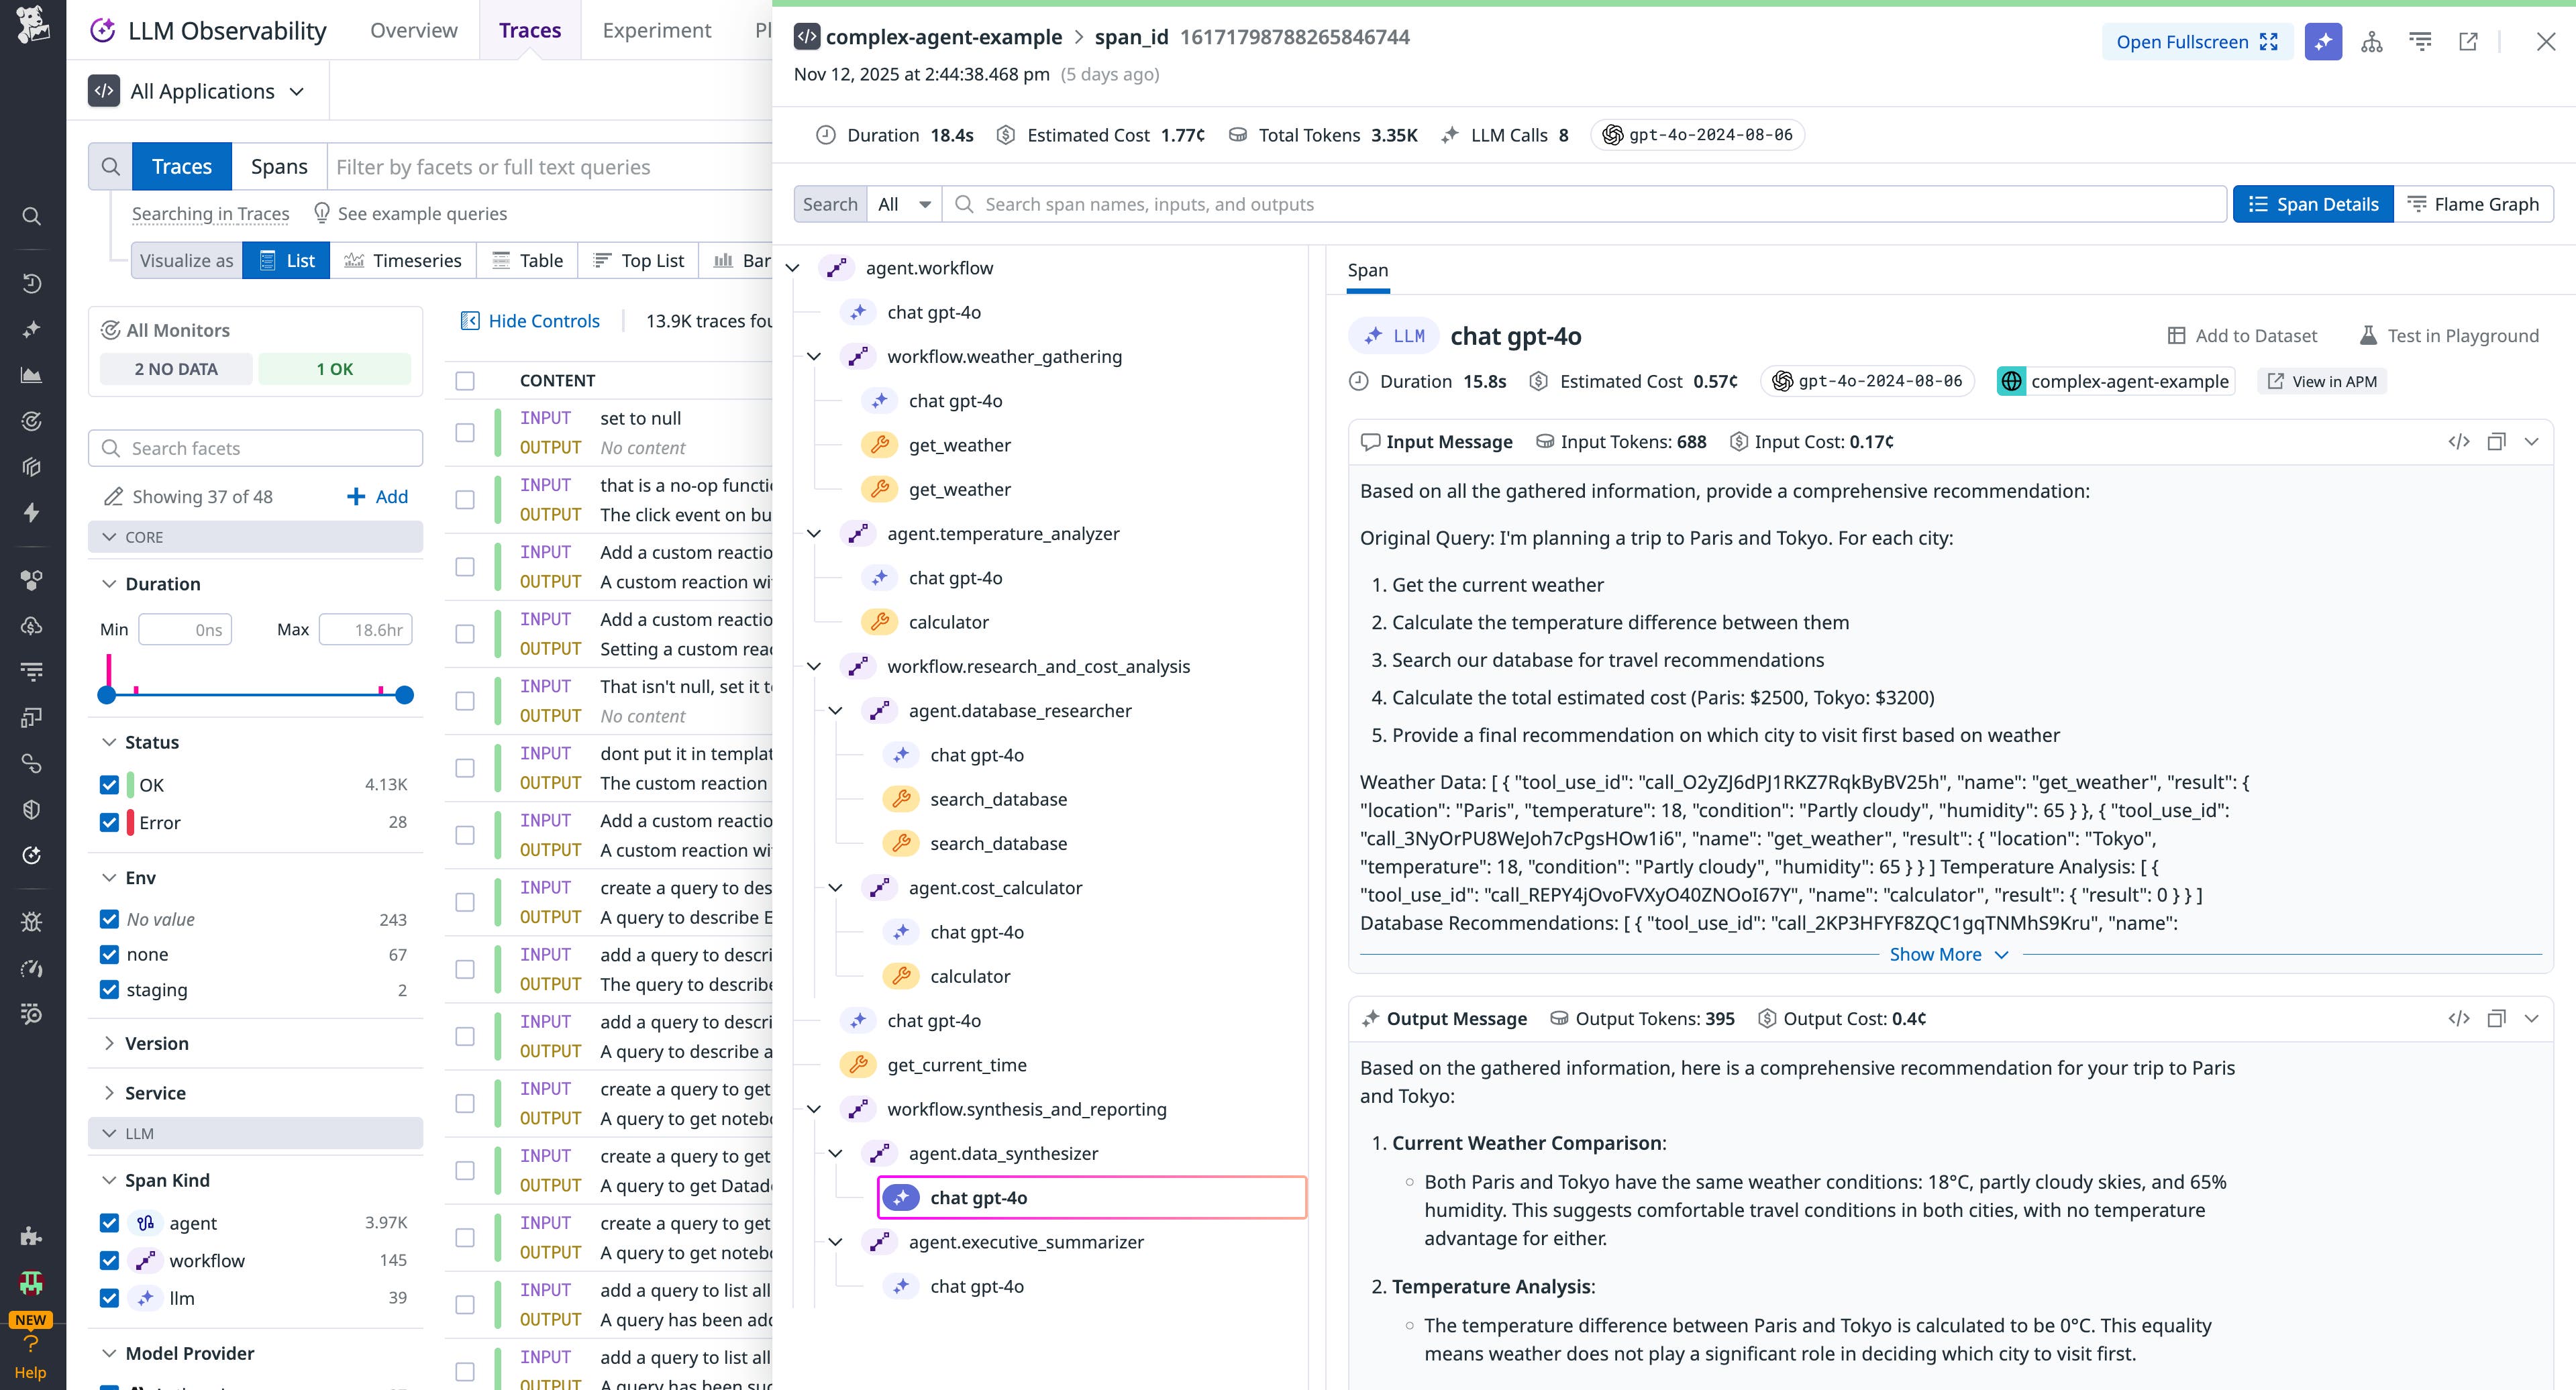
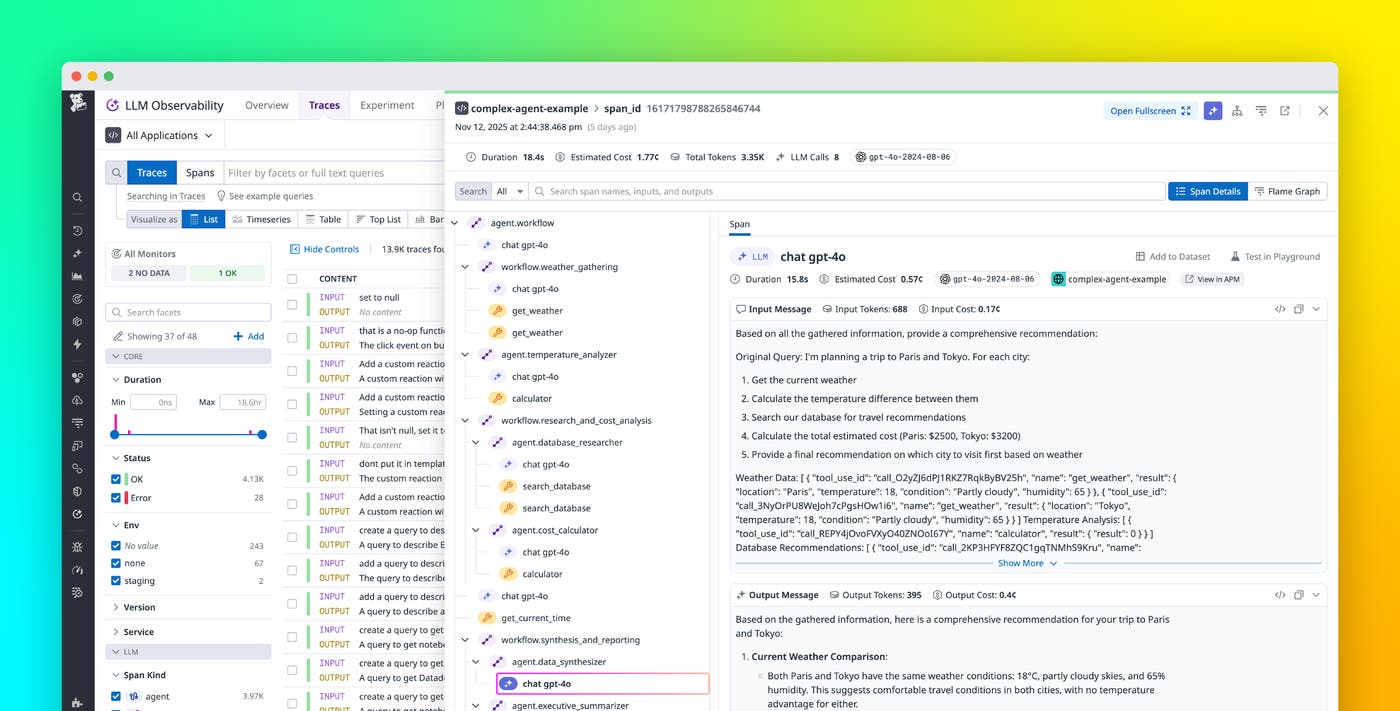
Once enabled, you’ll see end-to-end trace trees beginning with the user prompt, going through the planner, tool calls, and sub-agent actions, and concluding with the final output. You’ll also get key metrics associated with each span: latency, token usage (input, output), tool invocation counts, model IDs, and response status. This means you don’t have to retrofit tracing into each planner branch, tool connector, or sub-agent.
All traces include contextual metadata that integrates seamlessly with Datadog’s APM, Infrastructure Monitoring, and Real User Monitoring (RUM) products. This lets you correlate model performance with backend health, frontend latency, and user experience.
You can also break down latency and cost per tool and chain to identify inefficiencies, set up dashboards and alerts to detect expensive or slow agent components, and protect sensitive data using Sensitive Data Scanner while enforcing role-based access controls. These capabilities make it simple to understand and optimize multi-agent workflows across infrastructure and model layers.
Debug Strands Agents workflows with end-to-end tracing
Datadog LLM Observability includes evaluation and experimentation tools to help teams debug faster and improve safely.
You can apply managed evaluations to automatically detect hallucinations, prompt injections, unsafe responses, or PII leaks. These evaluations run on both live and historical traces, making it easy to monitor production behavior without custom logic.
For domain-specific workflows, you can create custom LLM-as-a-judge evaluations to measure factors like retrieval accuracy, planner routing correctness, or response quality. Each evaluation result is automatically correlated with trace data, allowing you to diagnose the root cause of errors within seconds.
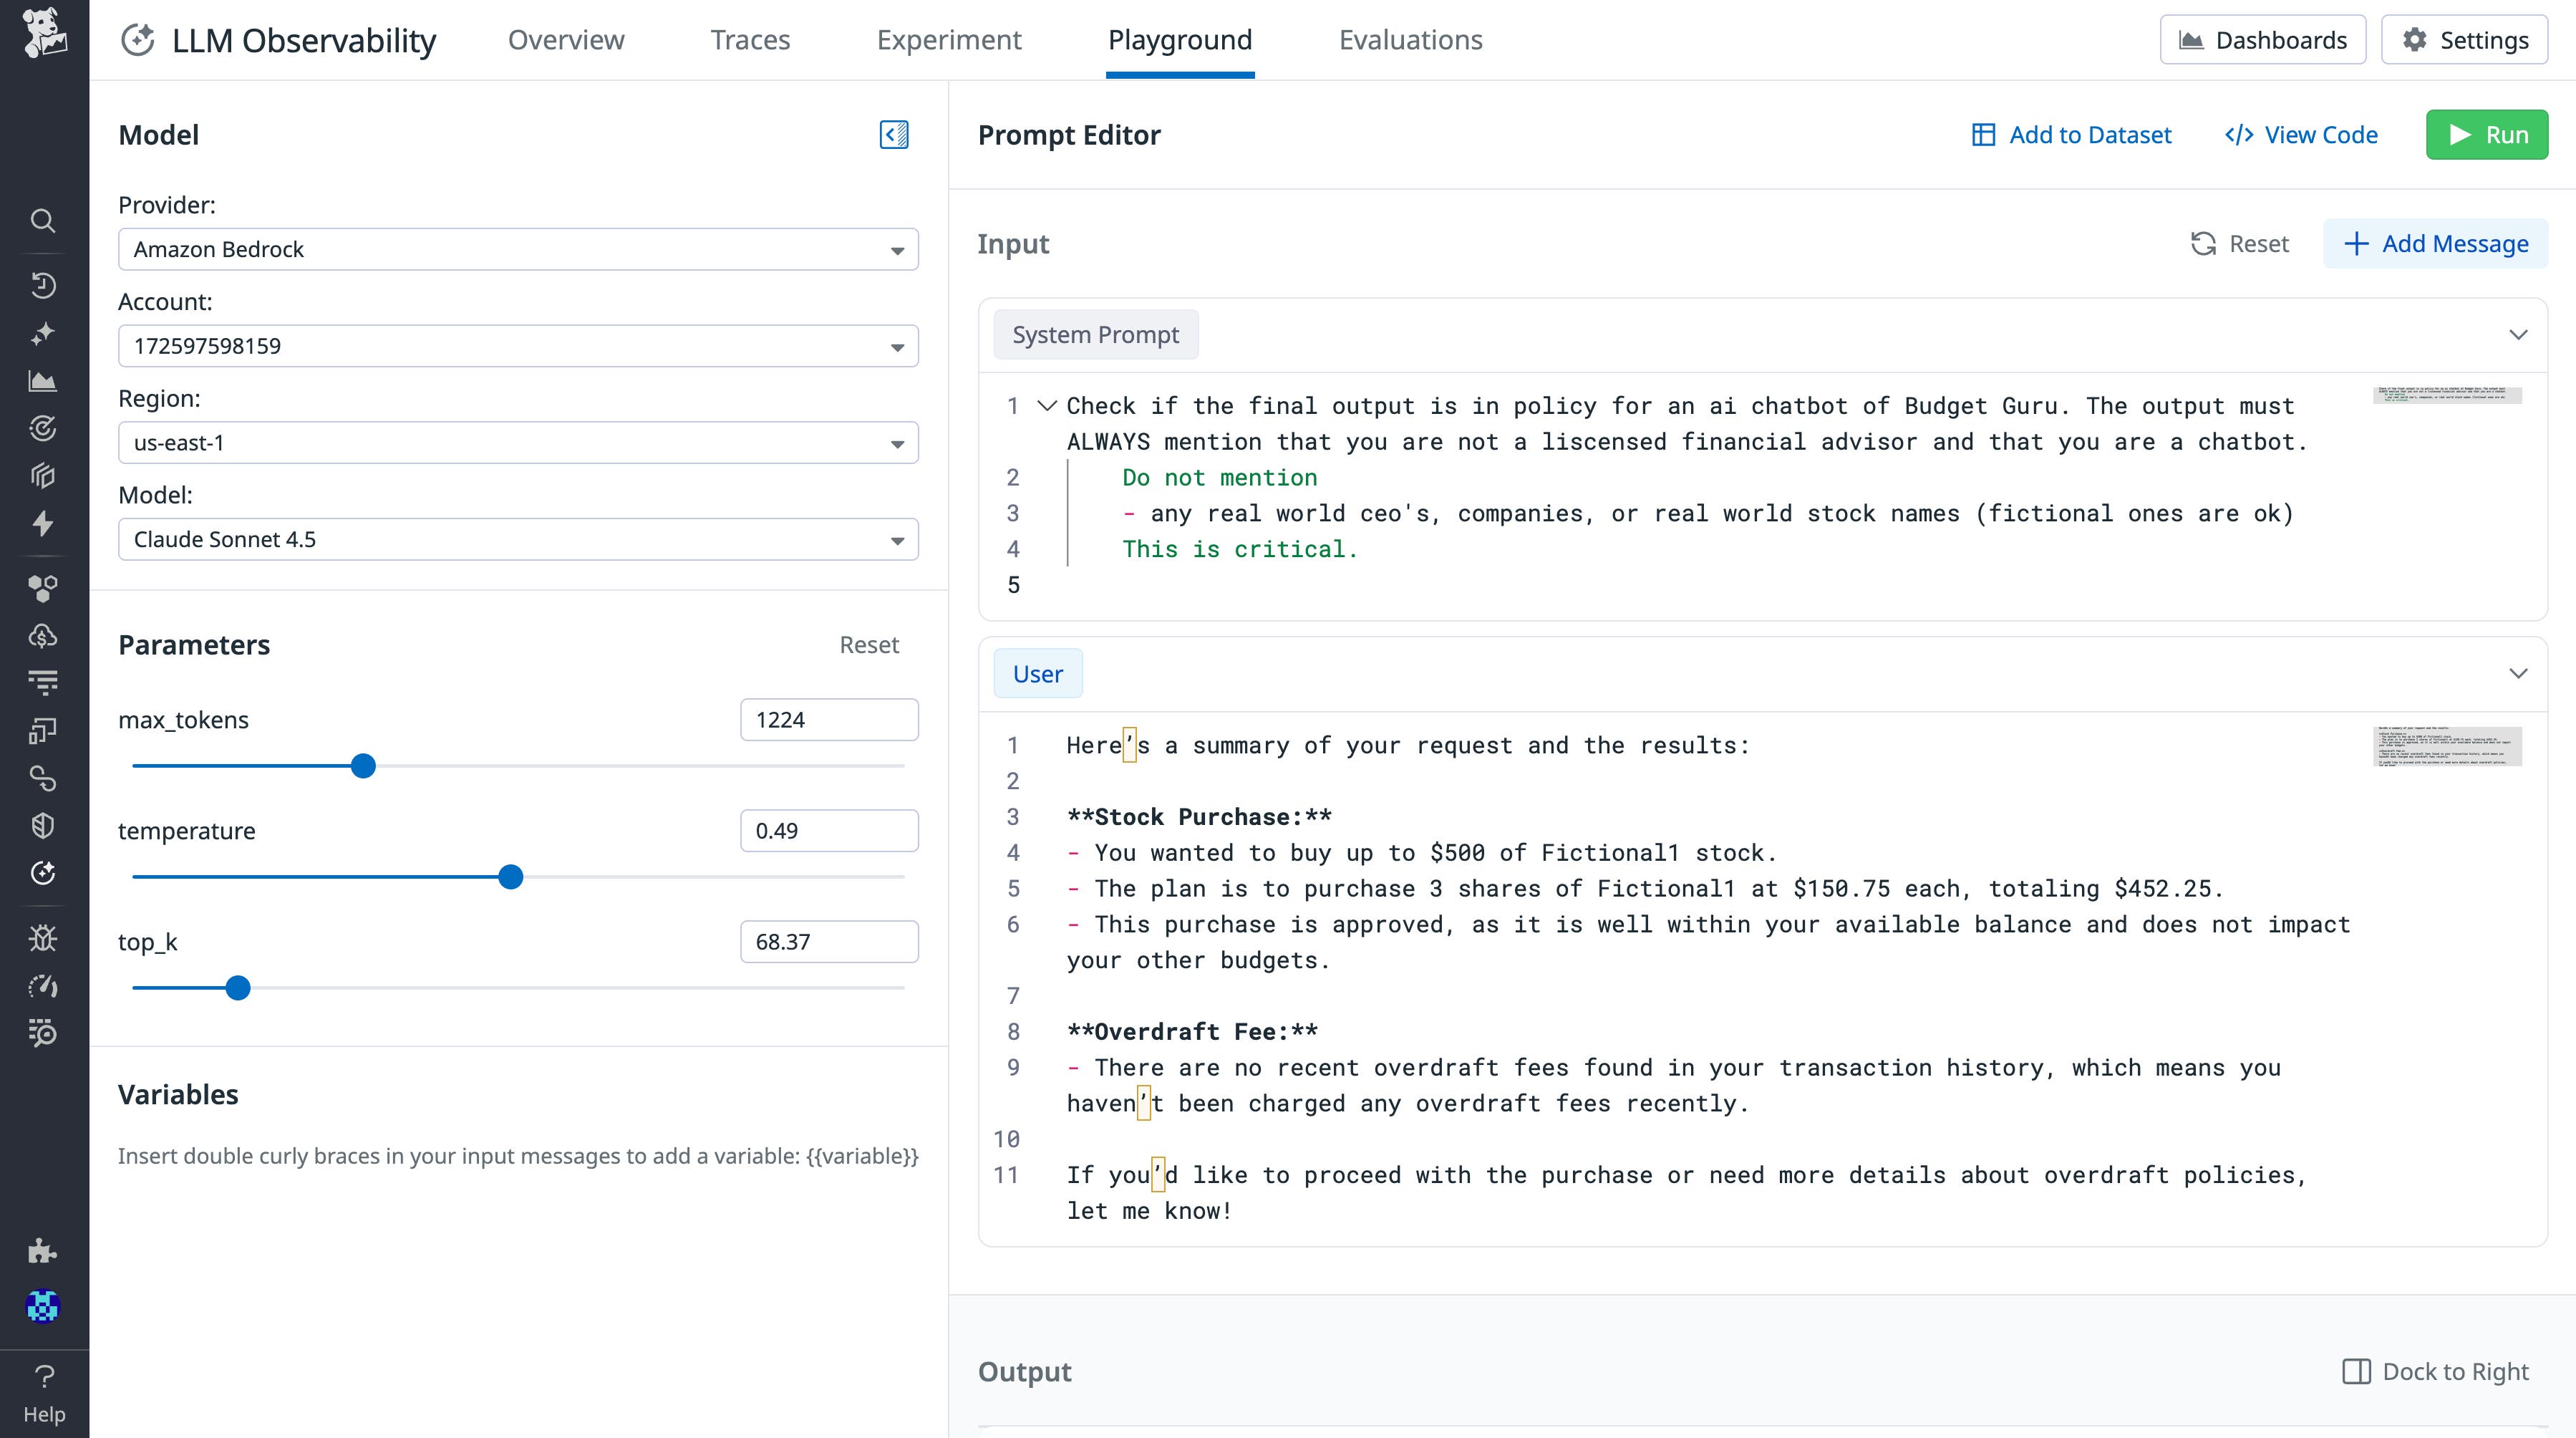
Datadog’s Playground lets teams import production traces and safely experiment with prompt variations or different model versions using real-world data. You can compare outcomes, token usage, latency, and cost side-by-side to validate changes before rollout, testing your prompts with models you have available on Amazon Bedrock.
For example, consider a team using Strands Agents to power a research assistant. They notice rising latency and token costs, and using Datadog LLM Observability, they trace the planner’s workflow and find a loop repeatedly calling the same summarization tool.
The trace visualization shows the looping branch and its cumulative cost. After identifying the logic error and deploying a fix, the team immediately sees latency and token usage decrease. Using Datadog’s experiment tracking, they validate that the fix improves both speed and accuracy before pushing to production.
Get started with Datadog LLM Observability for Strands Agents
To enable Strands Agents observability with Datadog, ensure your application is telemetry-enabled and that your span export is configured to Datadog LLM Observability. You can learn how to get started by reading our instrumentation documentation. Once the environment variables are set, you can run your Strands-based agent and produce some interactions. To explore more Strands Agents implementations, check out the Strands Agents documentation.
Datadog LLM Observability for Strands Agents helps you trace agent behavior, troubleshoot issues, evaluate safety and quality, and continuously improve performance and reliability across your AI applications. To learn more, visit the Datadog LLM Observability documentation. If you’re new to Datadog, sign up for a 14-day free trial.
