Danny Driscoll
For many Kubernetes workloads, scaling on CPU and memory utilization provides an effective way to balance cost efficiency and performance. However, some applications, such as consumer or worker services downstream of messaging systems or data pipelines, aren’t bound by CPU or memory. For these workloads, scaling on application-specific metrics can help improve reliability, responsiveness, and cost outcomes.
With Datadog Kubernetes Autoscaling, you can now scale workloads based on any integration metrics or custom metrics collected in Datadog, not just CPU or memory metrics. Custom Query Scaling provides a way to define scaling rules using the metrics that matter for your workloads, which can help you tune scaling behavior more effectively. In this post, we’ll explore how Custom Query Scaling helps you:
- Use any Datadog metric to scale Kubernetes workloads
- Create custom queries to define precise scaling policies
- Scale on application metrics without managing extra cluster components
Use any Datadog metric to scale Kubernetes workloads
The integration metrics and custom metrics you bring into Datadog are the foundation of your visibility into application and infrastructure performance. Now, Datadog Kubernetes Autoscaling lets you use those metrics to define scaling configurations that automatically manage capacity based on application demand and performance. By scaling your workloads based on real activity rather than simple resource utilization, you can improve responsiveness and more efficiently allocate resources in your environment.
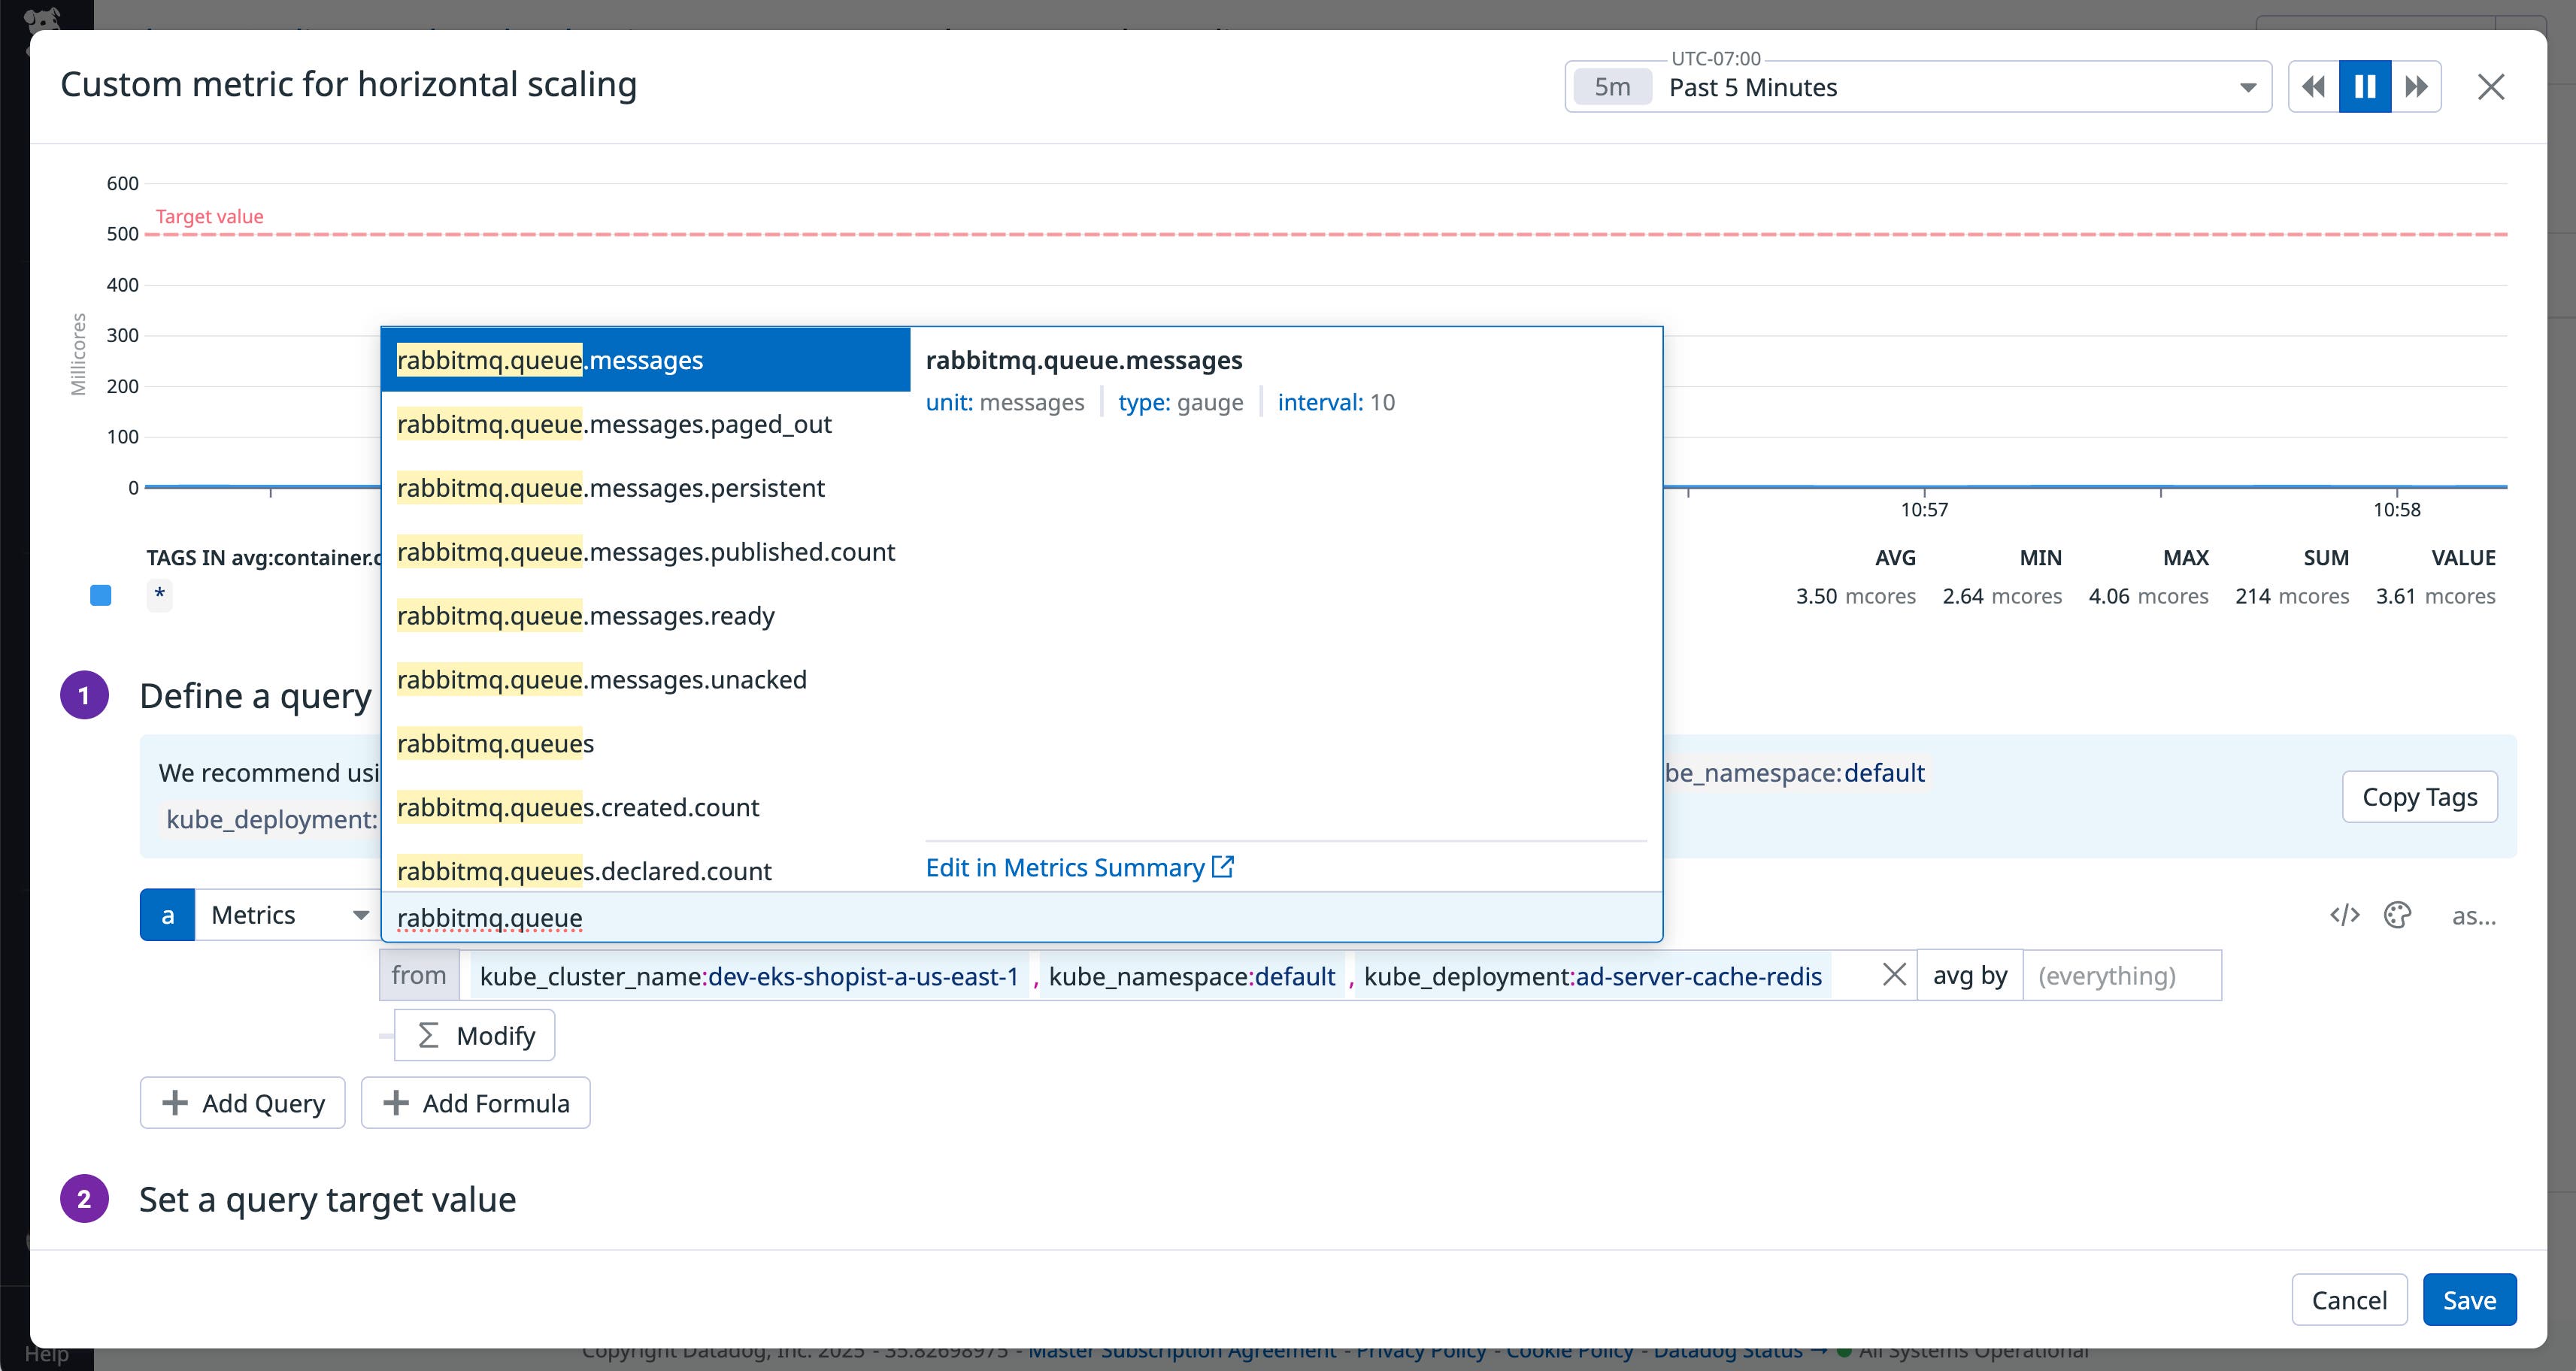
For services consuming from messaging systems like RabbitMQ or Kafka, CPU utilization can be a poor signal for scaling because it doesn’t reflect message throughput or latency. Scaling decisions based solely on CPU often miss the real workload patterns, so instead you can use Datadog integration metrics such as rabbitmq.queue.messages and kafka.request.channel.queue.size.

Application metrics can also enable more effective scaling in cases where you’ve determined a maximum allowable request rate. For example, to add NGINX replicas as traffic to your web application increases, you can use the HTTP request rate as a trigger (via the Datadog integration metric nginx.net.request_per_s).
Create custom queries to define precise scaling policies
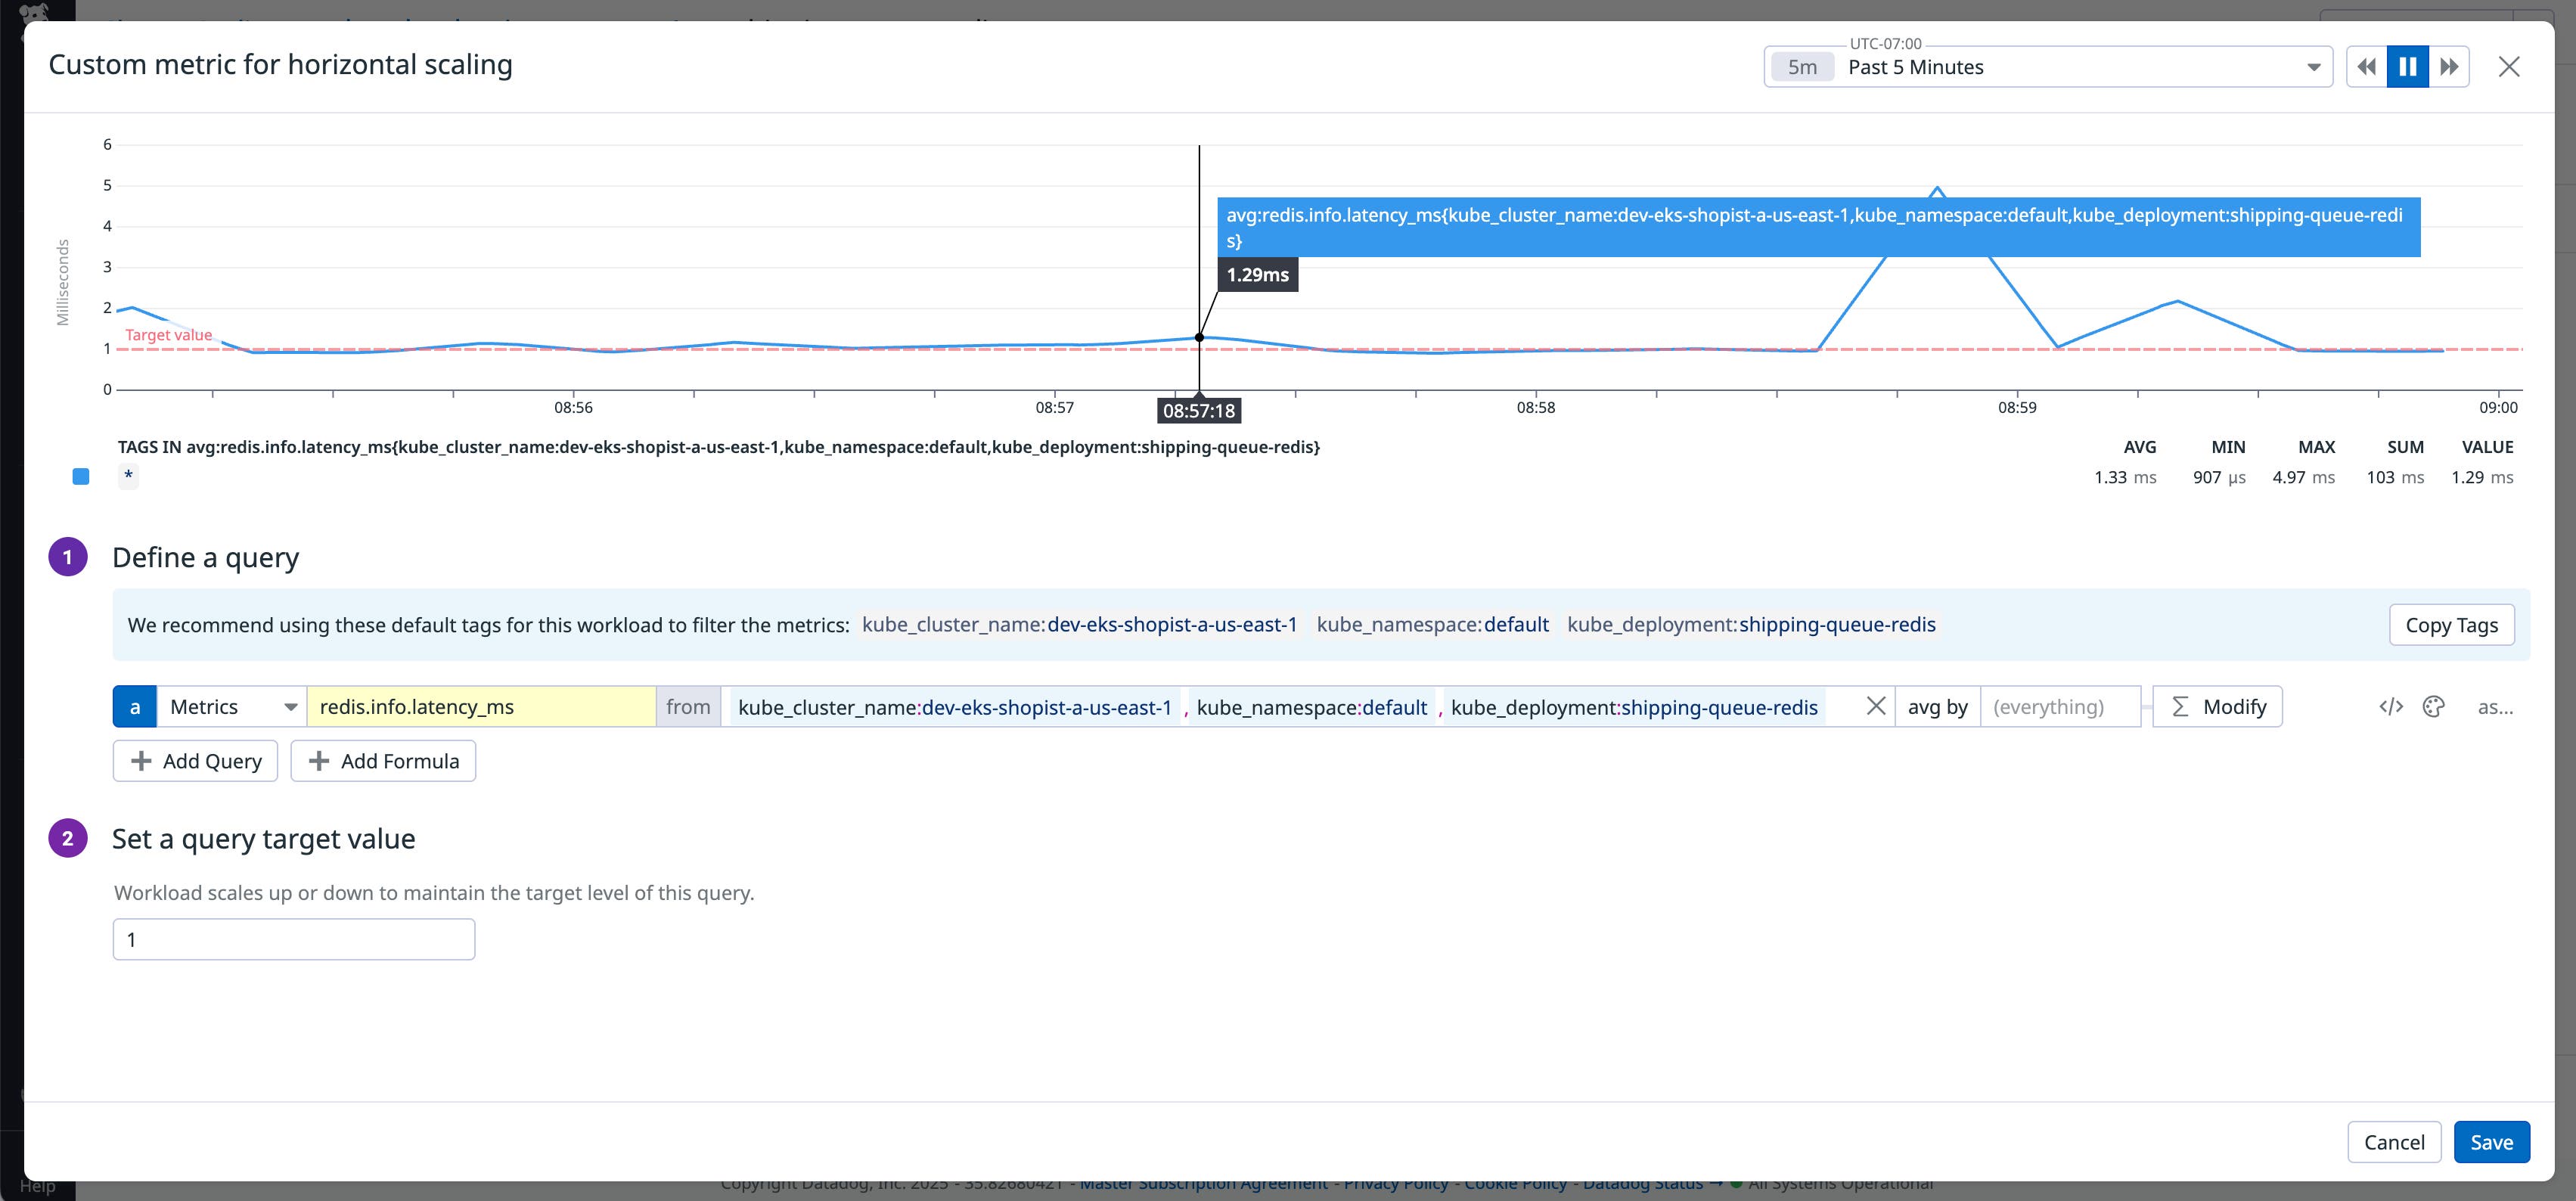
Once you’ve chosen the metric for your scaling configuration, you can use the built-in query editor to define the autoscaling policy. The query builder will suggest tags based on your selected workload to scope the query to the relevant segment of your environment. You can choose how to aggregate the metric over time (for example, as an average or a sum), and then define how to aggregate it across sources like containers or services. Finally, specify a target value, the threshold your autoscaler will use to trigger scaling actions.
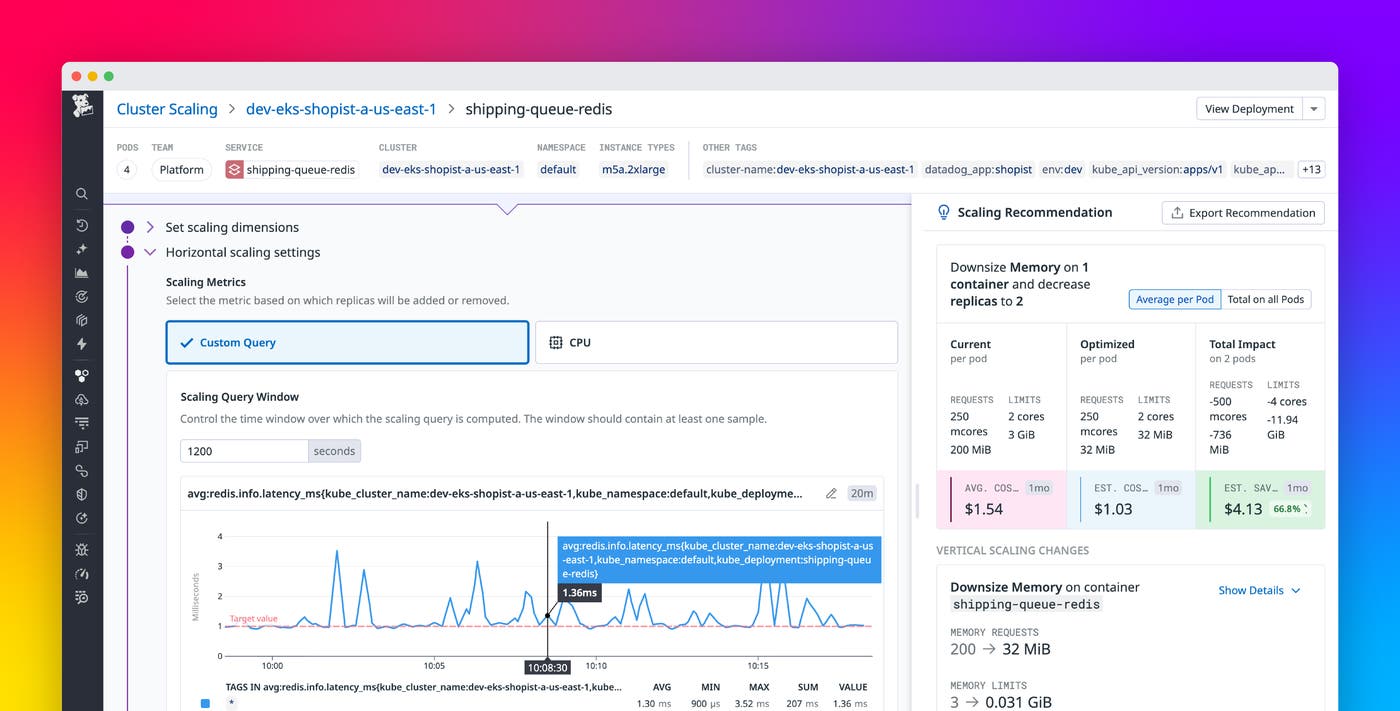
The following screenshot illustrates the custom query builder. The editor displays a graph of recent workload activity, comparing the metric’s behavior against your target value. As you revise your rule’s definition, you’ll gain immediate insight into how your autoscaler would have responded under real conditions. This helps you quickly identify the most effective scaling metric and threshold, minimizing trial and error. Once you have a query defined, you can either deploy the autoscaler directly from Datadog or export the recommendation manifest to deploy via your preferred GitOps workflow.

Simplify autoscaling with integrated application metrics
Traditionally, scaling on custom metrics in Kubernetes has required deploying and maintaining extra components such as the Horizontal Pod Autoscaler, KEDA for event-driven scaling, or Prometheus adapters for metrics ingestion. With Datadog Kubernetes Autoscaling, you can scale on any application metric that Datadog collects, with no need to install and maintain additional services or adapters. This can simplify cluster management and help improve reliability by centralizing both scaling configuration and performance monitoring in one place. You can define custom scaling policies, adjust thresholds, and observe how scaling decisions affect workload performance and cost, all within the Datadog platform.
Scale smarter with Datadog Kubernetes Autoscaling
Custom Query Scaling aligns your scaling behavior with observed application performance. You can base your autoscaling activity on metrics that best capture user experience or workload demand, whether they measure queue length, request latency, or business KPIs. To get started, visit the Datadog Kubernetes Autoscaling documentation and learn how to enable Custom Query Scaling in your environment. And if you’re new to Datadog, sign up for a 14-day free trial.


