Aaron Kaplan
Boomi is a cloud-based integration platform that helps customers connect their applications, data sources, and other endpoints. But monitoring and troubleshooting Boomi Atoms—the runtime engines for Boomi integration processes—and the applications connected to them can be a challenge. Boomi automatically purges logs after 30 days, and users must frequently correlate data from various disconnected sources for visibility into their Boomi processes. As a result, users are often forced to investigate a range of potential failure points using disjointed, short-term telemetry data. This makes it difficult to get to the root of issues and draw important correlations across observability data, which can prolong incidents and impede performance.
We’re pleased to announce that the AtomWatch integration from Kitepipe, a cloud integration services firm that specializes in Boomi integration management, is now available in the Datadog Marketplace. AtomWatch is Kitepipe’s solution for monitoring Boomi processes using Datadog. It provides crucial visibility into Boomi and the applications connected to it within a single pane of glass, centralizing all logs and platform alerts from Boomi alongside logs from your Boomi runtime cloud provider.
With this integration, users can monitor critical Boomi metrics, logs, and events—including execution statistics, cluster statuses, and infrastructure health—within Datadog, using out-of-the-box (OOTB) dashboards and monitors. In this post, we’ll show you how you can use AtomWatch to:
Proactively monitor the health of your Boomi-connected applications
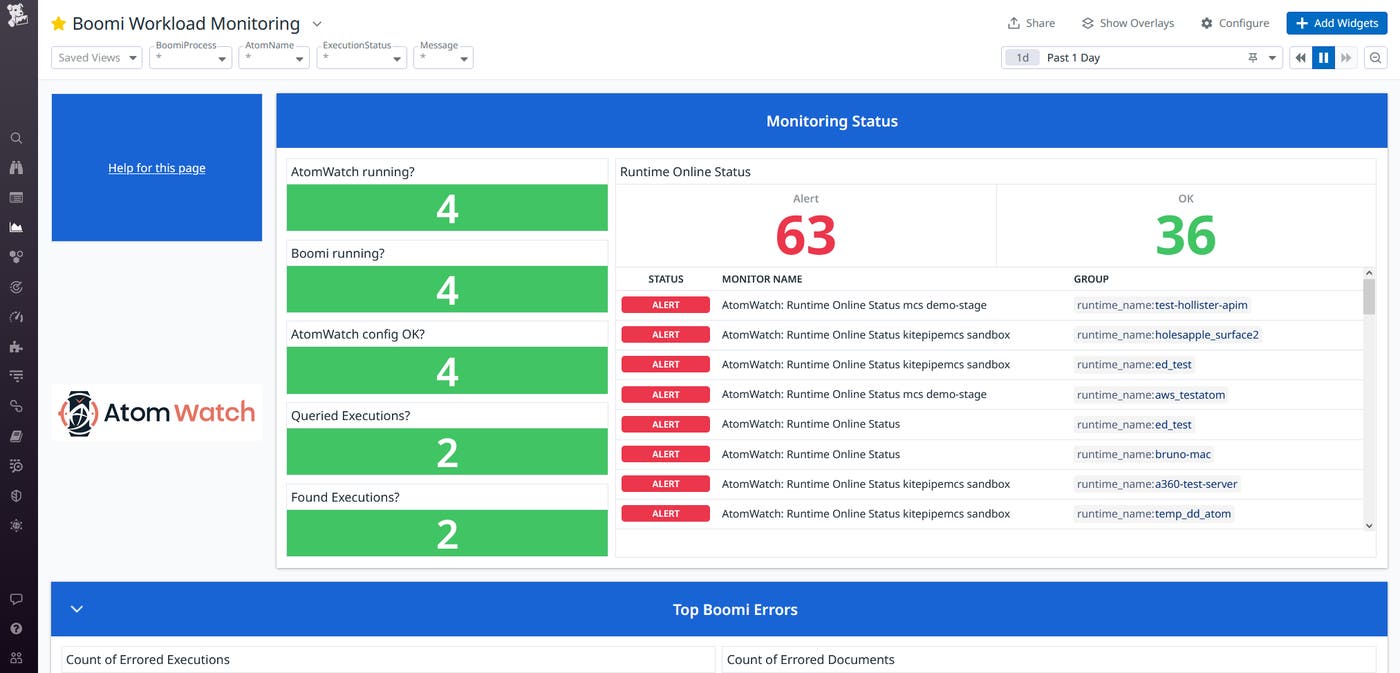
The OOTB AtomWatch Overview dashboard provides a high-level picture of the health and performance of your Boomi processes and resources, giving you a single view from which you can quickly troubleshoot and identify the root causes of issues in Boomi and the applications connected to it. This dashboard enables you to assess the overall health of all of your Boomi processes at a glance by highlighting an array of key metrics, including errors, anomalies in your process execution times, cluster issues, server health, and more.
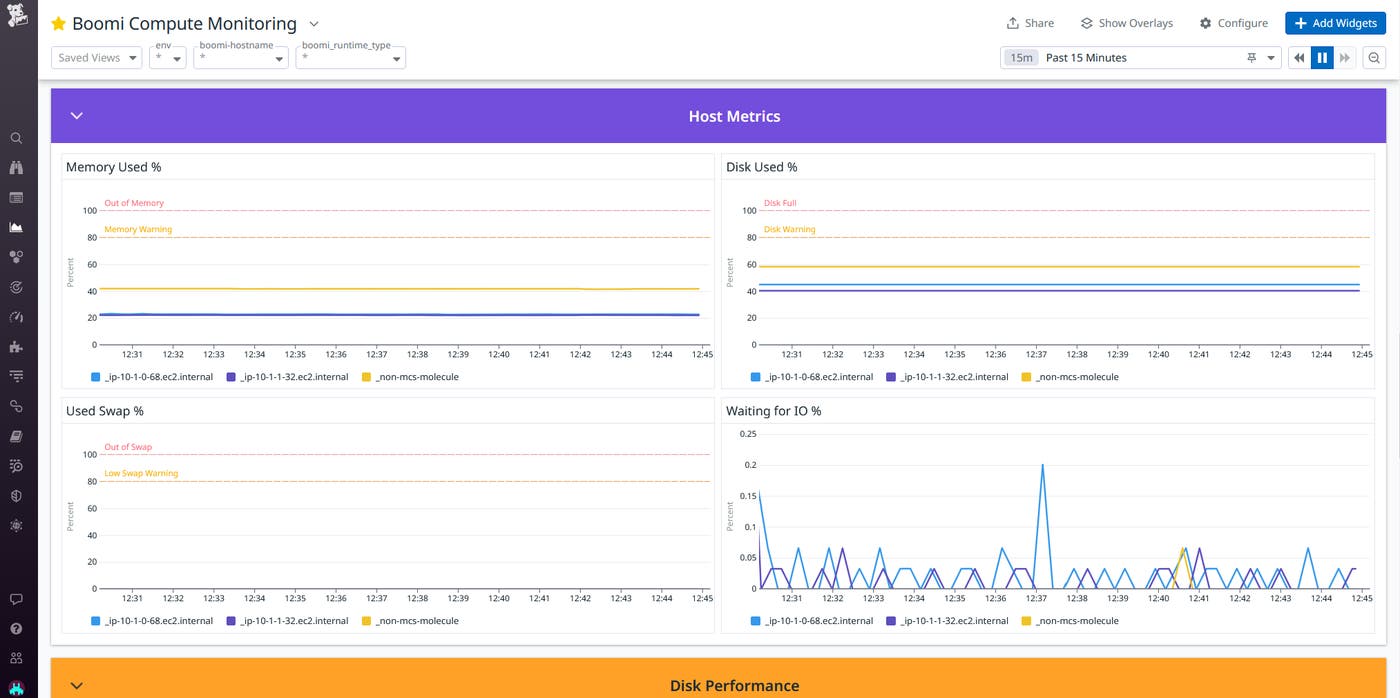
The AtomWatch Overview dashboard breaks these metrics down into three sections: Workload Monitoring, Cluster Monitoring, and Compute Monitoring. You can quickly navigate from each of these sections to a dedicated dashboard for each category of metrics in order to analyze your data in depth, which can be critical for troubleshooting and performance optimization. You can also customize these dashboards, as well as the AtomWatch Overview dashboard, to group related integrations in order to streamline your monitoring.
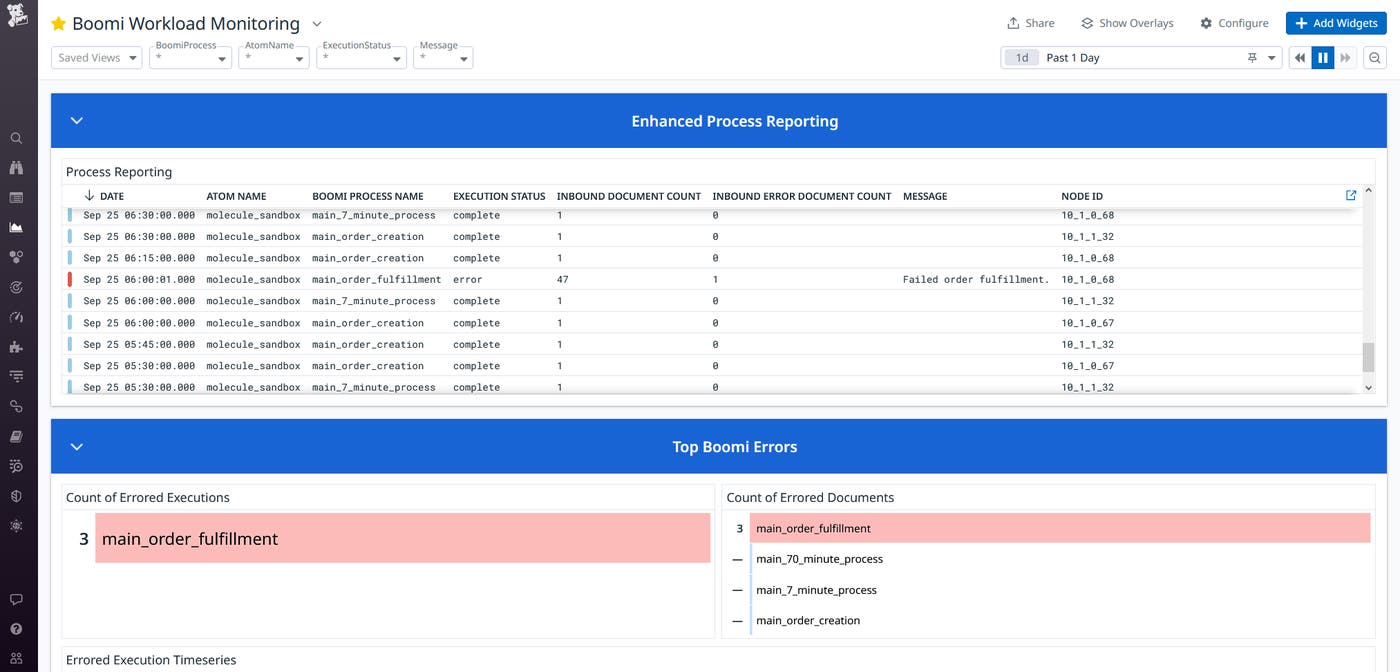
For example, the Boomi Workload Monitoring dashboard enables you to effectively analyze long-term health and performance trends by identifying the most error-prone, longest-running, and least performant Boomi processes, as well as the top errors in your processes. By graphing trends in Boomi process execution data on a scale of months instead of weeks, you can easily spot outliers and optimize accordingly.

To monitor the baseline health of your Boomi infrastructure, you can pivot to the Boomi Compute Monitoring dashboard, which provides in-depth analysis of your usage of Boomi compute resources within any given time frame, as well as network and disk performance.

To stay alert to changes in the performance of your Boomi processes, you can use AtomWatch’s recommended OOTB monitors. These monitors alert you to changes in the online status of Boomi runtimes, upticks in the time your processes are taking to execute, excessive resource saturation, and other issues. You can also configure your own alerts on critical processes, errors, and more to ensure a timely response to errors, downtime, and suboptimal performance. For example, AtomWatch queries the Boomi API to verify that each of your runtime servers is up and running. You can configure monitors in Datadog to alert you (or anyone else in your organization) if and when your runtimes go offline and return online.
Pinpoint the root causes of performance issues in Boomi
In addition to metrics, the AtomWatch Overview and the Boomi Workload and Compute Monitoring dashboards enable you to utilize Boomi logs more effectively. There are multiple log files for individual Boomi processes, and using Boomi’s native monitoring, users must correlate these logs manually through various separate interfaces. This process can be time-consuming and convoluted, but AtomWatch gives you access to all of your Boomi logs in one place to help expedite troubleshooting. What’s more, AtomWatch lets you use Boomi logs for long-term trend analysis. Boomi automatically purges user logs after 30 days, but with AtomWatch, you can use Datadog Log Management to retain Boomi logs for months or even years at a time. This provides granular visibility into long-term health and performance trends, which can be essential for identifying persistent but elusive issues so you can optimize performance.
By letting you quickly navigate all of your Boomi logs alongside key metrics, AtomWatch also enables you to quickly troubleshoot performance issues. SREs can use AtomWatch to quickly map strain on Boomi compute resources to specific process executions. They can then determine how to reschedule or redesign high-impact workloads, or make upgrades to infrastructure, in order to minimize end-user impact. You can select individual errors from the Enhanced Process Reporting section of the Boomi Workload Monitoring dashboard, for example, in order to quickly access key data. If there’s an uptick in the execution time of one of your Boomi processes, you can utilize the Workload and Compute Monitoring dashboards to investigate the issue in depth and troubleshoot the specific resources at the root of it.

Get enhanced visibility into your Boomi-managed integrations
With Kitepite’s AtomWatch offering in the Datadog Marketplace, you can enhance your proactive monitoring of the health and performance of your Boomi-managed integrations, and improve long-term trend analysis in order to home in on persistent, elusive issues and optimize performance.
You can get started by purchasing the AtomWatch integration in the Datadog Marketplace. If you don’t already have a Datadog account, you can sign up for a 14-day free trial today. The ability to promote branded marketing tools is a membership benefit offered through the Datadog Partner Network. If you’re interested in developing an integration or application that you’d like to promote, you can contact us at marketplace@datadog.com.

