Alexis Lê-Quôc
You can never have too much monitoring… Especially when it comes to (Elastic) Load Balancers. As the first gateway between your customers and your online business, load balancers need to be continuously monitored to be understood and managed. Any extra error, any additional latency will translate into a frustrated customer or a lost transaction.
AWS has been offering elastic load balancers (ELB) in their cloud since 2009. Yet compared to traditional “on-premise” offerings, AWS’ ELB have offered little monitoring hooks or metrics. That list has grown a lot more useful with the introduction of 3 additional metrics announced this week: BackendConnectionErrors, SurgeQueueLength, SpilloverCount.
Key AWS ELB monitoring metrics
As usual not all metrics are useful in all situations. This is a cheat sheet for sane AWS ELB monitoring:
- HealthyHostCount and Latency work hand-in-hand. You want to always have enough healthy server instances (at least 1) and keep the latency (expressed in seconds) low to avoid browser timeouts and sheer user frustration.
- HTTPCode_ELB_5XX counts the number of requests that fail at the load balancer level. As long as you have healthy server instances, that count should be 0. Any other values indicates an issue with the ELB itself, e.g. too many inbound requests. The “elastic” part of ELB should cause the ELB to grow to a bigger instance able to cope with the additional traffic.
- SurgeQueueLength measures the length of the queue that holds inbound requests waiting to be dispatched. That queue length should stay near 0 or requests are waiting in the ELB to be dispatched. Depending on the sensitivity of the application to latency, any time spent waiting to be dispatched could impact the client application and frustrate your user. Better to keep it near 0.
- SpillOverCount measures the number of requests that had to be rejected by the ELB because the SurgeQueueLength had reach a maximum. Any spill over is obviously bad. Regardless of the application, no server response will ever be sent back to the client (a.k.a. your service is partially in “talk to the hand” mode).
- BackendConnectionErrors measures the number of errors establishing the connection between the ELB and your servers. This happens before the ELB forwards data to your servers. Any errors mean that something’s not right between the ELB and your servers, a.k.a. “it’s the network” or your servers are misbehaving in a bad way.
“The rest”
The other metrics are secondary and not actionable:
- RequestCount is a good metric to normalize all the others to inbound traffic and answer questions such as: “is latency dependent on the number of requests?” or “how long are requests waiting for before they are returned, on average?”
- HTTPCode_ELB_4XX measures the amount of “garbage” your ELB receives. Any malformed HTTP request will increase this count. The world is full of inchoate HTTP requests, so move on.
- HTTPCode_backend_yXX measures the distribution of response codes that your servers are sending back. While it is good to compare over time, it does not really have anything to do with the ELB and can be measured with much more granularity elsewhere, e.g. using the server logs.
Composite ELB metrics
As is often the case, you need to use multiple metrics in conjunction to better understand the behavior of your load balancer.
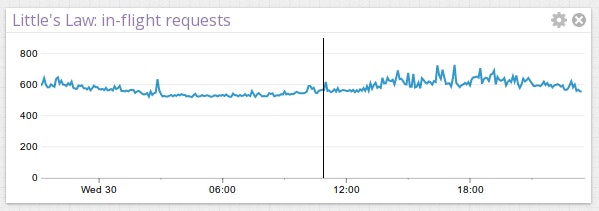
Here’s a quick example. If you want to compute the number of ELB requests in-flight in your application, you can simply multiply the arrival rate (i.e. the request count) with the latency to visualize the number of requests currently being served at any moment

thanks to the following graph description:
Caveat monitor
As is unfortunately the case with AWS CloudWatch metrics and counts in particular, the timeframe used for all metrics is only stated in passing in the documentation. That timeframe is 60 seconds. Which means that all the counts are really counts per minute.
If you use Datadog to retrieve Cloudwatch metrics (and use them to enrich/overlay/correlate-with your own metrics), rest assured we take care of normalizing all the counts to a per-second value, because pretty much all the other rates in the world of Web Operations are per-second rates. You can quickly get this level of insight into your ELBs by signing up for a free trial of Datadog.


